Baryon stopping as a signal of the mixed phase onset
Abstract
It is argued that the experimentally observed baryon stopping indicates a non-monotonous behaviour as a function of the incident energy of colliding nuclei. This can be quantified by a midrapidity reduced curvature of the net-proton rapidity spectrum and reveals itself as a zigzag irregularity in the excitation function of this curvature. The three-fluid dynamic calculations with a hadronic equation of state (EoS) fail to reproduce this irregularity. At the same time, the same calculations with an EoS involving a first-order phase transition and a crossover one into the quark-gluon phase do reproduce this zigzag behaviour, however only qualitatively.
I Introduction
A degree of stopping of colliding nuclei is one of the basic characteristics of the collision dynamics, which determines a part of the incident energy of colliding nuclei deposited into produced fireball and hence into production of secondary particles. The deposited energy in its turn determines the nature (hadronic or quark-gluonic) of the produced fireball and thereby its subsequent evolution. Therefore, a proper reproduction of the baryon stopping is of prime importance for theoretical understanding of the dynamics of the nuclear collisions.
A direct measure of the baryon stopping is the net-baryon rapidity distribution. However, since experimental information on neutrons is unavailable, we have to rely on proton data. Presently there exist extensive experimental data on proton (or net-proton) rapidity spectra at AGS E802 ; E877 ; E917 ; E866 and SPS NA49-1 ; NA49-04 ; NA49-06 ; NA49-07 ; NA49-09 energies. These data were analyzed within various models Bratk09 ; Bleicher09 ; Bratk04 ; WBCS03 ; Bratk02 ; Larionov07 ; Larionov05 ; 3FD ; 3FD-GSI07 The most extensive analysis has been done in Bratk02 ; 3FD . Since that time new data at SPS energies have appeared NA49-06 ; NA49-07 ; NA49-09 . Therefore, it is appropriate to repeat this analysis of already extended data set. Here it is done within the framework of the model of the three-fluid dynamics (3FD) 3FD . The 3FD model with the hadronic EoS gasEOS reasonably reproduces a great body of experimental data in a wide energy range from AGS to SPS, see 3FD ; 3FDflow ; 3FDpt ; 3FDv2 .
II Analysis of Experimental Data
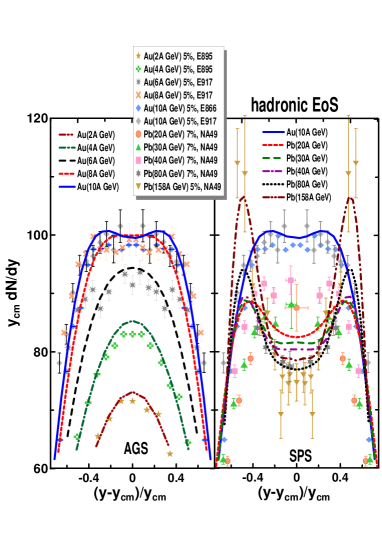
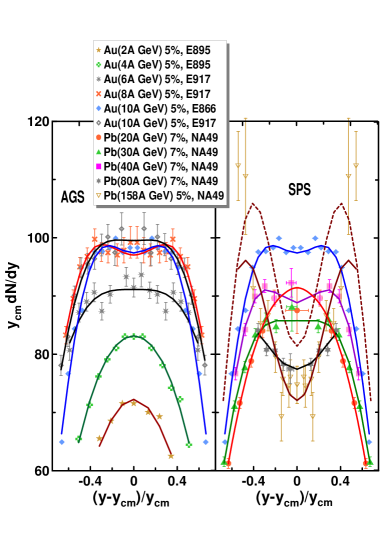
Available data on the proton (at AGS energies) and net-proton (at SPS energies) rapidity distributions from central heavy-ion collisions are confronted to results of the calculations within the 3FD model with hadronic EoS gasEOS in right panel of Fig. 1. Only the midrapidity region is displayed in Fig. 1, since it is of prime interest in the present consideration. The data at 10 GeV are repeated in the SPS-panels in order to keep the reference spectrum shape for the comparison. The data are plotted as functions of a “dimensionless” rapidity , where is the center-of-mass rapidity of colliding nuclei. In particular, this is the reason why the experimental distributions are multiplied . This representation is chosen in order to make different distributions of approximately the same width and the same height. This is convenient for comparison of shapes of these distributions.
As seen from Fig. 1, description of the rapidity distributions with the hadronic EoS is reported in 3FD ; 3FD-GSI07 . The reproduction of the distributions is quite good at the AGS energies and at the top SPS energies. At 40 GeV the description is still satisfactory. However, at 20 and 30 GeV the hadr.-EoS predictions completely disagree with the data 3FD-GSI07 . At 20 GeV instead of a bump at the midrapidity the hadronic scenario predicts a quite pronounced dip. In order to quantify this discrepancy, it is useful to fit the data by a simple formula
| (1) |
where , and are parameters of the fit. The form (1) is a sum of two thermal sources shifted by from the midrapidity. The width of the sources can be interpreted as (temperature)/(transverse mass), if we assume that collective velocities in the sources have no spread with respect to the source rapidities . The parameters of the two sources are identical (up to the sign of ) because we consider only collisions of identical nuclei. Results of these fits are demonstrated in the right panel of Fig. 1.
The above fit has been done by the least-squares method. Data were fitted in the rapidity range . The choice of this range is dictated by the data. As a rule, the data are available in this rapidity range, sometimes the data range is even more narrow (40, 80 GeV and new data at 158 GeV NA49-09 ). We put the above restriction in order to treat different data in approximately the same rapidity range. Notice that the rapidity range should not be too wide in order to exclude contribution of cold spectators.
We met problems with fitting the data at 80 GeV NA49-07 and the new data at 158 GeV NA49-09 . These data do not go beyond the side maxima in the rapidity distributions. The fit within such a narrow region results in the source rapidities very close (at 80 GeV) or even exceeding (at 158 GeV) and a huge width . As a result, the normalization of the net-proton rapidity distributions, as calculated with fit (1), turns out to be 330 (at 80 GeV) and 400 (at 158 GeV), which are considerably larger than the total proton number in colliding nuclei (=164). To avoid this problem, we performed a biased fit of these data. An additional condition restricted the total normalization of distribution (1) to be less than the total proton number in colliding nuclei (=164). This biased fit is the reason why the curve fitted to the new data at 158 GeV does not perfectly hit the experimental points. In particular, because of this problem we keep the old data at 158 GeV NA49-1 in the analysis. We also use old data at 40 GeV, corresponding to centrality 7% NA49-07 , instead of recently published new data at higher (5%) centrality NA49-09 , since the data at the neighboring energies of 20, 30 and 80 GeV are known only at centrality 7% NA49-07 . Similarity of conditions, at which the data were taken, prevents excitation functions, which are of prime interest here, from revealing artificial irregularities.
III Parameters of the Fit
Energy dependence of parameters and deduced from these fits of the data revels no significant irregularities: they monotonously rise with the energy. At the same time, inspection of the evolution of the spectrum shape with the incident energy rise reveals an irregularity. Beginning from the lowest AGS energy to the top one the shape of the spectrum evolves from convex to slightly concave at 10 GeV. However, at 20 GeV the shape again becomes distinctly convex. With the further energy rise the shape again transforms from the convex form to a highly concave one. In order to quantify this trend, we introduce a reduced curvature of the spectrum in the midrapidity defined as follows
| (2) |
This curvature is defined with respect to the “dimensionless” rapidity . The factor is introduced in order to get rid of overall normalization of the spectrum, i.e. of the parameter in terms of fit (1). The second part of Eq. (2) presents this curvature in terms of parameters of fit (1).
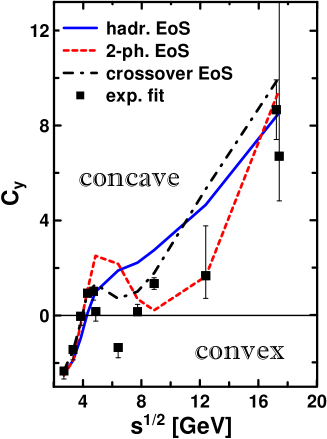
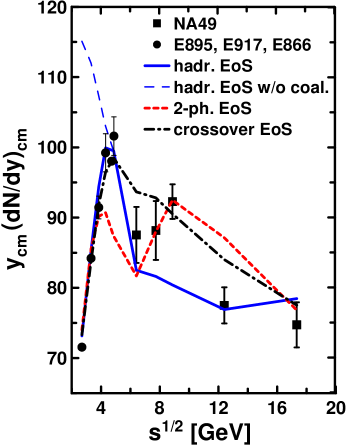
Thus, the reduced curvature, , and the midrapidity value, , are two independent quantities quantifying the the spectrum in the midrapidity range. Excitation functions of these quantities Values of the curvature deduced both from fit (1) to experimental data and from the same fit of the results of the 3FD calculation with different EoS’s are displayed in Fig. 2. 3FD calculations with hadronic EoS (hadr. EoS) gasEOS , as well as with EoS’s involving a first-order phase transition (2-ph. EoS) and a crossover phase transition (crossover EoS) into the quark-gluon phase Toneev06 are presented. Notice that a maximum in at GeV happens only because the light fragment production becomes negligible above this energy. The 3FD calculation without coalescence (i.e. without the fragment production) reveals a monotonous decrease of beginning from GeV, i.e. from the lowest energy considered here.
To evaluate errors of values deduced from data, we estimated the errors produced by the least-squares method, as well as performed fits in different the rapidity ranges: and , where it is appropriate, and also fits of the data at 80 GeV NA49-07 and the new data at 158 GeV NA49-09 with different bias on the overall normalization of the distributions: (i.e., half of the net-nucleons can be participant protons) and (which is the hydrodynamic normalization of the distribution). The error bars present largest uncertainties among mentioned above. The lower point at GeV corresponds to the new data at 158 GeV. Its upper error, as well as that of 80-GeV point, results from the uncertainty of the normalization.
The irregularity observed in Fig. 1 is distinctly seen here as a zigzag irregularity in the energy dependence of . A remarkable observation is that the curvature energy dependence in the first-order-transition scenario manifests qualitatively the same zigzag irregularity (left panel of Fig. 2), as that in the data fit, while the hadronic scenario produces purely monotonous behaviour. This zigzag irregularity of the first-order-transition scenario is also reflected in the midrapidity values of the (net)proton rapidity spectrum (right panel of Fig. 2). As for the experimental data, it is still difficult to judge if the zigzag anomaly in the midrapidity values is statistically significant. In the conventional representation of the data without multiplying by , the irregularity of the data is hardly visible Ivanov:2010cu . The crossover EoS represents a smooth phase transition, therefore, it is not surprising that it produces only a wiggle in , which again only qualitatively resembles the experimental behavior.
The baryon stopping depends on a character of interactions (e.g., cross sections) of the matter constituents. If during the interpenetration stage of colliding nuclei a phase transformation111The term “phase transition” is deliberately avoided, since it usually implies thermal equilibrium. of the hadronic matter into quark-gluonic one happens, one can expect a change of the stopping power of the matter at this time span. This is a natural consequence of a change of the constituent content of the matter because hadron-hadron cross sections differ from quark-quark, quark-gluon, etc. ones. This naturally results in a non-monotonous behaviour of the shape of the (net)proton rapidity-spectrum at an incident energy, where onset of the phase transition occurs.
However, if even the same friction is used in both phases, the calculated (with 2-ph. EoS) reduced curvature still reveals a zigzag behaviour but with considerably smaller amplitude, as it was demonstrated in Ivanov:2010cu . This happens because the EoS in a generalized sense of this term, i.e. viewed as a partition of the total energy between kinetic and potential parts, also affects the stopping power. The friction is proportional to the relative velocity of the counter-streaming nuclei 3FD . Therefore, it is more efficient when the kinetic-energy part of the total energy is higher, i.e. when the EoS is softer. This is precisely what the phase transition does: it makes the EoS essentially softer in the mixed-phase region. The latter naturally results in a non-monotonous evolution of the proton rapidity spectra with the energy rise.
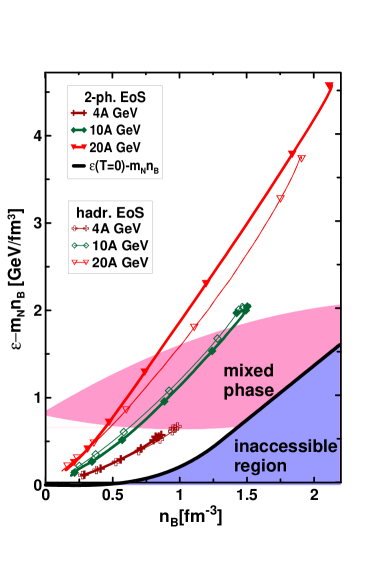
Figure 3 demonstrates that the onset of the phase transition in the calculations indeed happens at top-AGS–low-SPS energies, where the zigzag irregularity takes place. Similarly to that it has been done in Randrup07 , the figure displays dynamical trajectories of the matter in the central box placed around the origin in the frame of equal velocities of colliding nuclei: 2 fm, 2 fm and 2 fm, where is Lorentz factor associated with the initial nuclear motion in the c.m. frame. Initially, the colliding nuclei are placed symmetrically with respect to the origin , is the direction of the beam. The - representation is chosen because these densities are dynamical quantities and, therefore, are suitable to compare calculations with different EoS’s. Subtraction of the term is taken for the sake of suitable representation of the plot. Only expansion stages of the evolution are displayed, where the matter in the box is already thermally equilibrated. The size of the box was chosen to be large enough that the amount of matter in it can be representative to conclude on the onset of the phase transition and to be small enough to consider the matter in it as a homogeneous medium. Nevertheless, the matter in the box still amounts to a minor part of the total matter of colliding nuclei. Therefore, only the minor part of the total matter undergoes the phase transition at 10 GeV energy. As seen, the trajectories for two different EoS’s are very similar at AGS energies and start to differ at SPS energies because of the effect of the phase transition.
IV Conclusions
In conclusion, it is argued that the experimentally observed baryon stopping indicates a non-monotonous behaviour as a function of the incident energy of colliding nuclei. This reveals itself in a zigzag irregularity in the excitation function of a midrapidity reduced curvature of the (net)proton rapidity spectrum. The energy location of this anomaly coincides with the previously observed anomalies for other hadron-production properties at the low SPS energies Alt:2007fe ; Gazdzicki:1998vd . The 3FD calculation with the hadronic EoS fails to reproduce this irregularity. At the same time, the same calculations with the EoS involving a first-order phase transition (within the Gibbs construction) and a crossover one into the quark-gluon phase Toneev06 reproduce this zigzag behaviour, however only qualitatively. Preliminary simulations with the EoS of Sat08 , also based on the first-order phase transition but within the Maxwell construction, show the same qualitative trend. It is argued that the non-monotonous behaviour of the baryon stopping is a natural consequence of a phase transition. The question why these calculations do not qualitatively reproduce the zigzag irregularity deserves special discussion elsewhere. It is very probable that the Gibbs and Maxwell constructions are inappropriate for the fast dynamics of the heavy-ion collisions Randrup09 ; Voskre09 and metastable states should be explicitly considered.
It is somewhat suspicious that the zigzag irregularity happens at the border between the AGS and SPS energies. It could imply that this irregularity results from different ways of selecting central events in AGS and SPS experiments. Moreover, all data at SPS, except for those at the energy 158 GeV, still have preliminary status. Rapidity range of data at 80 and 158 GeV is too narrow for their reliable analysis. All this indicates that upgraded data are desperately needed to either confirm or discard the existence of the zigzag irregularity. It would be highly desirable if these new data are taken within the same experimental setup and at the same centrality selection. Hopefully such data will come from new accelerators FAIR at GSI and NICA at Dubna, as well as from the low-energy-scan program at RHIC. In this respect the NICA project looks the most promising, since it covers the whole energy range of interest. The discussed possibility to detect neutrons in the NICA/MPD detector could provide information on real baryon stopping irrespective of any assumptions on redistribution of baryon charge between net protons and neutrons.
Fruitful discussions with B. Friman, M. Gazdzicki, J. Knoll, P. Senger, H. Ströbele, V.D. Toneev and D.N. Voskresensky are gratefully acknowledged. I am grateful to A.S. Khvorostukhin, V.V. Skokov, and V.D. Toneev for providing me with the tabulated 2-ph. and crossover EoS’s. I am grateful to members of the NA49 Collaboration for providing me with the experimental data in the digital form. This work was supported in part by DFG projects 436 RUS 113/558/0-3 and WA 431/8-1, the RFBR grant 09-02-91331 NNIO_a, and grant NS-7235.2010.2.
References
- (1) L. Ahle et al. (E802 Collab.), Phys. Rev. C 60, 064901 (1999).
- (2) J. Barrette et al. (E877 Collab.), Phys. Rev. C 62, 024901 (2000).
- (3) B. B. Back et al., (E917 Collab.), Phys. Rev. Lett. 86 , 1970 (2001).
- (4) J. Stachel, Nucl. Phys. A654, 119c (1999).
- (5) H. Appelshäuser et al. (NA49 Collab.), Phys. Rev. Lett. 82, 2471 (1999).
- (6) T. Anticic et al. (NA49 Collab.), Phys. Rev. C 69, 024902 (2004).
- (7) C. Alt et al. (NA49 Collab.), Phys. Rev. C 73, 044910 (2006).
- (8) C. Blume (NA49 Collab.), J. Phys. G34, S951 (2007).
- (9) H. Strobele (NA49 Collab.), e-Print: arXiv:0908.2777 [nucl-ex].
- (10) W. Cassing and E. L. Bratkovskaya, e-Print: arXiv:0907.5331 [nucl-th].
- (11) J. Steinheimer et al., e-Print: arXiv:0905.3099 [hep-ph]
- (12) E. L. Bratkovskaya, M. Bleicher, M. Reiter, S. Soff, H. Stoecker, M. van Leeuwen, S. A. Bass, and W. Cassing, Phys. Rev. C 69, 054907 (2004).
- (13) H. Weber, E. L. Bratkovskaya, W. Cassing, and H. Stöcker, Phys. Rev. C 67, 014904 (2003).
- (14) H. Weber, E. L. Bratkovskaya, and H. Stoecker, Phys. Rev. C 66, 054903 (2002).
- (15) A. B. Larionov, O. Buss, K. Gallmeister, and U. Mosel, Phys. Rev. C 76, 044909 (2007).
- (16) M. Wagner, A. B. Larionov, and U. Mosel, Phys. Rev. C 71, 034910 (2005).
- (17) Yu. B. Ivanov, V. N. Russkikh, and V.D. Toneev, Phys. Rev. C 73, 044904 (2006).
- (18) Yu. B. Ivanov and V. N. Russkikh, PoS(CPOD07)008 (2007), arXiv:0710.3708 [nucl-th].
- (19) V. M. Galitsky and I. N. Mishustin, Sov. J. Nucl. Phys. 29, 181 (1979).
- (20) V. N. Russkikh and Yu. B. Ivanov, Phys. Rev. C 74 (2006) 034904.
- (21) Yu. B. Ivanov and V. N. Russkikh, Eur. Phys. J. A 37, 139 (2008); Phys. Rev. C 78, 064902 (2008).
- (22) Yu. B. Ivanov, I. N. Mishustin, V. N. Russkikh, and L. M. Satarov, Phys. Rev. C 80, 064904 (2009).
- (23) A. S. Khvorostukhin, V. V. Skokov, K. Redlich, and V. D. Toneev, Eur. Phys. J. C48, 531 (2006).
- (24) Yu. B. Ivanov, Phys. Lett. B 690, 358 (2010).
- (25) C. Alt et al. [NA49 Collab.], Phys. Rev. C 77, 024903 (2008).
- (26) C. Alt et al. (NA49 Collab.), Phys. Rev. C 68, 034903 (2003).
- (27) B. I. Abelev et al. [STAR Collab.], Phys. Rev. C 79, 034909 (2009).
- (28) I. C. Arsene, et al., Phys. Rev. C 75, 034902 (2007).
- (29) M. Gazdzicki and M. I. Gorenstein, Acta Phys. Polon. B 30, 2705 (1999).
- (30) L. M. Satarov, M. N. Dmitriev, and I. N. Mishustin, Yad. Fiz. 72, 1444 (2009) [Phys. Atom. Nucl. 72, 1390 (2009)].
- (31) J. Randrup, Phys. Rev. C 79, 054911 (2009).
- (32) V. V. Skokov and D. N. Voskresensky, JETP Lett. 90, 223 (2009); Nucl. Phys. A828, 401 (2009).