Determination of from decays and related modes
Eugenia Maria Teresa Irene Puccio111Speaker on behalf of the BABAR Collaboration
Department of Physics
University of Warwick, Coventry, CV4 7AL, UK
We present the status of recent results from the BABAR and Belle experiments on the measurement of the angle from the Dalitz plot analyses of and .
PROCEEDINGS OF
CKM2010, the 6th International Workshop on the CKM Unitarity Triangle
University of Warwick, UK, September 6–10, 2010
1 Introduction
At tree level, decays are sensitive to through the relation
| (1) |
where and are the decay amplitude and its charge conjugate respectively. To measure , three-body decays have an advantage over quasi-two body decays since can interfere through the same final state in . By measuring the interference pattern in the Dalitz plot, it is possible to determine not only magnitudes of the amplitudes as in the two body decays but also the relative phases between the amplitudes. The cleanest method to determine from Dalitz plots involves the charmless decays and [1, 2]. The method involves forming isospin triangles from intermediate modes in and . By using isospin decomposition, the QCD penguin contributions in decays are cancelled and the resultant amplitude is as follows:
| (2) |
with an equivalent amplitude for the charge-conjugate state, . In the absence of electroweak penguins(EWP), carries a weak phase so that in this limit
| (3) |
The phase can be determined by measuring the following quantities:
-
•
phase , between and in .
-
•
phase , between and in ;
-
•
its charge conjugate equivalent in ;
This method to extract is similar to the Snyder-Quinn method used to obtain from [3]. amplitudes, measured from the three body decay of , are used in this method to provide an SU(3) correction for EWP contributions, necessary to obtain a constraint for .
2 Experimental Results:
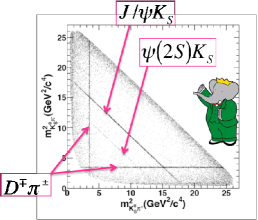
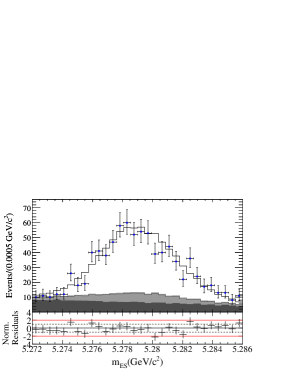
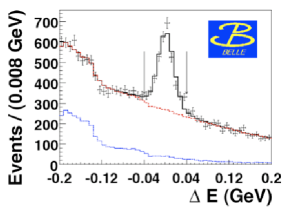
The Dalitz plot provides the phase difference between and measured from To obtain , the phases need to be measured relative to each other, taking into account also the additional phase of . The relative phases are determined at the interference regions around the edges of the Dalitz plot. However the overlap region of resonances is small and the effect on event density small, making it crucial to understand backgrounds and efficiencies in the interference regions. The main background contribution in this Dalitz plot is found to come from continuum events and those are mostly rejected by a Neural Network. The remaining background contribution are meson decays to charm final states, shown as bands in the resultant Dalitz plot distribution in Figure 1. Projection plots for signal and background of discriminating variables, taken from the BABAR result of million events [4] and from the Belle result of million events [5], are also shown in Figure 1.
 |
 |
 |
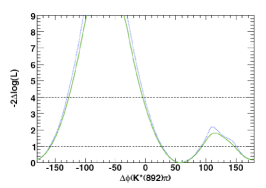
The results of the likelihood scans for are shown in Figure 2 and summarised in Table 1. Two fit solutions are found corresponding to the interference between and the nonresonant component. These two solutions give different results for the values of . There is some disagreement between the BABAR and Belle results. The experimentally measured values of shown in Table 1 include the mixing phase and this has to be removed before the values can be used in the extraction of .
 |
 |
 |
| Experiment | |
|---|---|
| BABAR Soln. 1 | |
| BABAR Soln. 2 | |
| Belle Soln. 1 | |
| Belle Soln. 1 |
3 Experimental Results: and
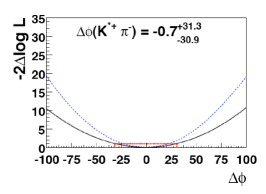
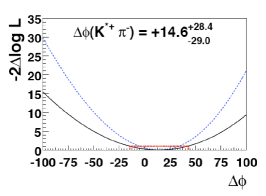
The other two parameters required to determine are and its charge conjugate, . These are the relative phases between and and and respectively:
| (4) |
Both of these relative phases are determined from Dalitz plot analysis of and its charge conjugate. Preliminary results are available from the full BABAR dataset of million events [7]. Expanding Eq. 3, is obtained from the combination of the phases and and subtracting the phase obtained from the time-dependent Dalitz plot analysis of .
4 Issues with interpretation
The choice of the phase convention is important when combining the results since failure to take the convention into account can result in a shift in relative phase [8]. The amplitude is proportional to the cosine of a helicity angle between the final states particles in a three-body decay. The helicity convention defines an ordering of particles in the SU(2) decomposition that can introduce a sign flip in Eq. 2. Therefore relative phases between vector amplitudes need to be interpreted with respect to a given helicity convention. Another issue with the interpretation of the results is that whereas QCD penguin contributions cancel in the sum of so that Eq. 2 is QCD penguin free, EW penguin contributions still need to be accounted for. SU(3) decomposition of operators gives a good approximation to
| (5) |
where and are the tree and EW penguin contributions respectively. in Eq. 5 depends only on EW physics and is well known to a theoretical error below with . The quantity is the ratio of hadronic matrix elements and is measured from [2, 6]:
| (6) |
Current experimental results for these quantities are shown in Table 2. decays have well known BFs and , however amplitudes for decays are small but the relative phases are unknown. The strategy used is to separate the ratio into well-measured components, add the ratio as a systematic uncertainty and account for of SU(3) breaking. Preliminary results for and subsequently for the EW penguin to tree amplitude ratio are [7]
| (7) | |||||
| (8) | |||||
| (9) | |||||
| (10) |
The systematic uncertainty is the dominant source of error in this measurement and can only be eliminated by measuring the relative phases for and .
| Decay model | BF | |
|---|---|---|
5 Conclusion
BABAR results for are in process of being finalised and results should soon be combined to form the CKM constraint. The angle can also be measured by looking at the phase difference from and . Tree to QCD penguin ratio is expected to be larger in than in giving a potentially better sensitivity to . This method is also quite promising for future experiments. A Super B factory can expect results with uncertainties a factor smaller than BABAR’s. LHCb could also have potential for these measurements and additionally study the constraint in the decays [10].
ACKNOWLEDGEMENTS
I am grateful to the organisers and participants of CKM 2010 for this opportunity to present and discuss these results. I would like to also thank my colleagues on BABAR and Belle who have made these measurements possible. In particular I would like to thank Tim Gershon, Thomas Latham, Mathew Graham and Andrew Wagner for their help and support in preparing this presentation.
References
- [1] M. Ciuchini, M. Pierini and L. Silvestrini, Phys. Rev. D 74 (2006) 051301
- [2] M. Gronau, D. Pirjol, A. Soni and J. Zupan, Phys. Rev. D 75, 014002 (2007) Phys. Rev. D 77, 057504 (2008) [Addendum-ibid. D 78, 017505 (2008)] M. Gronau, D. Pirjol and J. Zupan, Phys. Rev. D 81, 094011 (2010)
- [3] A. E. Snyder and H. R. Quinn, Phys. Rev. D 48, 2139 (1993).
- [4] B. Aubert et al. [BABAR Collaboration], Phys. Rev. D 80, 112001 (2009)
- [5] J. Dalseno et al. [Belle Collaboration], Phys. Rev. D 79, 072004 (2009)
- [6] M. Antonelli et al., Phys. Rept. 494, 197 (2010), pp. 276–280
- [7] A. Wagner, PhD Thesis, SLAC-R-942 (2010).
- [8] M. Gronau, D. Pirjol and J. L. Rosner, Phys. Rev. D 81, 094026 (2010)
- [9] The Heavy Flavor Averaging Group et al., arXiv:1010.1589 [hep-ex].
- [10] M. Ciuchini, M. Pierini and L. Silvestrini, Phys. Lett. B 645, 201 (2007)