Ordered magnetic fields around radio galaxies: evidence for interaction with the environment
Abstract
We present detailed imaging of Faraday rotation and depolarization for the radio galaxies 0206+35, 3C 270, 3C 353 and M 84, based on Very Large Array observations at multiple frequencies in the range 1365 to 8440 MHz. All of the sources show highly anisotropic banded rotation measure (RM) structures with contours of constant RM perpendicular to the major axes of their radio lobes. All except M 84 also have regions in which the RM fluctuations have lower amplitude and appear isotropic. We give a comprehensive description of the banded RM phenomenon and present an initial attempt to interpret it as a consequence of interactions between the sources and their surroundings. We show that the material responsible for the Faraday rotation is in front of the radio emission and that the bands are likely to be caused by magnetized plasma which has been compressed by the expanding radio lobes. We present a simple model for the compression of a uniformly-magnetized external medium and show that RM bands of approximately the right amplitude can be produced, but for only for special initial conditions. A two-dimensional magnetic structure in which the field lines are a family of ellipses draped around the leading edge of the lobe can produce RM bands in the correct orientation for any source orientation. We also report the first detections of rims of high depolarization at the edges of the inner radio lobes of M 84 and 3C 270. These are spatially coincident with shells of enhanced X-ray surface brightness, in which both the field strength and the thermal gas density are likely to be increased by compression. The fields must be tangled on small scales.
keywords:
– galaxies: magnetic fields – radio continuum: galaxies – (galaxies:) intergalactic medium – X-rays: galaxies: clusters1 Introduction
The detection of diffuse synchrotron emission (radio halos) on Mpc scales in an increasing number of galaxy clusters provides good evidence for a distributed magnetic field of Gauss strength in the hot intracluster medium (ICM; see e.g. Ferrari et al. 2008 for a review). Imaging of Faraday rotation of linearly-polarized radio emission from embedded and background sources confirms that there are fields associated with thermal plasma along lines of sight through the clusters (e.g. Carilli & Taylor 2002). Observations of Faraday rotation can also be made for radio galaxies in sparser environments, allowing the study of magnetic fields in environments too sparse for radio halos to be detected (e.g. Laing et al. 2008; Guidetti et al. 2010).
The Faraday effect (Faraday, 1846) is the rotation suffered by linearly polarized radiation travelling through a magnetized medium, and can be described by the two following relations:
| (1) |
with
| (2) |
where and are the -vector position angle of linearly polarized radiation observed at wavelength and the intrinsic angle, respectively, is the electron gas density, is the magnetic field along the line-of-sight (), and is the integration path. RM is the rotation measure.
Observations of Faraday rotation variations across extended radio galaxies allow us to derive information about the integral of the density-weighted line-of-sight field component. The hot ( K) plasma emits in the X-ray energy band via thermal bremsstrahlung. When high quality X-ray data for a radio-source environment is available, it is possible to infer the gas density distribution and therefore to separate it from that of the magnetic field, subject to some assumptions about the relation of field strength and density.
Most of the RM images of radio galaxies published so far show patchy structures with no clear preferred direction, consistent with isotropic foreground fluctuations over a range of linear scales ranging from tens of kpc to 100 pc (e.g. Govoni et al. 2006; Guidetti et al. 2008; Laing et al. 2008; Guidetti et al. 2010). Numerical modelling has demonstrated that this type of complex RM structure can be accurately reproduced if the magnetic field is randomly variable with fluctuations on a wide range of spatial scales, and is spread throughout the whole group or cluster environment (e.g. Murgia et al. 2004; Govoni et al. 2006; Guidetti et al. 2008; Laing et al. 2008; Guidetti et al. 2010; Vacca et al. 2010). These authors used forward modelling, together with estimators of the spatial statistics of the RM distributions (structure and autocorrelation functions or a multi-scale statistic) to estimate the field strength, its relation to the gas density and its power spectrum. The technique of Bayesian maximum likelihood has also been used for this purpose (Enßlin & Vogt, 2005; Kuchar & Enßlin, 2009).
In order to derive the three-dimensional magnetic field power spectrum, all of these authors had to assume statistical isotropy for the field, since only the component of the magnetic field along the line-of-sight contributes to the observed RM. This assumption is consistent with the absence of a preferred direction in most of the RM images.
In contrast, the present paper reports on anisotropic RM structures, observed in lobed radio galaxies located in different environments, ranging from a small group to one of the richest clusters of galaxies. The RM images of radio galaxies presented in this paper show clearly anisotropic “banded” patterns over part or all of their areas. In some sources, these banded patterns coexist with regions of isotropic random variations. The magnetic field responsible for these RM patterns must, therefore, have a preferred direction.
One source whose RM structure is dominated by bands is already known: M 84 (Laing & Bridle, 1987). In addition, there is some evidence for RM bands in sources which also show strong irregular fluctuations, such as Cygnus A (Carilli & Taylor, 2002). It is possible, however, that some of the claimed bands could be due to imperfect sampling of an isotropic RM distribution with large-scale power, and we return to this question in Section 9.1.
The present paper presents new RM images of three sources which show spectacular banded structures, together with improved data for M 84. The environments of all four sources are well characterized by modern X-ray observations, and we give the first comprehensive description of the banded RM phenomenon. We present an initial attempt to interpret the phenomenon as a consequence of source-environment interactions and to understand the difference between it and the more usual irregular RM structure.
The RM images reported in this paper are derived from new or previously unpublished archive Very Large Array (VLA)111The Very Large Array is a facility of the National Science Foundation, operated under cooperative agreement by Associated Universities, Inc. data for the nearby radio galaxies 0206+35, M 84 (Laing et al., 2011), 3C 270 (Laing, Guidetti & Bridle, 2011) and 3C 353 (Swain, private communication; see Swain 1996).
The paper is organized as follows. In Section 2 the radio and X-ray properties of the sources under investigation are presented and in Section 3 we briefly summarize the techniques used to analyse depolarization and two-dimensional variations of RM. Sections 4 and 5 present the RM and depolarization images on which our analysis is based and correlations between the two quantities. In Section 6, we evaluate the RM structure functions in regions where the fluctuations appear to be isotropic and derive the power spectra. A simple model of the source-environment interaction which characterises the effects of compression of a magnetised IGM is described in Section 7. This can produce RM bands, but only under implausible special initial conditions. Empirical “draped” field configurations which are able to reproduce the banded RM distributions are investigated in Section 8. In Section 9, we speculate on correlations between radio source morphology, and RM anisotropy, discuss other examples from the literature, consider the effects of an isotropic foreground Faraday screen on the detectability of RM bands and briefly discuss possible asymmetries in the amplitude of the RM bands between the approaching and receding lobes. Finally, Section 10 summarizes our conclusions.
Throughout this paper we assume a CDM cosmology with = 71 km s-1Mpc-1, = 0.3, and = 0.7.
2 The Sample
High quality radio and X-ray data are available for all of the sources. In this Section we summarize those of their observational properties which are relevant to our RM study. A list of the sources and their general parameters is given in Table 1, while Table 2 shows the X-ray parameters taken from the literature and equipartition parameters derived from our radio observations.
The sources were observed with the VLA at several frequencies, in full polarization mode and with multiple configurations so that the radio structure is well sampled. The VLA observations, data reduction and detailed descriptions of the radio structures are given for 0206+35 and M 84 by Laing et al. (2011), for 3C 270 by Laing, Guidetti & Bridle (2011), and for 3C 353 by Swain (1996). All of the radio maps show a core, two sided jets and a double-lobed structure with sharp brightness gradients at the leading edges of both lobes. The synchrotron minimum pressures are all significantly lower than the thermal pressures of the external medium (Table 2).
All of the sources have been observed in the soft X-ray band by more than one satellite, allowing the detection of multiple components on cluster/group and sub-galactic scales. The X-ray morphologies are characterized by a compact source surrounded by extended emission with low surface brightness. The former includes a non-thermal contribution, from the core and the inner regions of the radio jets and, in the case of 0206+35 and 3C 270, a thermal component which is well fitted by a small core radius model. The latter component is associated with the diffuse intra-group or intra-cluster medium. Parameters for all of the thermal components, derived from X-ray observations, are listed in Table 2. Because of the irregular morphology of the hot gas surrounding 3C 353 and M 84, it has not been possible to fit models to their X-ray radial surface brightness profiles.
| source | RA | DEC | z | kpc/arcsec | FR class | LAS | log | env. | ref. | ||
| [J2000] | [J2000] | [arcsec] | [W Hz-1] | [degree] | |||||||
| 0206+35 (4C 35.03) | 02 09 38.6 | +35 47 50 | 0.0377 | 0.739 | I | 90 | 24.8 | 40 | group | 1 | |
| 3C 353 | 17 20 29.1 | -00 58 47 | 0.0304 | 0.601 | II | 186 | 26.3 | 90 | poor cluster | 2 | |
| 3C 270 | 12 19 23.2 | +05 49 31 | 0.0075 | 0.151 | I | 580 | 24.4 | 90 | group | 3 | |
| M 84 | 12 25 03.7 | +12 53 13 | 0.0036 | 0.072 | I | 150 | 23.2 | 60 | rich cluster | 3 | |
| References for the environmental classification: (1) Miller et al. (2002); (2) de Vaucoleurs (1991); (3) Trager et al. (2000). | |||||||||||
| source | band | ref. | ||||||||||
| [keV] | [keV] | [kpc] | [cm-3] | [kpc] | [cm-3] | [dyne cm-2] | [dyne cm-2] | G | ||||
| 0206+35 | 0.2-2.5 | 1.3 | 22.2 | 2.4 10-3 | 0.35 | 0.85 | 0.42 | 0.70 | 9.6 10-12 | 4.31 10-13 | 5.70 | 1, 2 |
| 3C 353 | ” | 4.33 | 1.66 10-12 | 11.2 | 3 | |||||||
| 3C 270 | 0.3-7.0 | 1.45 | 36.8 | 7.7 10-3 | 0.30 | 1.1 | 0.34 | 0.64 | 5.75 10-12 | 1.64 10-13 | 3.71 | 4 |
| M 84 | 0.6-7.0 | 0.6 | 5.280.08 | 0.42 | 1.400.03 | 1.70 10-11 | 1.07 10-12 | 9.00 | 5 | |||
| References: (1) Worrall & Birkinshaw (2000); (2)Worrall, Birkinshaw & Hardcastle (2001); (3) Iwasawa et al. (2000); (4) Croston et al. (2008); (5) (Finoguenov & Jones, 2001). | ||||||||||||
2.1 0206+35 (4C 35.03)
0206+35 is an extended Fanaroff-Riley Class I (FR I; Fanaroff & Riley 1974) radio source whose optical counterpart, UGC1 1651, is a D-galaxy, a member of a dumb-bell system at the centre of a group of galaxies. At a resolution of 1.2 arcsec the radio emission shows a core, with smooth two-sided jets aligned in the NW-SE direction and surrounded by a diffuse and symmetric halo. Laing & Bridle (2011b) have estimated that the jets are inclined by 40∘ with respect to the line of sight, with the main (approaching) jet in the NW direction.
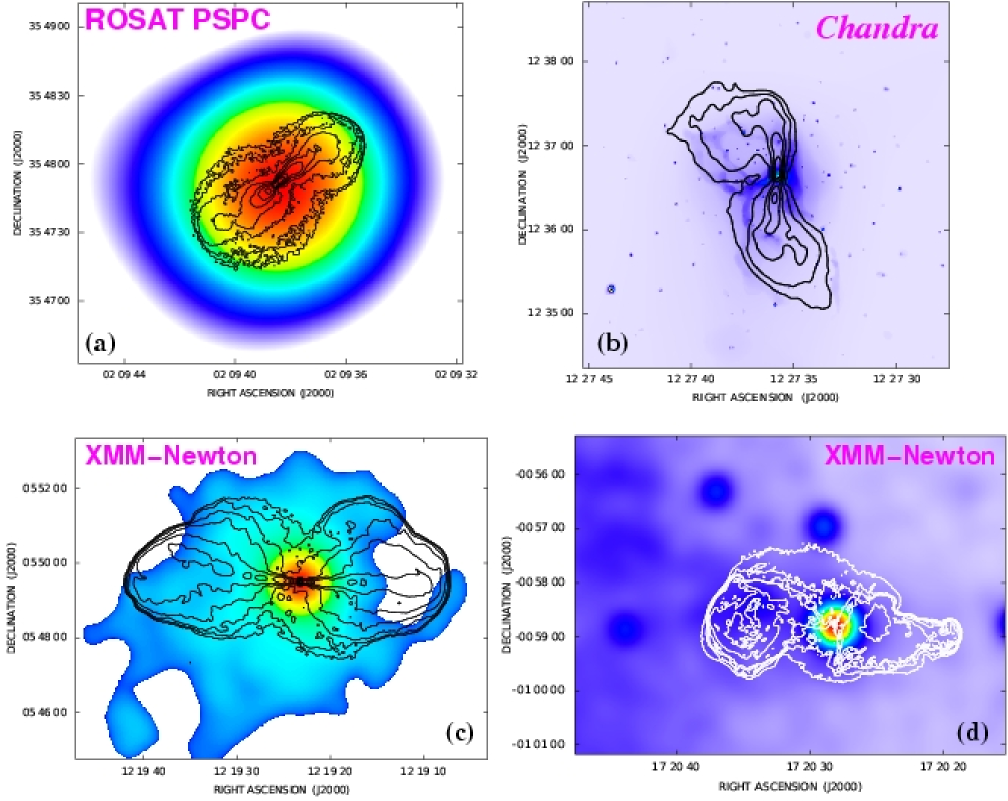
0206+35 has been observed with both the ROSAT PSPC and HRI instruments (Worrall & Birkinshaw, 1994, 2000; Trussoni et al., 1997) and with Chandra (Worrall, Birkinshaw & Hardcastle, 2001). The X-ray emission consists of a compact source surrounded by a galactic atmosphere which merges into the much more extended intra-group gas. The radius of the extended halo observed by the ROSAT PSPC is 2.5 arcmin (Fig. 1a). The ROSAT and Chandra X-ray surface brightness profiles are well fit by the combination of models with two different core radii and a power-law component (Hardcastle, private communication; Table 2).
2.2 3C 270
3C 270 is a radio source classified as FR I in most of the literature, although in fact, the two lobes have different FR classifications at low resolution (Laing, Guidetti & Bridle, 2011). The optical counterpart is the giant elliptical galaxy NGC 4261, located at the centre of a nearby group. The radio source has a symmetrical structure with a bright core and twin jets, extending E-W and completely surrounded by lobes. The low jet/counter-jet ratio indicates that the jets are close to the plane of the sky, with the Western side approaching (Laing, Guidetti & Bridle, 2011).
The XMM-Newton image (Fig. 1c) shows a disturbed distribution with regions of low surface-brightness (cavities) at the positions of both radio lobes. A recent Chandra observation (Worrall et al., 2010) shows “wedges” of low X-ray surface brightness surrounding the inner jets (see also Croston, Hardcastle & Birkinshaw 2005, Finoguenov et al. 2006, Jetha et al. 2007, Croston et al. 2008). The overall surface brightness profile is accurately reproduced by a point source convolved with the Chandra point spread function plus a double model (Croston et al., 2008, projb model). Croston et al. 2008 found no evidence for a temperature gradient in the hot gas. The group is characterized by high temperature and low luminosity (Finoguenov et al., 2006), which taken together provide a very high level of entropy. This might be a further sign of a large degree of impact of the AGN on the environment.
2.3 3C 353
3C 353 is an extended FR II radio source identified with a D-galaxy embedded at the periphery of a cluster of galaxies. The best estimate for the inclination of the jets is 90∘ (Swain, Bridle & Baum, 1998). The eastern jet is slightly brighter and ends in a well-defined hot spot. The radio lobes have markedly different morphologies: the eastern lobe is round with sharp edges, while the western lobe is elongated with an irregular shape. The location of the source within the cluster is of particular interest for this work and might account for the different shapes of the lobes. Fig. 1(d) shows the XMM-Newton image overlaid on the radio contours. The image shows only the NW part of the cluster, but it is clear that the radio source lies on the edge of the X-ray emitting gas distribution. so that the round eastern lobe is encountering a higher external density and is probably also behind a larger column of Faraday-rotating material (Iwasawa et al. 2000, Goodger et al. 2008). In particular, the image published by Goodger et al. (2008) shows that the gas density gradient persists on larger scales.
2.4 M 84
M 84 is a giant elliptical galaxy located in the Virgo Cluster at about 400 kpc from the core. Optical emission-line imaging shows a disk of ionized gas around the nucleus, with a maximum detected extent of arcsec2 (Hansen, Norgaard-Nielsen & Jorgensen, 1985; Baum et al., 1988; Bower et al., 1997, 2000). The radio emission of M 84 (3C 272.1) has an angular extension of about 3 arcmin ( 11 kpc) and shows an unresolved core in the nucleus of the galaxy, two resolved jets and a pair of wide lobes (Laing & Bridle, 1987; Laing et al., 2011). The inclination to the line-of-sight of the inner jet axis is 60∘ , with the northern jet approaching, but there is a noticeable bend in the counter-jet very close to the nucleus, which complicates modelling (Laing & Bridle, 2011b). After this bend, the jets remain straight for 40 arcsec, then both of them bend eastwards by 90∘ and fade into the radio emission of the lobes.
The morphology of the X-ray emission has a H-shape made up of shells of compressed gas surrounding cavities coincident with both the radio lobes (Finoguenov et al., 2008, 2006; Finoguenov & Jones, 2001). This shape, together with the fact that the initial bending of the radio jets has the same direction and is quite symmetrical, suggests a combination of interaction with the radio plasma and motion of the galaxy within the cluster (Finoguenov & Jones, 2001). The ratio between the X-ray surface brightness of the shells of the compressed gas and their surroundings is 3 and is almost constant around the source. The shells are regions of enhanced pressure and density and low entropy: the amplitude of the density enhancements (a factor of 3) suggests that they are produced by weak shock waves (Mach number ) driven by the expanding lobes (Finoguenov et al., 2006).
3 Analysis of RM and depolarization images
For a fully-resolved foreground Faraday screen, the relation of Eq. 2 holds exactly and there is no change of degree of polarization, , with wavelength. Even in the presence of a small gradient of RM across the beam, rotation is observed over a wide range of polarization angle. In this case, the emission tends to depolarize with increasing wavelength, following the Burn law (Burn, 1966):
| (3) |
where is the intrinsic value of the degree of polarization and
=2, with (Burn, 1966; Tribble, 1991; Laing et al., 2008).
Since , Eq. 3
clearly illustrates that higher RM gradients across the beam generate higher
values and in turn higher depolarization.
Our observational analysis is based on the following procedure. We first produced RM and Burn law images at two different angular resolutions for each source and searched for regions with high or correlated RM and values, which could indicate the presence of internal Faraday rotation and/or strong RM gradients across the beam. In regions with low where the variations of RM are plausibly isotropic and random, we then used the structure function (defined in Eq. 4) to derive the power spectrum of the RM fluctuations. Finally, to investigate the depolarization in the areas of isotropic RM, and hence the magnetic field power on small scales, we made numerical simulations of the Burn law using the model power spectrum with different minimum scales and compared the results with the data.
The structure function is defined by
| (4) |
(Simonetti, Cordes & Spangler 1984; Minter & Spangler 1996) where and are vectors in the plane of the sky and is an average over .
We assume RM power spectra of the form:
where is a scalar spatial frequency and fit the observed structure function (including the effect of the observing beam) using the Hankel-transform method described by Laing et al. (2008) to derive the amplitude, and the slope, . To constrain the RM structure on scales smaller than the beamwidth, we estimated the minimum scale of the best fitted field power spectrum, , which predicts a mean value of consistent with the observed one.
In this paper, we are primarily interested in estimating the RM power spectrum over limited areas, and we made no attempt to determine the outer scale of fluctuations.
The use of the structure function together with the Burn law represents a powerful technique to investigate the RM power spectrum over a wide range of spatial scales (Laing et al., 2008; Guidetti et al., 2010). The two quantities are complementary, in that the structure function allows us to determine the power spectrum of the fluctuations on scales larger than the beamwidth, while the Burn law constrains fluctuations of RM below the resolution limit.
4 Rotation measure images
| source | beam | ||
|---|---|---|---|
| [MHz] | [MHz] | [arcsec] | |
| 0206+35 | 1385.1 | 25 | 1.2 |
| 1464.9 | 25 | ||
| 4885.1 | 50 | ||
| 3C 353 | 1385.0 | 12.5 | 1.3 |
| 1665.0 | 12.5 | ||
| 4866.3 | 12.5 | ||
| 8439.9 | 12.5 | ||
| 3C 270 | 1365.0 | 25 | 1.65 |
| 1412.0 | 12.5 | ||
| 4860.1 | 100 | ||
| 1365.0 | 25 | 5.0 | |
| 1412.0 | 12.5 | ||
| 1646.0 | 25 | ||
| 4860.1 | 100 | ||
| M 84 | 1413.0 | 25 | 1.65 |
| 4885.1 | 50 | ||
| 1385.1 | 50 | 4.5 | |
| 1413.0 | 25 | ||
| 1464.9 | 50 | ||
| 4885.1 | 50 |
The RM images and associated rms errors were produced by weighted least-squares fitting to the observed polarization angles as a function of (Eq. 1) at three or four frequencies (Table 3, see also Laing et al. 2011 and Laing, Guidetti & Bridle 2011) using the RM task in the AIPS package.
Each RM map was calculated only at pixels with rms polarization-angle uncertainties 10∘ at all frequencies. We refer only to the lower-resolution RM and images for 3C 270 and M 84 (Table 3), as they show more of the faint, extended regions of these sources and are fully consistent with the higher-resolution versions. The RM image of M 84 is consistent with that shown by Laing & Bridle (1987), but is derived from four-frequency data and has a higher signal-to-noise ratio.
In the fainter regions of 0206+35 (for which only three frequencies are available and the signal-to-noise ratio is relatively low), the RM task occasionally failed to determine the n ambiguities in position angle correctly. In order to remove these anomalies, we first produced a lower-resolution, but high signal-to-noise RM image by convolving the 1.2 arcsec RM map to a beamwidth of 5 arcsec FWHM. From this map we derived the polarization-angle rotations at each of the three frequencies and subtracted them from the observed 1.2 arcsec polarization angle maps at the same frequency to derive the residuals at high resolution. Then, we fit the residuals without allowing any n ambiguities and added the resulting RM’s to the values determined at low resolution. This procedure allowed us to obtain an RM map of 0206+35 free of significant deviations from rotation and fully consistent with the 1.2-arcsec measurements.
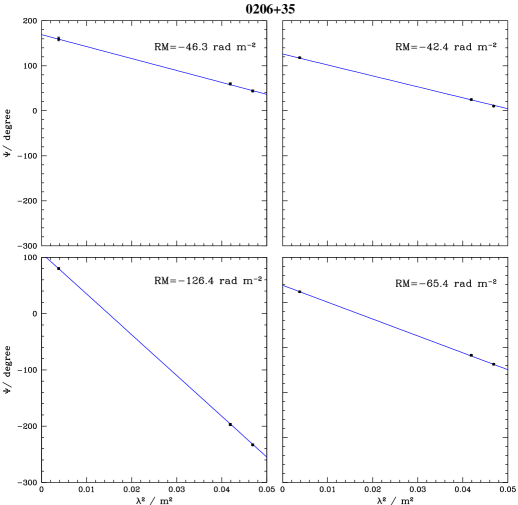
We have verified that the polarization angles accurately follow the relation over the full range of position angle essentially everywhere except for small areas around the optically-thick cores: representative plots of against for 0206+35 are shown in Fig. 4. The lack of deviations from rotation in all of the radio galaxies is fully consistent with our assumption that the Faraday rotating medium is mostly external to the sources.
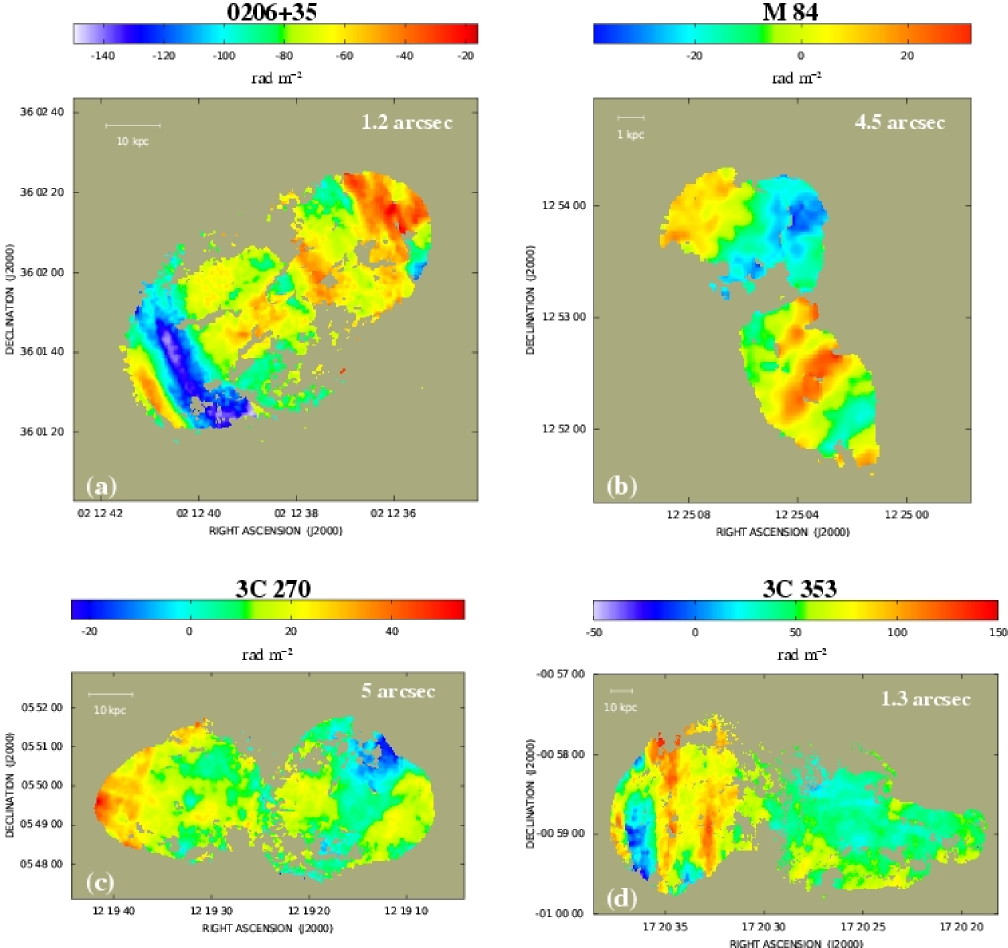
The RM maps are shown in Fig. 2. The typical rms error on the fit is 2 rad m-2. No correction for the Galactic contribution has been applied.
All of the RM maps show two-dimensional patterns, RM bands, across the lobes with characteristic widths ranging from 3 to 12 kpc. Multiple bands parallel to each other are observed in the western lobe of 0206+35, the eastern lobe of 3C 353 and the southern lobe of M 84.
In all cases, the iso-RM contours are straight and perpendicular to the major axes of the lobes to a very good approximation: the very straight and well-defined bands in the eastern lobes of both 0206+35 (Fig. 2a) and 3C 353 (Fig. 2d) are particularly striking. The entire area of M 84 appears to be covered by a banded structure, while in the central parts of 0206+35 and 3C 270 and the western lobe of 3C 353, regions of isotropic and random RM fluctuations are also present.
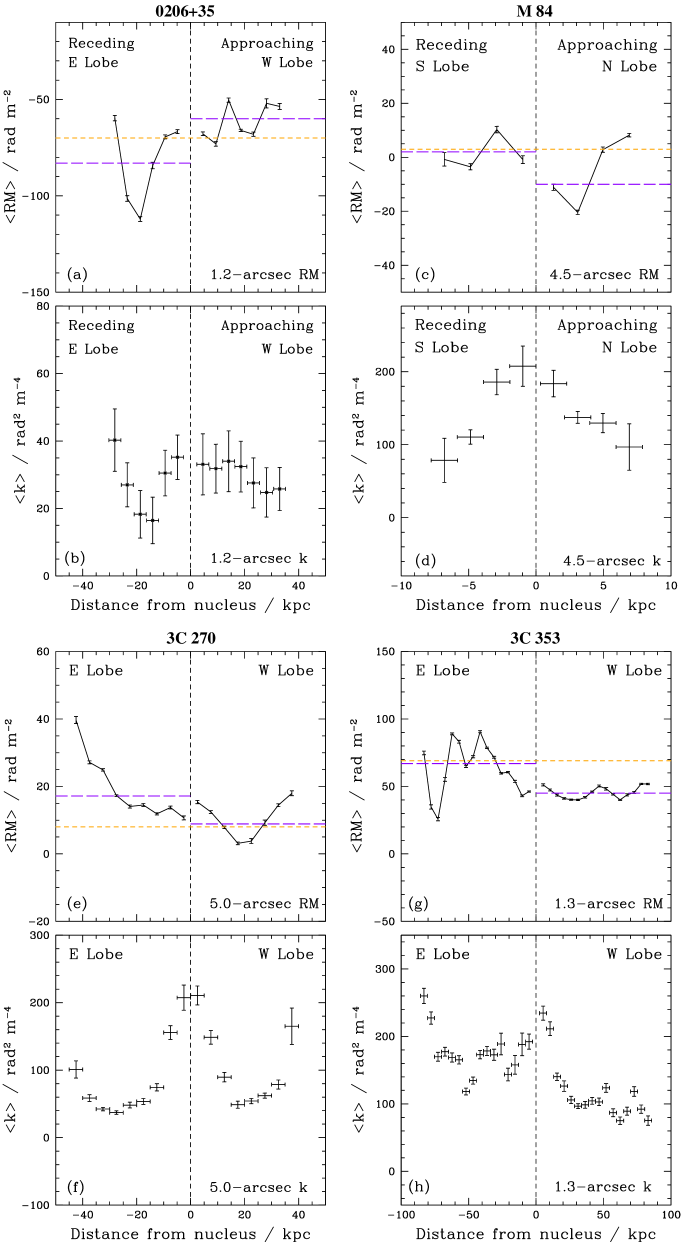
We also derived profiles of along the radio axis of each source, averaging over boxes a few beamwidths long (parallel to the axes), but extended perpendicular to them to cover the entire width of the source. The boxes are all large enough to contain many independent points. The profiles are shown in Fig. 5. For each radio galaxy, we also plot an estimate of the Galactic contribution to the RM derived from a weighted mean of the integrated RM’s for non-cluster radio sources within a surrounding area of 10 deg2 (Simard-Normandin et al., 1981). In all cases, both positive and negative fluctuations with respect to the Galactic value are present.
In 0206+35 (Fig. 2a), the largest-amplitude bands are in the outer parts of the lobes, with a possible low-level band just to the NW of the core. The most prominent band (with the most negative RM values) is in the eastern (receding) lobe, about 15 kpc from the core (Fig. 5a). Its amplitude with respect to the Galactic value is about 40 rad m-2. This band must be associated with a strong ordered magnetic field component along the line of sight. If corrected for the Galactic contribution, the two adjacent bands in the eastern lobe would have RM with opposite signs and the field component along the line of sight must therefore reverse.
M 84 (Fig. 2b) displays an ordered RM pattern across the whole source, with two wide bands of opposite sign having the highest absolute RM values. There is also an abrupt change of sign across the radio core (see also Laing & Bridle 1987). The negative band in the northern lobe (associated with the approaching jet) has a larger amplitude with respect to the Galactic value than the corresponding (positive) feature in the southern lobe (Fig. 5c).
3C 270 (Fig. 2c) shows two large bands: one on the front end of the eastern lobe, the other in the middle of the western lobe. The bands have opposite signs and contain the extreme positive and negative values of the observed RM. The peak positive value is within the eastern band at the extreme end of the lobe (Fig. 5e).
The RM structure of 3C 353 (Fig. 2d) is highly asymmetric. The eastern lobe shows a strong pattern, made up of four bands, with very straight iso-RM contours which are almost exactly perpendicular to the source axis. As in 0206+35, adjacent bands have RM with opposite signs once corrected for the Galactic contribution (Fig. 5g). In contrast, the RM distribution in the western lobe shows no sign of any banded structure, and is consistent with random fluctuations superimposed on an almost linear profile. It seems very likely that the differences in RM morphology and axial ratio are both related to the external density gradient (Fig. 1d).
| source | band | width | |||||
|---|---|---|---|---|---|---|---|
| [rad m-2] | [rad m-2] | [kpc] | [kpc] | [rad m-2] | |||
| 0206+35 (4C 35.03) | 77 | 23 | |||||
| 140 | -15 | 10 | 40 | ||||
| 60 | -27 | 4 | |||||
| 34 | 22 | 6 | |||||
| 51 | 8 | 4 | |||||
| 3C 353 | 56 | 24 | |||||
| 122 | -12 | 5 | 50 | ||||
| 102 | -19 | 4 | |||||
| -40 | -23 | 4 | |||||
| 100 | -26 | 4 | |||||
| 3C 270 | 14 | 10 | 12 | ||||
| 8 | 20 | 12 | 10 | ||||
| 32 | 37 | 11 | |||||
| M 84 | 2 | 15 | 2 | ||||
| 27 | 1 | 3 | 10 | ||||
| 22 | -6 | 6 |
In Table 4 the relevant geometrical features (size, distance from the radio core, ) for the RM bands are listed.
5 Depolarization
In this section, we use “depolarization” in its conventional sense to mean “decrease of degree of polarization with increasing wavelength” and define DP = . Using the Faraday code (Murgia et al., 2004), we produced images of Burn law by weighted least-squares fitting to as a function of (Eq. 3). Only data with signal-to-noise ratio 4 in at each frequency were included in the fits. The Burn law images were produced with the same angular resolutions as the RM images. The 1.65 arcsec resolution Burn law maps for M 84 and 3C 270 are consistent with the low-resolution ones, but add no additional detail and are quite noisy. This could lead to significantly biased estimates for the mean values of over large areas (Laing et al., 2008). Therefore, as for the RM maps, we used only the Burn law images at low resolution for these two sources.
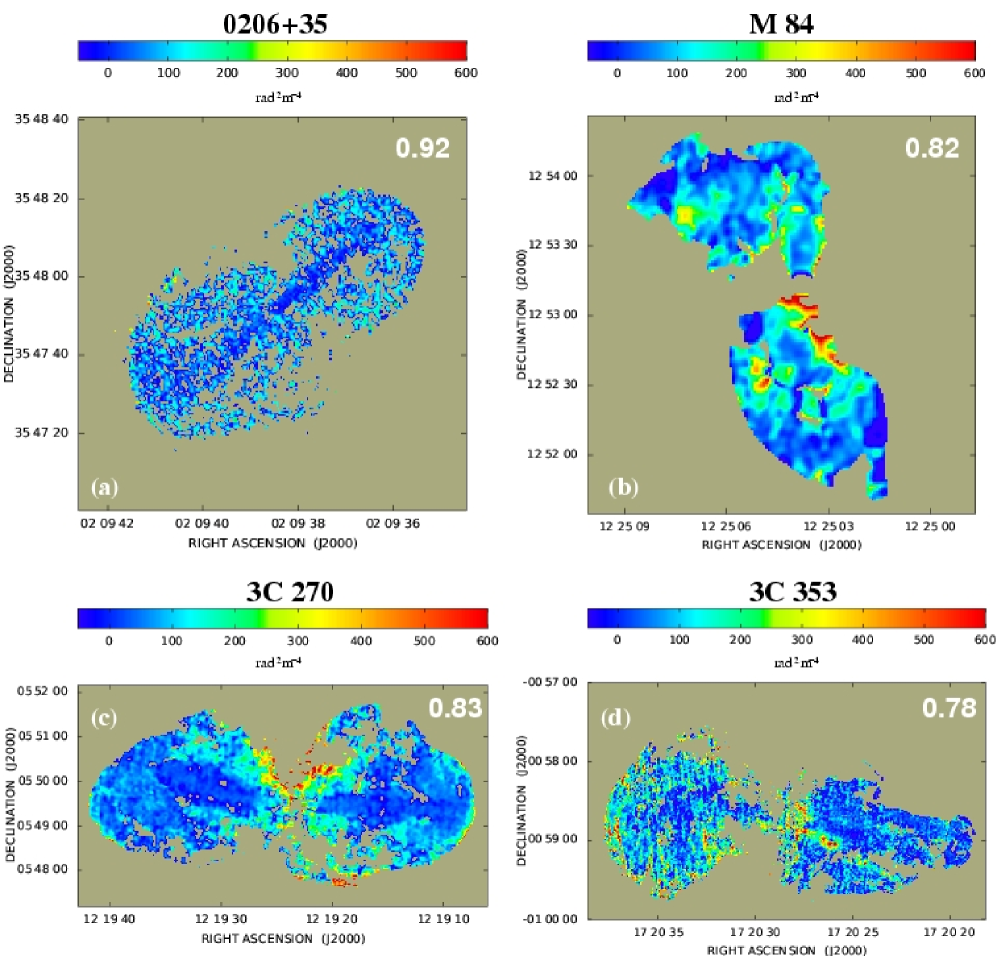
The Burn law maps are shown in Fig. 3. All of the sources show low average values of (i.e. slight depolarization), suggesting little RM power on small scales. With the possible exception of the narrow filaments of high in the eastern lobe of 3C 353 (which might result from partially resolved RM gradients at the band edges), none of the images show any obvious structure related to the RM bands. For each source, we have also compared the RM and Burn law values derived by averaging over many small boxes covering the emission, and we find no correlation between them.
We also derived profiles of (Fig. 5b, d, f and h) with the same sets of boxes as for the RM profiles in the same Figure. These confirm that the values of measured in the centres of the RM bands are always low, but that there is little evidence for any detailed correlation.
The signal-to-noise ratio for 0206+35 is relatively low compared with that of the other three sources, particularly at 4.9 GHz (we need to use a small beam to resolve the bands), and this is reflected in the high proportion of blanked pixels on the image. The most obvious feature of this image (Fig. 3a), an apparent difference in mean between the high-brightness jets (less depolarized) and the surrounding emission, is likely to be an artefact caused by our blanking strategy: points where the polarized signal is low at 4.9 GHz are blanked preferentially, so the remainder show artificially high polarization at this frequency. For the same reason, the apparent minimum in at the centre of the deep, negative RM band (Fig. 5a and b) is probably not significant. The averaged values of for 0206+35 are already very low, however, and are likely to be slightly overestimated, so residual RM fluctuations on scales below the 1.2-arcsec beamwidth must be very small.
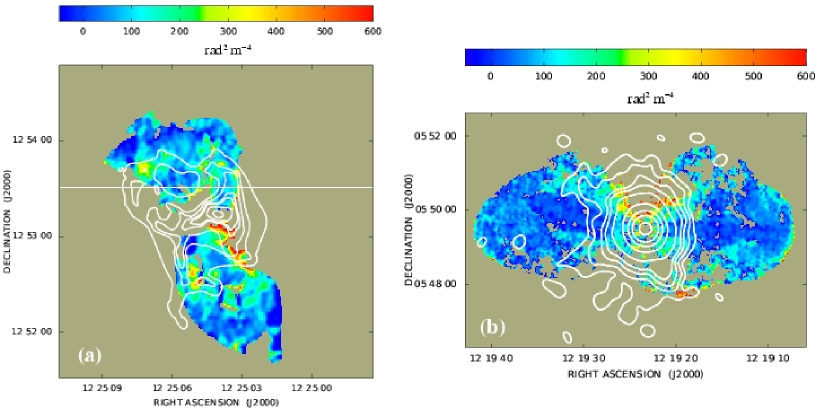
M 84 shows one localised area of very strong depolarization (500 rad2 m-4, corresponding to DP = 0.38) at the base of the southern jet (Fig. 3b). There is no corresponding feature in the RM image (Fig. 2b). The depolarization is likely to be associated with one of the shells of compressed gas visible in the Chandra image (Fig. 1b), implying significant magnetization with inhomogeneous field and/or density structure on scales much smaller than the beamwidth, apparently independent of the larger-scale field responsible for the RM bands. This picture is supported by the good spatial coincidence of the high region with a shell of compressed gas, as illustrated in the overlay of the 4.5 arcsec Burn law image on the contours of the Chandra data (Fig. 6(a)). Cooler gas associated with the emission-line disk might also be responsible, but there is no evidence for spatial coincidence between enhanced depolarization and H emission (Hansen, Norgaard-Nielsen & Jorgensen, 1985). Despite the complex morphology of the X-ray emission around M 84, its profile is very symmetrical, with the highest values at the centre (Fig. 5(d)).
3C 270 also shows areas of very strong depolarization (550 rad2 m-4, corresponding to DP = 0.35) close to the core and surrounding the inner and northern parts of both the radio lobes. As for M 84, the areas of high are coincident with ridges in the X-ray emission which form the boundaries of the cavity surrounding the lobes (Fig. 6(b)). The inner parts of this X-ray structure are described in more detail by Worrall et al. (2010), whose recent high-resolution Chandra image clearly reveals “wedges” of low brightness surrounding the radio jets. As in M 84, the most likely explanation is that a shell of denser gas immediately surrounding the radio lobes is magnetized, with significant fluctuations of field strength and density on scales smaller than our 5-arcsec beam, uncorrelated with the RM bands. The profile of 3C 270 (Fig. 5(f)) is very symmetrical, suggesting that the magnetic-field and density distributions are also symmetrical and consistent with an orientation close to the plane of the sky. The largest values of are observed in the centre, coincident with the features noted earlier and with the bulk of the X-ray emission (the high values in the two outermost bins have low signal-to-noise and are not significant).
In the Burn law image of 3C 353, there is evidence for a straight and knotty region of high depolarization 20 kpc long and extending westwards from the core. This region does not appear to be related either to the jets or to any other radio feature. As in M 84 and 3C 270, the RM appears quite smooth over the area showing high depolarization, again suggesting that there are two scales of structure, one much smaller than the beam, but producing zero mean RM and the other very well resolved. In 3C 353, there is as yet no evidence for hot or cool ionized gas associated with the enhanced depolarization (contamination from the very bright nuclear X-ray emission affects an area of 1 arcmin radius around the core; Iwasawa et al. 2000, Goodger et al. 2008).
The profile of 3C 353 (Fig. 5(h)) shows a marked asymmetry, with much higher values in the East. This is in the same sense as the difference of RM fluctuation amplitudes (Fig. 5(g)) and is also consistent with the eastern lobe being embedded in higher-density gas. The relatively high values of within 20 kpc of the nucleus in the Western lobe are due primarily to the discrete region identified earlier.
6 Rotation measure structure functions
We calculated RM structure function for discrete regions of the sources where the RM fluctuations appear to be isotropic and random and for which we expect the spatial variations of foreground thermal gas density, rms magnetic field strength and path length to be reasonably small. These are: the inner 26 arcsec of the receding (Eastern) lobe of 0206+35, the inner 100 arcsec of 3C 270 and the inner 40 arcsec of the western lobe of 3C 353. The selected areas of 0206+35 and 3C 270 are both within the core radii of the larger-scale beta models that describe the group-scale X-ray emission and the galaxy-scale components are too small to affect the RM statistics significantly (Table 2). In 3C 353, the selected area was chosen to be small compared with the scale of X-ray variations seen in Fig. 1(d). In all three cases, the foreground fluctuations should be fairly homogeneous. There are no suitable regions in M 84, which is entirely covered by the banded RM pattern.
The structure functions, corrected for uncorrelated random noise by subtracting 2 (Simonetti et al., 1984), are shown in Fig. 7. All of the observed structure functions correspond to power spectra of approximately power-law form over all or most of the range of spatial frequencies we sample. We initially assumed that the power spectrum was described by Eq.3 with no high-frequency cut-off () and made least-squares fits to the structure functions, weighted by errors derived from multiple realizations of the power spectrum on the observing grid, as described in detail by Laing et al. (2008) and Guidetti et al. (2010).
The best-fitting slopes and amplitudes are given in Table 5. All of the fitted power spectra are quite flat and have low amplitudes, implying that there is little power in the isotropic and random component of rotation measure. Indeed, the amplitudes of the largest-scale RM fluctuations sampled in this analysis is a few times less than that of the bands (see Tables 4 and 5). This suggests that the field responsible for the bands is stronger as well as more ordered than that responsible for the isotropic fluctuations.
| Source | FWHM | ||||||
|---|---|---|---|---|---|---|---|
| [arcsec] | [kpc] | [rad m-2] | [rad2 m-4] | [rad2 m-4] | |||
| 0206+35 | 1.2 | 2.1 | 0.77 | 2 | 10 | 37 | 40 |
| 3C 270 | 1.65 | 2.7 | 0.90 | 0.3 | 5 | 30 | 26 |
| 5.0 | 2.7 | 0.90 | 0.3 | 5 | 71 | 64 | |
| 3C 353 | 1.3 | 3.1 | 0.99 | 0.1 | 10 | 38 | 33 |
| M 84 | 1.65 | 0.1 | 25 | ||||
| 4.5 | 0.1 | 43 |
The structure functions for 0206+35 and 3C 353 rise monotonically, indicating that the outer scale for the random fluctuations must be larger than the maximum separations we sample. For 3C 270, the structure function levels out at 100 arcsec (15 kpc; Fig. 7d). This could be the outer scale of the field fluctuations, but a better understanding of the geometry and external density distribution would be needed before we could rule out the effects of large-scale variations in path length or field strength (cf. Guidetti et al. 2010).
In order to constrain RM structure on spatial scales below the beamwidth, we estimated the depolarization as described in Section 3. The fitted values are listed in Table 5. We stress that these values refer only to areas with isotropic fluctuations, and cannot usefully be compared with the integrated depolarizations quoted in in Fig. 2.
For M 84, using the Burn law analysis and assuming that variation of Faraday rotation across the 1.65-arcsec beam causes the residual depolarization, we find that kpc for any reasonable RM power spectrum.

7 Rotation-measure bands from compression
It is clear from the fact that the observed RM bands are perpendicular to the lobe axes that they must be associated with an interaction between an expanding radio source and the gas immediately surrounding it. One inevitable mechanism is enhancement of field and density by the shock or compression wave surrounding the source.222An alternative mechanism is the generation of non-linear surface waves (Bicknell, Cameron & Gingold, 1990). It is unlikely that this can produce large-scale bands, for the reasons given in Section 9.5. The implication of the presence of cavities in the X-ray gas distribution coincident with the radio lobes is that the sources are interacting strongly with the thermal gas, displacing rather than mixing with it (see McNamara & Nulsen 2007 for a review). For the sources in the present paper, the X-ray observations of M 84 (Finoguenov et al., 2008, Fig.1b) and 3C 270 (Croston et al., 2008, Fig.1c) show cavities and arcs of enhanced brightness, corresponding to shells of compressed gas bounded by weak shocks. The strength of any pre-existing field in the IGM, which will be frozen into the gas, will also be enhanced in the shells. We therefore expect a significant enhancement in RM. A more extreme example of this effect will occur if the expansion of the radio source is highly supersonic, in which case there will be a strong bow-shock ahead of the lobe, behind which both the density and the field become much higher. Regardless of the strength of the shock, the field is modified so that only the component in the plane of the shock is amplified and the post-shock field tends become ordered parallel to the shock surface.
The evidence so far suggests that shocks around radio sources of both FR classes are generally weak (e.g. Forman et al. 2005, Wilson et al. 2006, Nulsen et al. 2005). There are only two examples in which highly supersonic expansion has been inferred: the southern lobe of Centaurus A (; Kraft et al. 2003) and NGC 3801 (; Croston et al. 2007). There is no evidence that the sources described in the present paper are significantly overpressured compared with the surrounding IGM (indeed, the synchrotron minimum pressure is systematically lower than the thermal pressure of the IGM; Table 2). The sideways expansion of the lobes is therefore unlikely to be highly supersonic. The shock Mach number estimated for all the sources from ram pressure balance in the forward direction is also 1.3. This estimate is consistent with that for M 84 made by Finoguenov et al. (2006) and also with the lack of detection of strong shocks in the X-ray data for the other sources.
In this section, we investigate how the RM could be affected by compression. We consider a deliberately oversimplified picture in which the radio source expands into an IGM with an initially uniform magnetic field, . This is the most favourable situation for the generation of large-scale, anisotropic RM structures: in reality, the pre-existing field is likely to be highly disordered, or even isotropic, because of turbulence in the thermal gas. We stress that we have not tried to generate a self-consistent model for the magnetic field and thermal density, but rather to illustrate the generic effects of compression on the RM structure.
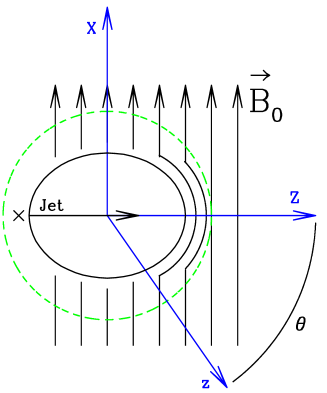
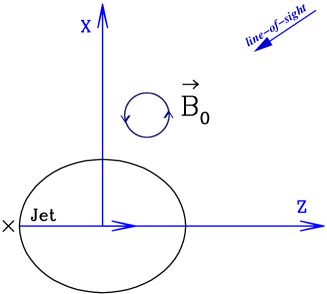
In this model the radio lobe is an ellipsoid with its major axis along the jet and is surrounded by a spherical shell of compressed material. This shell is centred at the mid-point of the lobe (Fig. 8) and has a stand-off distance equal to 1/3 of the lobe semi-major axis at the leading edge (the radius of the spherical compression is therefore equal to 4/3 of the lobe semi-major axis). In the compressed region, the thermal density and the magnetic field component in the plane of the spherical compression are amplified by the same factor, because of flux-freezing. We use a coordinate system centred at the lobe mid-point, with the -axis along the line of sight, so and are in the plane of the sky. The radial unit vector is =. = and = are respectively the pre- and post-shock magnetic-field vectors. Then, we consider a coordinate system still centred at the lobe mid-point, but rotated with respect to the system by the angle about the () axis, so that is aligned with the major axis of the lobe. With this choice, is the inclination of the source with respect to the line-of-sight (Fig. 8).
After a spherical compression, the thermal density and field satisfy the equations:
| (5) |
where , and represent the initial thermal density and the components of the field perpendicular and parallel to the compression surface. The same symbols with primes stand for post-shock quantities and is the compression factor. The total compressed magnetic field is:
| (6) |
The field strength after compression depends on the the angle between the compression surface and the initial field. Maximum amplification occurs for a field which is parallel to the surface, whereas a perpendicular field remains unchanged. The post-shock field component along the line-of-sight becomes:
| (7) |
We assumed that the compression factor, , is a function of distance along the source axis from the centre of the radio lobe, decreasing monotonically from a maximum value at the leading edge to a constant value from the centre of the lobe as far as the core. We investigated values of in the range 1.5 – 4 ( corresponds to the asymptotic value for a strong shock). Given that there is no evidence for strong shocks in the X-ray data for any of our sources, we have typically assumed that the compression factor is at the front end of the lobe, decreasing to 1.2 at the lobe mid-point and thereafter remaining constant as far as the core. A maximum compression factor of 3 is consistent with the transonic Mach numbers estimated from ram-pressure balance for all of the sources and this choice is also motivated by the X-ray data of M 84, from which there is evidence for a compression ratio between the shells and their surroundings (Section 2.4).
We produced synthetic RM images for different combinations of source inclination and direction of the pre-existing uniform field, by integrating the expression
| (8) |
numerically. We assumed a constant value of cm-3 for the density of the pre-shock material (the central value for the group gas associated with 0206+35; Table 2), a lobe semi-major axis of 21 kpc (also appropriate for 0206+35) and an initial field strength of 1 G. The integration limits were defined by the surface of the radio lobe and the compression surface. This is equivalent to assuming that there is no thermal gas within the radio lobe, consistent with the picture suggested by our inference of foreground Faraday rotation and the existence of X-ray cavities and that Faraday rotation from uncompressed gas is negligible.
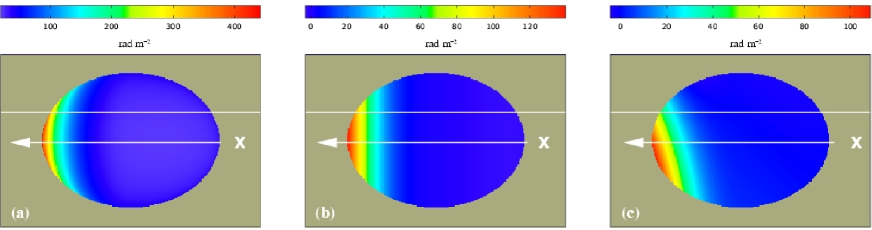
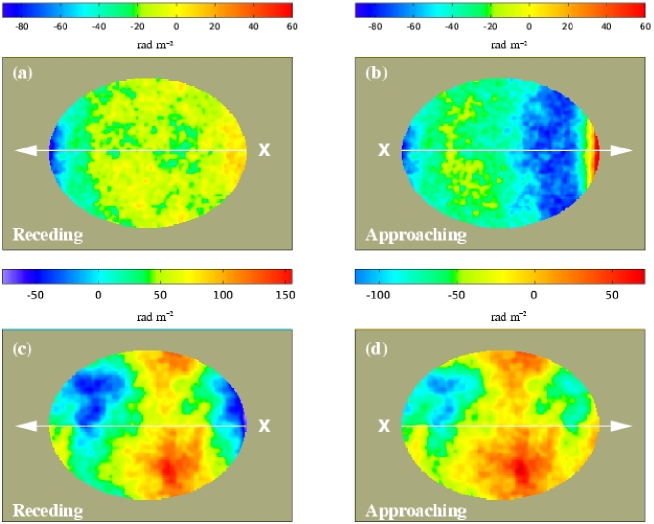
As an example, Fig. 9 shows the effects of compression on the RM for the receding lobe of a source inclined by 40∘ to the line of sight. The initial field is pointing towards us with an inclination of 60∘ with respect to the line-of-sight; its projection on the plane of the sky makes an angle of 30∘ with the -axis. Fig. 9(a) displays the RM produced without compression ( everywhere): the RM structures are due only to differences in path length across the lobe. Fig. 9(b) shows the consequence of adding a modest compression of : structures similar to bands are generated at the front end of the lobe and the range of the RM values is increased. Fig. 9(c) illustrates the RM produced in case of the strongest possible compression, : the RM structure is essentially the same as in Fig. 9(b), with a much larger range.
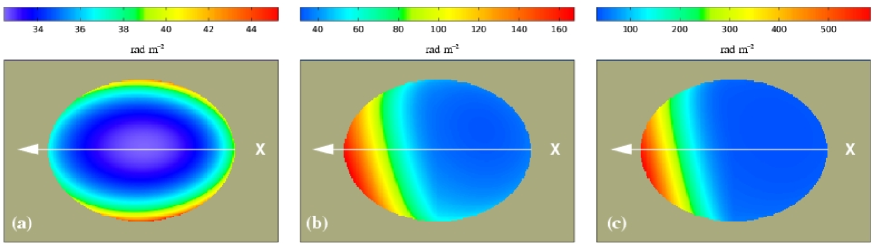
This very simple example shows that RM bands with amplitudes consistent with those observed can plausibly be produced even by weak shocks in the IGM, but the iso-RM contours are neither straight, nor orthogonal to the lobe axis and there are no reversals. These constraints require specific initial conditions, as illustrated in Fig. 10, where we show the RM for a lobe in the plane of the sky. We considered three initial field configurations: along the line-of-sight (Fig. 10a), in the plane of the sky and parallel to the lobe axis (Fig. 10b) and in the plane of the sky, but inclined by 45∘ to the lobe axis (Fig. 10c). The case closest to reproducing the observations is that displayed in Fig. 10(b), in which reversals and well defined and straight bands perpendicular to the jet axis are produced for both of the lobes. In Fig. 10(a), the structures are curved, while in Fig. 10(c) the bands are perpendicular to the initial field direction, and therefore inclined with respect to the lobe axis.
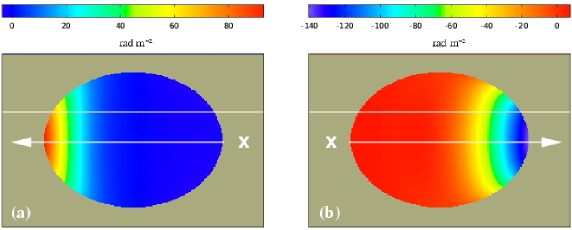
For a source inclined by 40∘ to the line of sight, we found structures similar to the observed bands only with an initial field in the plane of the sky and parallel to the axis in projection (Figs 11a and b; note that the synthetic RM images in this example have been made for each lobe separately, neglecting superposition).
We can summarize the results of the spherical pure compression model as follows.
-
1.
An initial field with a component along the line-of-sight does not generate straight bands.
-
2.
The bands are orthogonal to the direction of the initial field projected on the plane of the sky, so bands perpendicular to the lobe axis are only obtained with an initial field aligned with the radio jet in projection.
-
3.
The path length (determined by the precise shape of the radio lobes) has a second-order effect on the RM distribution (compare Figs. 9a and b).
Thus, a simple compression model can generate bands with amplitudes similar to those observed but reproducing their geometry requires implausibly special initial conditions, as we discuss in the next section.
8 Rotation-measure bands from a draped magnetic field
8.1 General considerations
That the pre-existing field is uniform, close to the plane of the sky and aligned with the source axis in projection is implausible for obvious reasons:
-
1.
the pre-existing field cannot know anything about either the radio-source geometry or our line-of-sight and
-
2.
observations of Faraday rotation in other sources and the theoretical inference of turbulence in the IGM both require disordered initial fields.
This suggests that the magnetic field must be aligned by rather than with the expansion of the radio source. Indeed, the field configurations which generate straight bands look qualitatively like the “draping” model proposed by Dursi & Pfrommer (2008), for some angles to the line-of-sight. The analysis of Sections 2, 5 and 6 suggests that the magnetic fields causing the RM bands are well-ordered, consistent with a stretching of the initial field that has erased much of the small-scale structure while amplifying the large-scale component. We next attempt to constrain the geometry of the resulting “draped” field.
8.2 Axisymmetric draped magnetic fields
A proper calculation of the RM from a draped magnetic-field configuration (Dursi & Pfrommer, 2008) is outside
the scope of this paper, but we can start to understand the field geometry using
some simple approximations in which the field
lines are stretched along the source axis. We assumed initially that the field
around the lobe is axisymmetric, with components along and radially outwards
from the source axis, so that the RM pattern is independent of rotation about
the axis.
It is important to stress that such an axisymmetric field is not physical, as it requires a monopole and unnatural reversals,
it is nevertheless a useful benchmark for features of the field
geometry that are needed to account for the observed RM
structure.
We first considered field lines which are parabolae with a common
vertex on the axis ahead of the lobe.
For field strength and density both decreasing
away from the vertex, we found that RM structures,
with iso-contours similar to arcs, rather than bands, were generated
only for the approaching lobe of an inclined source.
Such anisotropic RM structures were not produced
in the receding lobes, nor for sources
in the plane of the sky. Indeed,
in order to generate any narrow,
transverse RM structures such as arcs or bands,
the line-of-sight must pass through a foreground region in which the
field lines show significant curvature, which occurs
only for an approaching lobe in case of a parabolic field geometry.
This suggested that we should consider field lines which are families of
ellipses centred on the lobe, again with field strength and density decreasing
away from the leading edge. This indeed produced RM structures in both lobes
for any inclination, but the iso-RM contours were arcs, not straight lines.
Because of the non-physical nature of these axisymmetric field models,
the resulting RM images are deliberately not shown in this paper.
In order to quantify the departures from straightness of the iso-RM
contours, we measured the ratio of the predicted RM values at the centre and edge of
the lobe at constant , at different distances along the source axis, , for both
of the example axisymmetric field models. The ratio, which is 1 for
perfectly straight bands, varies from 2 to 3 in both cases, depending on
distance from the nucleus. This happens because the variations in
line-of-sight field strength and density do not compensate accurately for
changes in path length. We believe that this problem is generic to any
axisymmetric field configuration.
The results of this section suggest that the field configuration required
to generate straight RM bands perpendicular to the projected lobe advance
direction has systematic curvature in the field lines (in order to produce
a modulation in RM) without a significant dependence on azimuthal angle
around the source axis). We therefore investigated a structure in which
elliptical field lines are wrapped around the front of the lobe, but in a
two-dimensional rather than a three-dimensional configuration.
8.3 A two-dimensional draped magnetic field
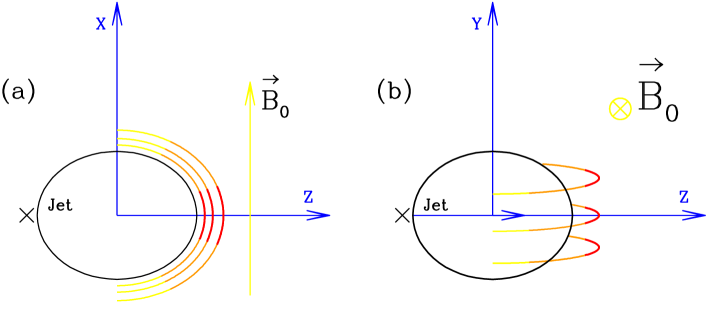
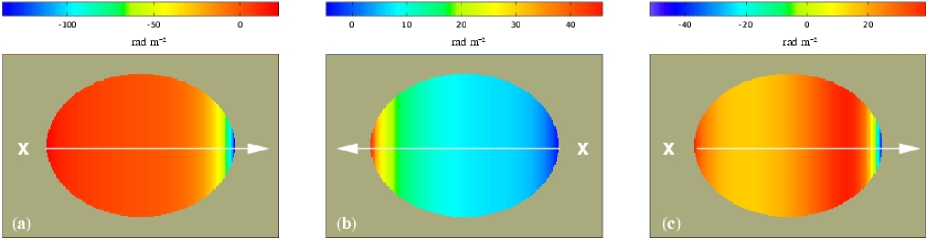
We considered a field with a two-dimensional geometry, in which the field lines are families of ellipses in planes of constant , as sketched in Fig. 12. The field structure is then independent of . The limits of integration are given by the lobe surface and an ellipse whose major axis is 4/3 of that of the lobe. Three example RM images are shown in Fig. 13. The assumed density ( cm-3) and magnetic field (1 G) were the same as the pre-shock values for the compression model of Section 7 and the lobe semi-major axis was again 21 kpc. Since the effect of path length is very small (Section 7), the RM is also independent of to a good approximation. The combination of elliptical field lines and invariance with allows us to produce straight RM bands perpendicular to the projected lobe axis for any source inclination. Furthermore, this model generates more significant reversals of the RM (e.g. Fig. 13c) than those obtainable with pure compression (e.g. Fig. 11b).
We conclude that a field model of this generic type represents the simplest way to produce RM bands with the observed characteristics in a way that does not require improbable initial conditions. The invariance of the field with the coordinate is an essential point of this model, suggesting that the physical process responsible for the draping and stretching of the field lines must act on scales larger than the radio lobes in the direction.
8.4 RM reversals
The two-dimensional draped field illustrated in the previous section reproduces the geometry of the observed RM bands very well, but can only generate a single reversal, which must be very close to the front end of the approaching lobe, where the elliptical field lines bend most rapidly. We observe a prominent reversal in the receding lobe of 0206+35 (Fig. 2a) and multiple reversals across the eastern lobe of 3C 353 and in M 84 (Fig. 2b and d). The simplest way to reproduce these is to assume that the draped field also has reversals, presumably originating from a more complex initial field in the IGM. One realization of such a field configuration would be in the form of multiple toroidal eddies with radii smaller than the lobe size, as sketched in Fig. 14. Whatever the precise field geometry, we stress that the straightness of the observed multiple bands again requires a two-dimensional structure, with little dependence on .
9 Discussion
9.1 Where do bands occur?
The majority of published RM images of radio galaxies do not show bands or other kind of anisotropic structure, but are characterized by isotropic and random RM distributions (e.g. Laing et al. 2008; Guidetti et al. 2010). On the other hand, we have presented observations of RM bands in four radio galaxies embedded in different environments and with a range of jet inclinations with respect to the line-of-sight. Our sources are not drawn from a complete sample, so any quantitative estimate of the incidence of bands is premature, but we can draw some preliminary conclusions.
The simple two-dimensional draped-field model developed in Section 8.3 only generates RM bands when the line-of-sight intercepts the volume containing elliptical field lines, which happens for a restricted range of rotation around the source axis. At other orientations, the RM from this field configuration will be small and the observed RM may well be dominated by material at larger distances which has not been affected by the radio source. We therefore expect a minority of sources with this type of field structure to show RM bands and the remainder to have weaker, and probably isotropic, RM fluctuations. In contrast, the three-dimensional draped field model proposed by Dursi & Pfrommer (2008) predicts RM bands parallel to the source axis for a significant range of viewing directions: these have not (yet) been observed.
The prominent RM bands described in the present paper occur only in lobed radio galaxies. In contrast, well-observed radio sources with tails and plumes seem to be free of bands or anisotropic RM structure (e.g. 3C 31, 3C 449; Laing et al. 2008; Guidetti et al. 2010). Furthermore, the lobes which show bands are all quite round and show evidence for interaction with the surrounding IGM. It is particularly striking that the bands in 3C 353 occur only in its eastern, rounded, lobe. The implication is that RM bands occur when a lobe is being actively driven by a radio jet into a region of high IGM density. Plumes and tails, on the other hand, are likely to be rising buoyantly in the group or cluster and we do not expect significant compression, at least at large distances from the nucleus.
9.2 RM bands in other sources
The fact that RM bands have so far been observed only in a few radio sources may be a selection effect: much RM analysis has been carried out for galaxy clusters, in which most of the sources are tailed (e.g. 2003). With a few exceptions like Cyg A (see below, Section 9.2.1), lobed FR I and FR II sources have not been studied in detail.
9.2.1 Cygnus A
Cygnus A is a source in which we might expect to observed RM bands, by analogy with the sources discussed in the present paper: it has wide and round lobes and Chandra X-ray data have shown the presence of shock-heated gas and cavities (Wilson et al., 2006). RM bands, roughly perpendicular to the source axis, are indeed seen in both lobes (Dreher et al., 1987; Carilli & Taylor, 2002), but interpretation is complicated by the larger random RM fluctuations and the strong depolarization in the eastern lobe. A semi-circular RM feature around one of the hot-spots in the western lobe has been attributed to compression by the bow-shock (Carilli, Perley & Dreher, 1988).
9.2.2 Hydra A
Carilli & Taylor (2002) have claimed evidence for RM bands in the northern lobe of Hydra A. The Chandra image (McNamara et al., 2000) shows a clear cavity with sharp edges coincident with the radio lobes and an absence of shock-heated gas, just as in our sources. Despite the classification as a tailed source, it may well be that there is significant compression of the IGM. Note, however, that the RM image is not well sampled close to the nucleus.
9.2.3 3C 465
The RM image of the tailed source 3C 465 published by Eilek & Owen (2002) shows some evidence for bands, but the colour scale was deliberately chosen to highlight the difference between positive and negative values, thus making it difficult to see the large gradients in RM expected at band edges. The original RM image (Eilek, private communication) suggests that the band in the western tail of 3C 465 is similar to those we have identified. It is plausible that magnetic-field draping happens in wide-angle tail sources like 3C 465 as a result of bulk motion of the IGM within the cluster potential well, as required to bend the tails. It will be interesting to search for RM bands in other sources of this type and to find out whether there is any relation between the iso-RM contours and the flow direction of the IGM.
9.3 Foreground isotropic field fluctuations
The coexistence in the RM images of our sources of anisotropic patterns with areas of isotropic fluctuations suggests that the Faraday-rotating medium has at least two components: one local to the source, where its motion significantly affects the surrounding medium, draping the field, and the other from material on group or cluster scales which has not felt the effects of the source. This raises the possibility that turbulence in the foreground Faraday rotating medium might “wash out” RM bands, thereby making them impossible to detect. The isotropic RM fluctuations observed across our sources are all described by quite flat power spectra with low amplitude (Table 5). The random small-scale structure of the field along the line-of-sight essentially averages out, and there is very little power on scales comparable with the bands. If, on the other hand, the isotropic field had a steeper power spectrum with significant power on scales similar to the bands, then its contribution might become dominant.
We first produced synthetic RM images for 0206+35 including a random component derived from our best-fitting power spectrum (Table 5) in order to check that the bands remained visible. We assumed a minimum scale of 2 kpc from the depolarization analysis for 0206+35 (Sec. 5), and a maximum scale of kpc, consistent with the continuing rise of the RM structure function at the largest sampled separations, which requires arcsec (20 kpc). The final synthetic RM is given by:
| (9) |
where and are the RM due to the draped and isotropic fields, respectively. The terms and are respectively the density and field component along the line-of-sight in the draped region. The integration limits of the term were defined by the surface of the lobe and the draped region, while that of the term starts at the surface of the draped region and extends to 3 times the core radius of the X-ray gas (Table 2). For the electron gas density outside the draped region we assumed the beta-model profile of 0206+35 (Table 2) and for the field strength a radial variation of the form (Guidetti et al., 2010, and references therein).
| (10) |
where is the rms magnetic field strength at the group centre. We took a draped magnetic field strength of 1.8 G, in order to match the amplitudes for the RM bands in both lobes of 0206+35, and assumed the same value for .
Example RM images, shown in Figs. 15(a) and (b), should be compared with those for the draped field alone (Figs. 13b and c, scaled up by a factor of 1.8 to account for the difference in field strength) and with the observations (Fig.2a) after correction for Galactic foreground (Table 4). The model is self-consistent: the flat power spectrum found for 0206+35 does not give coherent RM structure which could interfere with the RM bands, which are still visible.
We then replaced the isotropic component with one having a Kolmogorov power spectrum (). We assumed identical minimum and maximum scales (2 and 40 kpc) as for the previous power spectrum and took the same central field strength (=1.8G) and radial variation (Eq. 10). Example realizations are shown in Fig. 15(c) and (d). The bands are essentially invisible in the presence of foreground RM fluctuations with a steep power spectrum out to scales larger than their widths.
It may therefore be that the RM bands in our sources are especially prominent because the power spectra for the isotropic RM fluctuations have unusually low amplitudes and flat slopes. We have established these parameters directly for 0206+35, 3C 270 and 3C 353; M 84 is only 14 kpc in size and is located far from the core of the Virgo cluster, so it is plausible that the cluster contribution to its RM is small and constant.
We conclude that the detection of RM bands could be influenced by the relative amplitude and scale of the fluctuations of the isotropic and random RM component compared with that from any draped field, and that significant numbers of banded RM structures could be masked by isotropic components with steep power spectra.
9.4 Asymmetries in RM bands
The well-established correlation between RM variance and/or depolarization and jet sidedness observed in FR I and FR II radio sources is interpreted as an orientation effect: the lobe containing the brighter jet is on the near side, and is seen through less magnetoionic material (e.g. Laing 1988; Morganti et al. 1997). For sources showing RM bands, it is interesting to ask whether the asymmetry is due to the bands or just to the isotropic component.
In 0206+35, whose jets are inclined by 40∘ to the line-of-sight, the large negative band on the receding side has the highest RM (Fig. 5). This might suggest that the RM asymmetry is due to the bands, and therefore to the local draped field. Unfortunately, 0206+35 is the only source displaying this kind of asymmetry. The other “inclined” source, M 84, ( 60∘ ) does not show such asymmetry: on the contrary the RM amplitude is quite symmetrical. In this case, however, the relation between the (well-constrained) inclination of the inner jets, and that of the lobes could be complicated: both jets bend by 90∘ at distances of about 50 arcsec from the nucleus (Laing et al., 2011), so that we cannot establish the real orientation of the lobes with respect to the plane of the sky. The low values of the jet/counter-jet ratios in 3C 270 and 3C 353 suggest that their axes are close to the plane of the sky, so that little orientation-dependent RM asymmetry would be expected. Indeed, the lobes of 3C 270 show similar RM amplitudes, while the large asymmetry of RM profile of 3C 353 is almost certainly due to a higher column density of thermal gas in front of the eastern lobe. Within our small sample, there is therefore no convincing evidence for higher RM amplitudes in the bands on the receding side, but neither can such an effect be ruled out.
In models in which an ordered field is draped around the radio lobes, the magnitude of any RM asymmetry depends on the field geometry as well as the path length (cf. Laing et al. 2008 for the isotropic case). For instance, the case illustrated in Figs 13(b) and (c) shows very little asymmetry even for = 40 ∘ . The presence of a systematic asymmetry in the banded RM component could therefore be used to constrain the geometry.
9.5 Enhanced depolarization and mixing layers
A different mechanism for the generation of RM fluctuations was suggested by Bicknell, Cameron & Gingold (1990). They argued that large-scale nonlinear surface waves could form on the surface of a radio lobe through the merging of smaller waves generated by Kelvin-Helmholtz instabilities and showed that RM’s of roughly the observed magnitude would be produced if a uniform field inside the lobe was advected into the mixing layer. This mechanism is unlikely to be able to generate large-scale bands, however: the predicted iso-RM contours are only straight over parts of the lobe which are locally flat, even in the unlikely eventuality that a coherent surface wave extends around the entire lobe.
The idea that a mixing layer generates high Faraday rotation may instead be relevant to the anomalously high depolarizations associated with regions of compressed gas around the inner radio lobes of M 84 and 3C 270 (Section 5 and Fig. 6). We have argued that the fields responsible for the depolarization are tangled on small scales, since they produce depolarization without any obvious effects on the large-scale Faraday rotation pattern. It is unclear whether the level of turbulence within the shells of compressed gas is sufficient to amplify and tangle a pre-existing field in the IGM to the level that it can produce the observed depolarization; a plausible alternative is that the field originates within the radio lobe and mixes with the surrounding thermal gas.
10 Conclusions and outstanding questions
In this work we have analysed and interpreted the Faraday rotation across the lobed radio galaxies 0206+35, 3C 270, 3C 353 and M 84, located in environments ranging from a poor group to one of the richest clusters of galaxies (the Virgo cluster). The RM images have been produced at resolutions ranging from 1.2 to 5.5 arcsec FWHM using Very Large Array data at multiple frequencies. All of the RM images show peculiar banded patterns across the radio lobes, implying that the magnetic fields responsible for the Faraday rotation are anisotropic. The RM bands coexist and contrast with areas of patchy and random fluctuations, whose power spectra have been estimated using a structure-function technique. We have also analysed the variation of degree of polarization with wavelength and compared this with the predictions for the best-fitting RM power spectra in order to constrain the minimum scale of magnetic turbulence. We have investigated the origin of the bands by making synthetic RM images using simple models of the interaction between radio galaxies and the surrounding medium and have estimated the geometry and strength of the magnetic field.
Our results can be summarized as follows.
-
1.
The lack of deviation from rotation over a wide range of polarization position angle and the lack of associated depolarization together suggest that a foreground Faraday screen with no mixing of radio-emitting and thermal electrons is responsible for the observed RM in the bands and elsewhere (Section 4).
-
2.
The dependence of the degree of polarization on wavelength is well fitted by a Burn law, which is also consistent with (mostly resolved) pure foreground rotation (Section 5).
-
3.
The RM bands are typically 3 – 10 kpc wide and have amplitudes of 10 – 50 rad m-2 (Table 4). The maximum deviations of RM from the Galactic values are observed at the position of the bands. Iso-RM contours are orthogonal to the axes of the lobes. In several cases, neighbouring bands have opposite signs compared with the Galactic value and the line-of-sight field component must therefore reverse between them.
-
4.
An analysis of the profiles of and depolarization along the source axes suggests that there is very little small-scale RM structure within the bands.
-
5.
The lobes against which bands are seen have unusually small axial ratios (i.e. they appear round in projection; Fig. 2). In one source (3C 353) the two lobes differ significantly in axial ratio, and only the rounder one shows RM bands. This lobe is on the side of the source for which the external gas density is higher.
-
6.
Structure function and depolarization analyses show that flat power-law power spectra with low amplitudes and high-frequency cut-offs are characteristic of the areas which show isotropic and random RM fluctuations, but no bands (Section 6).
-
7.
There is evidence for source-environment interactions, such as large-scale asymmetry (3C 353) cavities and shells of swept-up and compressed material (M 84, 3C 270) in all three sources for which high-resolution X-ray imaging is available.
-
8.
Areas of strong depolarization are found around the edges of the radio lobes close to the nuclei of 3C 270 and M 84. These are probably associated with shells of compressed hot gas. The absence of large-scale changes in Faraday rotation in these features suggests that the field must be tangled on small scales (Section 5).
-
9.
The comparison of the amplitude of with that of the structure functions at the largest sampled separations is consistent with an amplification of the large scale magnetic field component at the position of the bands.
-
10.
We produced synthetic RM images from radio lobes expanding into an ambient medium containing thermal material and magnetic field, first considering a pure compression of both thermal density and field, and then including three- and two-dimensional stretching (“draping”) of the field lines along the direction of the radio jets (Sects. 7 and 8). Both of the mechanisms are able to generate anisotropic RM structure.
-
11.
To reproduce the straightness of the iso-RM contours, a two-dimensional field structure is needed. In particular, a two-dimensional draped field, whose lines are geometrically described by a family of ellipses, and associated with compression, reproduces the RM bands routinely for any inclination of the sources to the line-of-sight (Sec. 8.3). Moreover, it might explain the high RM amplitude and low depolarization observed within the bands.
-
12.
The invariance of the magnetic field along the axis perpendicular to the forward expansion of the lobe suggests that the physical process responsible for the draping and stretching of the magnetic field must act on scales larger than the lobe itself in this direction. We cannot yet constrain the scale size along the line of sight.
-
13.
In order to create RM bands with multiple reversals, more complex field geometries such as two-dimensional eddies are needed (Section 8.4).
-
14.
We have interpreted the observed RM’s as due to two magnetic field components: one draped around the radio lobes to produce the RM bands, the other turbulent, spread throughout the surrounding medium, unaffected by the radio source and responsible for the isotropic and random RM fluctuations (Section 9.3). We tested this model for 0206+35, assuming a typical variation of field strength with radius in the group atmosphere, and found that a magnetic field with central strength of G reproduced the RM range quite well in both lobes.
-
15.
We have suggested two reasons for the low rate of detection of bands in published RM images: our line of sight will only intercept a draped field structure in a minority of cases and rotation by a foreground turbulent field with significant power on large scales may mask any banded RM structure.
Our results therefore suggest a more complex picture of the magnetoionic environments of radio galaxies than was apparent from earlier work. We find three distinct types of magnetic-field structure: an isotropic component with large-scale fluctuations, plausibly associated with the undisturbed intergalactic medium; a well-ordered field draped around the leading edges of the radio lobes and a field with small-scale fluctuations in the shells of compressed gas surrounding the inner lobes, perhaps associated with a mixing layer. In addition, we have emphasised that simple compression by the bow shock should lead to enhanced RM’s around the leading edges, but that the observed patterns depend on the pre-shock field.
MHD simulations should be able to address the formation of anisotropic magnetic-field structures around radio lobes and to constrain the initial conditions. In addition, our work raises a number of observational questions, including the following.
-
1.
How common are anisotropic RM structures? Do they occur primarily in lobed radio galaxies with small axial ratios, consistent with jet-driven expansion into an unusually dense surrounding medium? Is their frequency qualitatively consistent with the two-dimensional draped-field picture?
-
2.
Why do we see bands primarily in sources where the isotropic RM component has a flat power spectrum of low amplitude? Is this just because the bands can be obscured by large-scale fluctuations, or is there a causal connection?
-
3.
Are the RM bands suggested in tailed sources such as 3C 465 and Hydra A caused by a similar phenomenon (e.g. bulk flow of the IGM around the tails)?
-
4.
Is an asymmetry between approaching and receding lobes seen in the banded RM component? If so, what does that imply about the field structure?
-
5.
How common are the regions of enhanced depolarization at the edges of radio lobes? How strong is the field and what is its structure? Is there evidence for the presence of a mixing layer?
It should be possible to address all of these questions using a combination of observations with the new generation of synthesis arrays (EVLA, e-MERLIN and LOFAR all have wide-band polarimetric capabilities) and high-resolution X-ray imaging.
Acknowledgments
We thank M. Swain for providing the VLA data for 3C 353, J. Eilek for a FITS image of 3C 465 and J. Croston, A. Finoguenov and J. Googder for the X-ray images of 3C 270, M 84 and 3C 353, respectively. We are also grateful to A. Shukurov, J. Stöckl and the anonymous referee for the valuable comments.
References
- (1)
- Baum et al. (1988) Baum, Stefi Alison, Heckman, Timothy M., Bridle, Alan, van Breugel, Wil J. M., Miley, George K, 1988, ApJS, 68, 643
- Bicknell, Cameron & Gingold (1990) Bicknell, G.V., Cameron, R.A., Gingold, R.A., 1990, ApJ, 357, 373
- (4) Blanton, Elizabeth L., Gregg, Michael D., Helfand, David J., et al., 2003, AJ, 125.1635
- Bower et al. (1997) Bower, Gary A., Heckman, Timothy M., Wilson, Andrew S., Richstone, Douglas O., 1997, ApJ, 483, 33
- Bower et al. (2000) Bower, G. A., Green, R. F., Quillen, A. C., Danks, A., et al., 2000, ApJ, 534, 189
- Burn (1966) Burn, B.J., 1966, MNRAS, 133, 67
- Carilli et al. (1988) Carilli, C.L., Perley, R.A., Dreher, J.W., 1988, ApJL, 334, L73
- Carilli & Taylor (2002) Carilli, C.L., Taylor, G.B., 2002, ARAA, 40, 319
- Croston, Hardcastle & Birkinshaw (2005) Croston, J. H., Hardcastle, M. J., Birkinshaw, M., 2005, MNRAS, 357, 279
- Croston et al. (2007) Croston, J. H., Kraft, R. P., Hardcastle, M. J, 2007, ApJ, 660, 191
- Croston et al. (2008) Croston, J.H., Hardcastle, M.J., Birkinshaw, M., Worrall, D.M., Laing, R.A., 2008, MNRAS, 386, 1709
- de Vaucoleurs (1991) de Vaucouleurs, G., de Vaucouleurs, A., Corwin, Jr., H. G. , et al., 1991, Third Reference Catalogue of Bright Galaxies, adsurl: http://cdsads.u-strasbg.fr/abs/1991rc3..book…..D
- Dreher et al. (1987) Dreher, J.W., Carilli, C.L., Perley, R.A., 1987, ApJ, 316, 611
- Dursi & Pfrommer (2008) Dursi, L.J., Pfrommer, C., 2008, ApJ, 677, 993
- Eilek & Owen (2002) Eilek, J.A., Owen, F.N., 2002, ApJ, 567, 202
- Enßlin & Vogt (2005) Enßlin, T.A., Vogt, C., 2005, A&A, 434, 67
- Fanaroff & Riley (1974) Fanaroff, B.L., Riley, J.M., 1974, MNRAS, 167, 31P
- Faraday (1846) Faraday, M., 1846, Trans. R. Soc. Lond., 136, 1
- Ferrari et al. (2008) Ferrari, C., Govoni, F., Schindler, S., Bykov, A. M., Rephaeli, Y., 2008, SSRv, 134, 93
- Finoguenov & Jones (2001) Finoguenov, A., Jones, C., 2001, ApJ, 547, 107
- Finoguenov et al. (2006) Finoguenov, Alexis, Davis, David S., Zimer, Marc, Mulchaey, John S., 2006, ApJ, 646, 143
- Finoguenov et al. (2008) Finoguenov, A., Ruszkowski, M., Jones, C., Brüggen, M., et al., 2008, ApJ, 686, 911
- Forman et al. (2005) W.R. Forman, P.E.J. Nulsen, S. Heinz et al., 2005, ApJ, 635, 894
- Goodger et al. (2008) Goodger, J. L., Hardcastle, M. J., Croston, J. H., Kassim, N. E., Perley, R. A., 2008, MNRAS, 386, 337
- Govoni et al. (2006) Govoni F., Murgia M., Feretti L.,Giovannini G., Dolag K., Taylor G.B., 2006, A&A, 460, 425
- Guidetti et al. (2008) Guidetti, D., Murgia, M., Govoni, F., Parma, P., Gregorini, L., de Ruiter, H.R., Cameron, R.A., Fanti, R., 2007, A&A, 483, 699
- Guidetti et al. (2010) Guidetti, D., Laing, R. A., Murgia, M., Govoni, F., Gregorini, L., Parma, P., 2010, A&A, 514, 50
- Hansen, Norgaard-Nielsen & Jorgensen (1985) Hansen, L., Norgaard-Nielsen, H. U., Jorgensen, H. E., 1985, A&A, 149, 442
- Iwasawa et al. (2000) Iwasawa, K., Ettori, S., Fabian, A. C., Edge, A. C., Ebeling, H., 2000, MNRAS, 313, 515
- Jetha et al. (2007) Jetha, N. N., Ponman, T. J., Hardcastle, M. J., Croston, J. H., 2007, MNRAS, 378, 384
- Kraft et al. (2003) R.P. Kraft, S.E. V\a’zquez, W.R. Forman et al., 2003, ApJ, 592, 129
- Kuchar & Enßlin (2009) Kuchar, Petr, Enßlin, Torsten A., 2009arXiv0912.3930K
- Laing (1988) Laing, R.A., 1988, Nature, 331, 149
- Laing & Bridle (1987) Laing, R.A., Bridle, A.H., 1987, MNRAS, 228, 557
- Laing, Guidetti & Bridle (2011) Laing, R.A., D. Guidetti, Bridle, A.H., 2011, in prep
- Laing & Bridle (2011b) Laing, R.A., Bridle, A.H., 2011b, in prep
- Laing et al. (2008) Laing, R.A., Bridle, A.H., Parma, P., Murgia, M., 2008, MNRAS, 386, 657
- Laing et al. (2011) Laing, R.A., Guidetti, D., Bridle, A.H., Parma, P., Bondi, M., MNRAS, 2011, in prep.
- McNamara & Nulsen (2007) McNamara, B.R., & Nulsen, P. E. J., 2007, ARA&A, 45, 117
- McNamara et al. (2000) McNamara, B.R., Wise, M., Nulsen, P.E.J., David, L.P., Sarazin, C.L., Bautz, M., Markevitch, M., Vikhlinin, A., Forman, W.R., Jones, C., Harris, D.E., 2000, ApJ, 534, L135
- Miller et al. (2002) Miller, N. A., Ledlow, M. J., Owen, F. N., F. N. and Hill, J. M., 2002, AJ, 123, 3018
- Minter & Spangler (1996) Minter, A.H., Spangler, S.R., 1996, ApJ, 458, 194
- Morganti et al. (1997) Morganti, R., Parma, P., Capetti, A., Fanti, R., de Ruiter, H.R., 1997, A&A, 326, 919
- Murgia et al. (2004) Murgia, M., Govoni, F., Feretti, L., Giovannini, G., Dallacasa, D., Fanti, R., Taylor, G.B., Dolag, K., 2004, A&A, 424, 429
- Nulsen et al. (2005) P.E.J. Nulsen, B.R. McNamara, M.W. Wise et al., 2005, ApJ, 628, 629
- Simard-Normandin et al. (1981) Simard-Normandin, M., Kronberg, P. P., Button, S., 1981, ApJS, 45, 97
- Simonetti et al. (1984) Simonetti, J.H., Cordes, J.M., Spangler, S.R., 1984, ApJ, 284, 126
- Swain (1996) Swain, M.R., 1996, PhD. Thesis, University of Rochester, NY, USA
- Swain, Bridle & Baum (1998) Swain, M. R., Bridle, A. H., Baum, S., 1998, ApJ, 1998, 507, 29
- Trager et al. (2000) Trager, S. C., Faber, S. M., Worthey, G., González, J. J, 2000, AJ, 119, 1645
- Tribble (1991) Tribble, P.C., 1991, MNRAS, 250, 726
- Trussoni et al. (1997) Trussoni, E., Massaglia, S., Ferrari, R., Fanti, R., Feretti, L., Parma, P., Brinkmann, W., 1997, A&A, 327, 27
- Vacca et al. (2010) Vacca, V., Murgia, M., Govoni, F., Feretti, et al. 2010, A&A, 514, 71
- Wilson et al. (2006) Wilson, A. S., Smith, David A., Young, A. J., 2006, ApJ, 644,9
- Worrall & Birkinshaw (1994) Worrall, D. M., Birkinshaw, M., 1994, ApJ, 427, 134
- Worrall & Birkinshaw (2000) Worrall, D. M., Birkinshaw, M., 1994, ApJ, 530, 719
- Worrall, Birkinshaw & Hardcastle (2001) Worrall, D. M., Birkinshaw, M., Hardcastle, M. J., 2001, 326, 7
- Worrall et al. (2010) Worrall, D. M., Birkinshaw, M., O’Sullivan, E., Zezas, A., et al., MNRAS, 2010, tmp.1127