11email: deepak.vaidya@iccsir.org 22institutetext: IUCAA, Post Bag 4, Ganeshkhind, Pune-411007, India
22email: rag@iucaa.ernet.in ††thanks: Corresponding Author
Infrared Emission from the Composite Grains: Effects of Inclusions and Porosities on the 10 and 18 Features
Abstract
Aims. In this paper we study the effects of inclusions and porosities on the emission properties of silicate grains and compare the model curves with the observed infrared emission from circumstellar dust.
Methods. We calculate the absorption efficiency of the composite grain, made up of a host silicate oblate spheroid and inclusions of ice/graphite/or voids, in the spectral region 5.0-25.0. The absorption efficiencies of the composite spheroidal oblate grains for three axial ratios are computed using the discrete dipole approximation (DDA). We study the absorption as a function of the volume fraction of the inclusions and porosity. In particular, we study the variation in the and emission features with the volume fraction of the inclusions and porosities. We then calculate the infrared fluxes for these composite grains at several dust temperatures (T=200-350K) and compare the model curves with the average observed IRAS-LRS curve, obtained for circumstellar dust shells around oxygen rich M-type stars. The model curves are also compared with two other individual stars.
Results. The results on the composite grains show variation in the absorption efficiencies with the variation in the inclusions and porosities. In particular, it is found that the wavelength of peak absorption at , shifts towards longer wavelengths with variation in the volume fraction of the inclusions of graphite. The spheroidal composite grains with axial ratio 1.33; volume fraction of f=0.1 and dust temperature between 210-340K, fit the observed infra-red emission from circumstellar dust reasonably well in the wavelength range 5-25. The model flux ratio, R=Flux(18)/Flux(10), compares well with the observed ratio for the circumstellar dust.
Conclusions. The results on the composite grains clearly indicate that the silicate feature at 10 shifts with the volume fraction of graphite inclusions. The feature does not shift with the porosity. Both the features do not show any broadening with the inclusions or porosity. The absorption efficiencies of the composite grains calculated using DDA and Effective Medium Approximation (EMA) do not agree. The composite grain models presented in this study need to be compared with the observed IR emission from the circumstellar dust around a few more stars.
Key Words.:
Infrared emission from Dust – Circumstellar Dust – Composite Dust1 Introduction
Circumstellar dust grains are more likely to be non-spherical and inhomogeneous, viz. porous, fluffy and composites of many small grains glued together, due to grain-grain collisions, dust-gas interactions and various other processes. Since there is no exact theory to study the scattering properties of these inhomogeneous grains, there is a need for formulating models of electromagnetic scattering by these grains. There are two widely used approximations to study the optical properties of composite grains viz. effective medium approximation (EMA) and discrete dipole approximation (DDA). We use DDA for calculating the absorption efficiencies of the composite grains. Mathis & Whiffen (1989) and Mathis (1996) have used EMA to calculate the absorption cross-section for the composite grains containing silicate and amorphous carbon. For details on EMA refer Bohren & Huffman (1983) and for DDA refer Draine (1988). For comparison of two methods see Bazell & Dwek (1990); Perrin & Lamy (1990); Perrin & Sivan (1990); Ossenkopf (1991); Wolff et. al. (1994) and Iati et al. (2004).
In this paper we study the effects of inclusions and porosities on the absorption efficiencies of the silicate grains in the wavelength range of 5–25 . In particular we study the variation in the emission features at 10 and 18 with the volume fraction of inclusions and porosities. We use these absorption efficiencies to compare the average observed infrared emission curve obtained for the circumstellar dust around several oxygen rich M-type stars (IRAS LRS catalogue of Olnon & Raimond, 1986). We have also compared the model curves with two individual stars.
Earlier studies by Henning & Stognienko (1993) showed that composite oblate grains containing silicates and graphites did not show any changes in 10 and 18 features or the ratio R=Flux(18)/Flux(10) with respect to the silicate grains. It must be noted here that they used DDA for calculating absorption cross-section of the composite oblate grains. O’Donnell (1994) also did not find any shift in the 10 or 18 features for the grains containing silicates with the inclusions of carbons (glassy and amorphous). Min et. al. (2006, 2007) have used DDA to study the composite and aggregated silicates and found that the 10 feature shifts to the shorter wavelengths. Jones (1988) found enhancement in the infrared absorption features at 9.7 and 18 for porous silicate grains and hollow spheres. In view of these studies a detailed investigation of the 10 and 18 features using realistic grain models is called for.
In section 2 we give the validity criteria for the DDA and the composite grain models. In section 3 we present the results of our computations and compare the model curves with the observed IR fluxes obtained by IRAS satellite. Section 4 provides a detailed discussion on the comparison of our model/results with available model/results from other workers. The main conclusions of our study are given in section 5.
2 Composite Grains and DDA
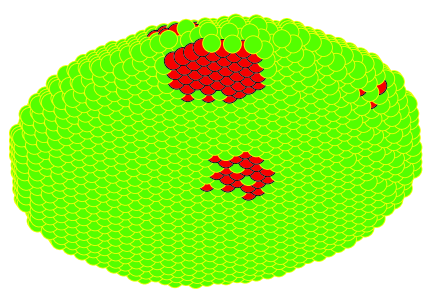
We use the modified computer code (Dobbie, 1999) to generate the composite grain models used in the present study. We have studied composite grain models with a host silicate oblate spheroid containing N= 9640, 25896 and 14440 dipoles, each carved out from , and dipole sites, respectively; sites outside the spheroid are set to be vacuum and sites inside are assigned to be the host material. It is to be noted that the composite spheroidal grain with N=9640 has an axial ratio of 1.33, whereas N=25896 has the axial ratio of 1.5, and N=14440 has the axial ratio of 2.0. The volume fractions of the graphite inclusions used are 10%, 20% and 30% (denoted as f=0.1, 0.2 and 0.3) Details on the computer code and the corresponding modification to the DDSCAT code (Draine & Flatau 2003) are given in Vaidya et al. (2001, 2007) and Gupta et al. (2006). The modified code outputs a three-dimensional matrix specifying the material type at each dipole site; the sites are either silicate, graphite or vacuum. An illustrative example of a composite spheroidal oblate grain with N=9640 dipoles, is shown in Figure 1. This figure also shows the inclusions embedded in the host oblate spheroid. Oblate spheroids were selected based on the numerous results of previous studies (Greenberg and Hong 1975; Henning and Stognienko 1993; O’Donnell 1994, Gupta et al 2005) that showed that oblate spheroids better represent properties of circumstellar dust particles, specifically, this model provides a good fit to the observed polarization across the 10 feature (Lee and Draine 1985).
There are two validity criteria for DDA (see e.g. Wolff et al. 1994); viz. (i) , where m is the complex refractive index of the material, k= is the wave number and d is the lattice dispersion spacing and (ii) d should be small enough (N should be sufficiently large) to describe the shape of the particle satisfactorily. We have checked the validity criteria i.e. , for all the composite grain models with inclusions of ices, graphites and voids. The varied from 0.041 at 5 for N=9640 to 0.001 at 25 for N=25896.
Table 1 shows the number of dipoles (N) for each grain model in the first column and also the size of inclusion (’n’ across the diameter of an inclusion e.g. 152 for N=9640 see Vaidya et al. 2001), the remaining three columns show the number of inclusions and number of dipoles per inclusion (in brackets) for the three volume fractions (f=0.1, f-0.2 and f=0.3) respectively.
| Inclusions | Inclusion | Fractions | |
|---|---|---|---|
| N=9640 | f=0.1 | f=0.2 | f=0.3 |
| AR=1.33 | 32/24/24 | ||
| n=16/12/12 | 1(1184) | 2(1184) | |
| n=8/6/6 | 6(152) | 11(152) | 16(152) |
| n=4/3/3 | 38(16) | 76(16) | 114(16) |
| N=25896 | f=0.1 | f=0.2 | f=0.3 |
| AR=1.50 | 48/32/32 | ||
| n=12/8/8 | 7(432) | 13(432) | 19(432) |
| n=6/4/4 | 54(56) | 108(56) | 162(56) |
| n=3/2/2 | 216(8) | 432(8) | 648(8) |
| N=14440 | f=0.1 | f=0.2 | f=0.3 |
| AR=2.00 | 48/24/24 | ||
| n=16/8/8 | 3(536) | 6(536) | 8(536) |
| n=12/6/6 | 6(224) | 11(224) | 16(224) |
| n=8/4/4 | 23(64) | 46(64) | 68(64) |
| n=6/3/3 | 38(24) | 76(24) | 114(24) |
| n=4/2/2 | 91(8) | 181(8) | 271(8) |
The complex refractive indices for silicates and graphite are obtained from Draine (1985, 1987) and that for ice is from (Irvine & Pollack 1969).
As mentioned before the composite spheroidal grain models with N=9640, 25896 and 14440 have the axial ratio 1.33, 1.5 and 2.0 respectively and if the semi-major axis and semi-minor axis are denoted by x/2 and y/2 respectively, then , where ’a’ is the radius of the sphere whose volume is the same as that of a spheroid. In order to study randomly oriented spheroidal grains, it is necessary to get the scattering properties of the composite grains averaged over all of the possible orientations; in the present study we use three values for each of the orientation parameters (), i.e. averaging over 27 orientations, which we find quite adequate (see Wolff et al. 1994).
3 Results & Discussion
3.1 Absorption Efficiency of Composite Spheroidal Grains
Recently we have studied the effects of inclusions and porosities in the silicate grains on the infrared emission properties in the wavelength region 5-14 (Vaidya and Gupta 2009). In the present paper, we study the absorption properties of the composite spheroidal grains with three axial ratios, viz. 1.33, 1.5 and 2.0, corresponding to the grain models with N=9640, 25896 and 14440 respectively, for three volume fractions of inclusions; viz. 10%, 20% and 30%, in the extended wavelength region 5.0-25.0. The inclusions, selected are graphites/ices/or voids. In this paper we particularly study the effects of inclusions and porosity on the 10 and 18 features individually, as well as on the flux ratio R=Flux(18)/Flux(10).
Figures 2 (a-c) show the absorption efficiencies () for the composite grains with the host silicate spheroids containing 9640, 25896 and 14440 dipoles. The three volume fractions, viz. 10%, 20% and 30%, of ice inclusions are also listed in the top (a) panel. It is seen that there is no appreciable variation in the absorption efficiency with the change in the volume fraction of inclusions in the wavelength region 5-8. The variation in the absorption efficiency is clearly seen in the wavelength range between 8-25 with peaks at 10 and 18. It is also to be noted that there is no shift in the wavelength of the peak absorption. In figures 2(d-f) variation of the absorption efficiency between 8 and 14 is highlighted. It is seen that the strength of both absorption peaks decrease with the increase of volume fraction of the inclusions.

Figure 3 shows the absorption efficiencies for the composite grains with the host silicate spheroids and graphite inclusions. It is seen in figures 3(d-f) that the 10 feature shifts towards shorter wavelengths as the volume fraction of the graphite inclusions increases. Ossenkopf et al. (1992) have studied the effects of inclusions of and carbons (glassy and amorphous) in the silicate grains and they too have found that the 10 absorption feature shifts shortwards. O’Donnell (1994) did not find any shift in 10 feature for the silicate grains with the inclusions of carbons. We did not find any shift in the absorption feature at 18 with the change in the volume fraction of the graphite inclusions. Ossenkopf et al. (1992) and O’Donnell (1994) also did not find any variation in the 18 feature with the inclusions. Henning and Stognienko (1993) have used composite oblate spheroid grains containing silicates and graphites and found no significant shift in the 10 or 18 features.
Results in Figures 3(a-f) also indicate that absorption efficiency does not vary with the shape of the grains (axial ration AR=1.33, 1.50, 2.00).
We also checked the absorption efficiencies of the composite grains for several inclusion sizes (n) at a constant volume fraction (see Table 1 e.g for N=9640 the array 8/6/6 indicates the size of the inclusions). We did not find any significant change in the absorption efficiency or any shift in the absorption features (Vaidya et al. 2001).

We have compared our results on the absorption efficiencies of the composite grains obtained using the DDA with the results obtained using the EMA-T-matrix based calculations. The results with EMA are displayed in Figure 4. For these calculations, the optical constants were obtained using the Maxwell-Garnet mixing rule (i.e. effective medium theory, see Bohren and Huffman, 1983). Description of the T-matrix method/code is given by Mishchenko et al. (2002).

In Figure 5 we show the ratio Q(EMA)/Q(DDA) to compare the results obtained using both the methods. It is seen that the absorption curves obtained using the EMA-T matrix calculations, deviate from the absorption curves obtained using the DDA, as the volume fraction of inclusions increases. The results based on the EMA-T-matrix calculations and DDA results do not agree because the EMA does not take into account the inhomogeneities within the grain (viz. internal structure, surface roughness, voids; see Wolff et al. 1994, 1998) and material interfaces and shapes are smeared out into a homogeneous ’average mixture’ (Saija et al. 2001). However, it would still be very useful and desirable to compare the DDA results for the composite grains with those computed by other EMA/Mie type/T matrix techniques in order to examine the applicability of several mixing rules e.g. see Wolff et al. 1998, Voshchinnikov and Mathis 1999, Chylek et al. 2000, Voshchinnikov et al. 2005, 2006. The application of DDA, poses a computational challenge, particularly for the large values of the size parameter X ( ) and the complex refractive index m of of the grain material would require large number of dipoles and that in turn would require considerable computer memory and cpu time (see e.g. Saija et al. 2001, Voshchinnikov et al. 2006).

We have also calculated the absorption efficiencies of the porous grains. Figure 6 shows the absorption efficiencies of the composite grains with the host silicate spheroids and voids as inclusions. It is seen that as the porosity increases i.e., as the volume fraction ’f’ of the voids increases, the peak strength decreases. However, we did not find any shift in the 10 and 18 features with porosity. Henning and Stognienko (1993) also did not find any change in the 10 or 18 feature for the porous silicate grains. Greenberg and Hage (1990) have shown the change in the feature strength and its shape with the porosity of the grain. Voshchinnikov et al. (2006) and Voshchinnikov & Henning (2008) have used layered sphered model to study the effect of porosity on the 10 feature and they found that the peak strength decreases and the feature broadens with the porosity. Recently, Li et al (2008) have used the porous grains to model the 10 feature in the AGN and they found shift in the 10 absorption peak towards longer wavelength. Min et al. (2007), have successfully used DDA to study the 10 silicate feature of fractal porous grains and explain the interstellar extinction in various lines of sight.

Figures 7, 8 and 9 show the variation of absorption efficiencies with the grain sizes for the composite grains viz. a=0.05, 0.1, 0.5 and 1.0, with the fraction of inclusion of ices, graphites and voids respectively. It is seen that for the small sizes viz. a=0.05 and 0.1, the variation in the absorption efficiency with the change in the volume fraction of inclusions is not appreciable, whereas for the larger grains (a=0.5 and 1.0) the effect is clearly seen i.e. absorption efficiency decreases with the increasing fraction of inclusions. In the Figure 8 we show the Qabs for the silicate grain (i.e. volume fraction f=0.00). It is seen that the absorption is higher than that for composite grains.


All these results on the composite grain models show variation in the absorption efficiencies with the variation of the volume fraction of the inclusions and porosities. These results also show that the peak absorption wavelength at 10 shifts with the graphite inclusions. These composite grain models do not show any shift in the absorption peak at 18 with the change in the volume fraction of the inclusions. Our results on the composite grain models do not show any broadening of the 10 or 18 feature.
3.2 Infrared Emission from Circumstellar Dust: Silicate features at 10 and 18
In general, stars which have evolved off the main sequence and which have entered the giant phase of their evolution are a major source of dust grains in the galactic interstellar medium. Such stars have oxygen overabundant relative to carbon and therefore produce silicate dust and show the strong feature at 10. This is ascribed to the Si-O stretching mode in some form of silicate material, e.g. olivine. These materials also show a much broader and weaker feature at 18, resulting from the O-Si-O bending mode (Little-Marenin and Little, 1990). Using the absorption efficiencies of the composite grains and a power law MRN dust grain size distribution (Mathis et al., 1977), we calculate the infrared flux Fλ at various dust temperatures and compare the observed IRAS-LRS curves with the calculated infrared fluxes, Fλ for the composite grain models. The flux Fλ is calculated using the relation F at dust temperature T in K and Bλ as the Planck’s function. This is valid only if the silicate emission region is optically thin (Simpson 1991; Ossenkopf et al., 1992 and Li et al. 2008). Figure 10 shows the IR fluxes with various dust temperatures (T=200-350K) for the composite grains with N=9640, and inclusions of graphites with f=0.1 and MRN (Mathis et al., 1977) grain size distribution a=0.005-0.250. We checked the grain models with larger grain size distribution (a=0.1-1.0 ) and found that it did not match the observed curve satisfactorily – the fit was very poor.

Table 2 shows the best fit minimized values and corresponding temperatures for all the composite grain models with silicate host and graphite as inclusions. For details on minimization please refer Vaidya & Gupta (1997 and 1999).
| Average Observed | |||
|---|---|---|---|
| IRAS-LRS flux | |||
| (Si+f*Gr) | |||
| Inclusion fraction (f) | N=9640 | 25896 | 14440 |
| 0.1 | 0.00249(270) | 0.00260(270) | 0.00391(290) |
| 0.2 | 0.00273(265) | 0.00332(260) | 0.00450(280) |
| 0.3 | 0.00410(260) | 0.00573(260) | 0.00596(275) |
| IRAS-LRS | |||
| 16340-4634 flux | |||
| (Si+f*Gr) | |||
| 0.1 | 0.00256(210) | 0.00156(210) | 0.00241(220) |
| 0.2 | 0.00191(210) | 0.00165(210) | 0.00164(220) |
| 0.3 | 0.00148(210) | 0.00156(210) | 0.00151(215) |
| IRAS-LRS | |||
| 17315-3414 flux | |||
| (Si+f*Gr) | |||
| 0.1 | 0.00814(230) | 0.00846(235) | 0.00798(245) |
| 0.2 | 0.00972(230) | 0.01112(230) | 0.00985(240) |
| 0.3 | 0.01251(230) | 0.01474(230) | 0.01256(240) |
Table 3 shows the best fit minimized values and corresponding temperatures for all the composite grain models with silicate host and voids (porous) as inclusions.
| Average Observed | |||
|---|---|---|---|
| IRAS-LRS flux | |||
| (Si+f*Por) | |||
| Inclusion fraction (f) | N=9640 | 25896 | 14440 |
| 0.1 | 0.00387(290) | 0.00442(300) | 0.00526(310) |
| 0.2 | 0.00472(305) | 0.00575(320) | 0.00613(325) |
| 0.3 | 0.00570(315) | 0.00708(340) | 0.00713(340) |
| IRAS-LRS | |||
| 16340-4634 flux | |||
| (Si+f*Por) | |||
| 0.1 | 0.00400(220) | 0.00427(220) | 0.00450(225) |
| 0.2 | 0.00451(220) | 0.00505(225) | 0.00517(230) |
| 0.3 | 0.00543(220) | 0.00599(230) | 0.00591(230) |
| IRAS-LRS | |||
| 17315-3414 flux | |||
| (Si+f*Por) | |||
| 0.1 | 0.00644(245) | 0.00629(245) | 0.00660(250) |
| 0.2 | 0.00615(245) | 0.00599(250) | 0.00655(255) |
| 0.3 | 0.00609(250) | 0.00625(260) | 0.00661(260) |
Figure 11(a) shows the average IRAS-LRS observed curve (Whittet, 2003) and its comparison with the minimized best fit model N=9640 and f=0.1 graphite inclusions and a temperature of T=270K. The Figure 11(b) and (c) show the observed IRAS-LRS spectra of two typical stars which have strong silicate feature at 10 (IRAS class 6 as defined by Volk – see Olnon and Raimond, 1986; Gupta et al. 2004) viz. IRAS 16340-4634 and IRAS 17315-3414. These two IRAS objects have been taken from the large set of 2000 IRAS spectra which were classified into 17 classes bye eye (see Gupta et al. 2004) and have least problems with noise or spectral peculiarities. The first star IRAS 16340-4634 fits best with the minimized model N=25896, and f=0.3 graphite inclusions and a temperature of T=210K. The second star IRAS 17315-3414 fits best with the minimized model N=14440, and f=0.1 graphites inclusions and a temperature of T=245K.
Figures 12 (a), (b) and (c) are for the same IRAS-LRS average observed curve and the two IRAS stars respectively but best fitted to silicate host and voids (porous) as inclusions.
The results of model fits to the corresponding temperatures in Figures 11 and 12 lie within a range of 210-290K which essentially indicates the expected range of dust temperatures in the circumstellar disks. One needs to compare the models with a larger set of observed spectra to make more definitive estimates of dust temperatures for individual IRAS and other sources (Henning & Stognienko, 1993).


It is to be noted that for the comparison with observed curves, we have not considered composite grain models with ice as inclusions. Ice is expected to condense in an O-rich stellar atmosphere if sufficiently low temperature environments exist. Such conditions arise if the atmosphere is optically thick (Whittet, 2003). Hoogzaad et al. (2002) have used core-mantle grain model with core silicate and ice as mantle to model the IR emission from the AGB star HD161796 and found that the core-mantle dust model with ice as mantle has temperature in the range of 50-75K.
3.3 Flux Ratio R=Flux(18)/Flux(10)
We have also studied the effect of inclusions and porosity in the silicate grain on the flux ratio R=Flux(18)/Flux(10). Table 4 shows the ratio R for composite grain models with graphite (Si+f*Gr) and voids (Si+f*Por) as inclusions. It is seen from this table that in general for both the models the ratio R decreases with the temperature; the ratio varies from 0.6 at T=200K to 0.2 at T=300K. It is also to be noted from this table that for the composite grain models with graphite as inclusions, the ratio R decreases with the volume fraction of the inclusions, whereas for the models with the voids (i.e. porous grains), the ratio R increases with the volume fraction of voids. These results show that R increases with the porosity and thus clearly indicate that both the inclusions and porosities within the grains modify the emission features in the silicate grains. Henning and Stognienko (1993) did not find any variation in the ratio with the increase of the porosity. They also did not find any variation in the R with the inclusions of graphite.
| Si+f*Gr | 9640 | 25896 | 14440 | ||||||
|---|---|---|---|---|---|---|---|---|---|
| T(K) | 0.1 | 0.2 | 0.3 | 0.1 | 0.2 | 0.3 | 0.1 | 0.2 | 0.3 |
| 200 | 0.504 | 0.485 | 0.471 | 0.503 | 0.478 | 0.463 | 0.551 | 0.528 | 0.504 |
| 225 | 0.339 | 0.325 | 0.316 | 0.338 | 0.321 | 0.310 | 0.370 | 0.354 | 0.338 |
| 250 | 0.247 | 0.237 | 0.231 | 0.247 | 0.234 | 0.227 | 0.270 | 0.259 | 0.247 |
| 275 | 0.192 | 0.184 | 0.179 | 0.191 | 0.181 | 0.176 | 0.209 | 0.200 | 0.191 |
| 300 | 0.156 | 0.149 | 0.145 | 0.155 | 0.147 | 0.143 | 0.170 | 0.163 | 0.155 |
| Si+f*Por | 9640 | 25896 | 14440 | ||||||
| T(K) | 0.1 | 0.2 | 0.3 | 0.1 | 0.2 | 0.3 | 0.1 | 0.2 | 0.3 |
| 200 | 0.567 | 0.592 | 0.619 | 0.584 | 0.620 | 0.655 | 0.607 | 0.631 | 0.656 |
| 225 | 0.381 | 0.398 | 0.416 | 0.392 | 0.416 | 0.439 | 0.408 | 0.423 | 0.440 |
| 250 | 0.278 | 0.290 | 0.303 | 0.286 | 0.304 | 0.321 | 0.298 | 0.309 | 0.321 |
| 275 | 0.215 | 0.225 | 0.235 | 0.220 | 0.236 | 0.249 | 0.231 | 0.240 | 0.249 |
| 300 | 0.175 | 0.183 | 0.191 | 0.180 | 0.191 | 0.202 | 0.187 | 0.194 | 0.202 |
Table 5 shows the ratio of silicate features R=Flux(18)/Flux(10) for the average IRAS-LRS observed curve and the two stars mentioned above and for the best fit corresponding models (from Figures 11 and 12). It is seen from Table 5 that in general the model ratio R=Flux(18)/Flux(10) for the average observed curve (Whittet, 2003) is lower than that obtained for the two stars viz. IRAS 16340-4634 and IRAS 17315-3414. The model ratio, 0.383 for the star IRAS 16340-4634 is comparable with that derived for the circumstellar dust i.e. 0.394 (Simpson 1991 and Ossenkopf et al. 1992). The low value of the ratio derived for the average observed circumstellar features may be due to O-deficient silicates as noted by Little-Marenin and Little (1990) and Ossenkopf et al. (1992). Ossenkopf et al. (1992) have noted that observationally determined flux ratio R for circumstellar dust varies from 0.3 to 0.6. However, it must be noted that the variation in R is not very significant if the range of R, 10 and 18 features is considered. We need to compare the composite grain model with a larger sample of stars to interpret the R for various stellar environments as has been noted by Simpson (1991) and Henning & Stognienko (1993).
| Object/Star | R(Model Si+f*Gr) | R(Model Si+f*Por) | R(Observed) |
|---|---|---|---|
| Average Observed IRAS-LRS flux | 0.201 | 0.189 | 0.255 |
| IRAS 16340-4634 | 0.383 | 0.379 | 0.394 |
| IRAS 17315-3414 | 0.276 | 0.283 | 0.236 |
4 Comparison of our model/results with available model/results from other workers
In this section we have made a detailed comparison of the results of our present work with various other published model/results on the silicate IR emission features which are elaborated in the Tables 6 and 7 (Please note that for the discussion in these tables, the peak position of the 10 feature lies in the interval 9.5-10.2 and the FWHM in the range of 1.8-3.2, as derived by several authors (see Ossenkopf et al. 1992)).
It must be noted here that the list of composite and porous grain models given in Table 6 & 7 are not exhaustive; we have included, particularly, the references/models which show variation in the 10 and 18 silicate features with volume fraction of inclusions or porosity.
These tables show that only three authors viz. Vaidya and Gupta (2010); Henning & Stognienko, (1993) and Min et al. (2007); have used DDA for modeling the composite grains. Henning and Stognienko (1993) did not find any significant variation either in 10, 18 features or in the ratio R=Flux(18)/Flux(10) with porosity or inclusions. They have also noted that the porous and composite grains are not the carriers of AFGL or BN objects. Min et al. (2007) have used a statistical ensemble of simple particle shapes to represent irregularly shaped particles and the models fit the interstellar extinction profile in the spectral range of 5-25. As mentioned earlier the EMA methods used by others do not take into account the effects related to internal grain structure and grain surface roughness (see e.g. Henning and Stognienko 1993, Wolff et al. 1994 and Saija et al. 2001).
It must be emphasized that in the present study, using DDA for the composite grains, we have systematically studied the effects of inclusions and porosities and fit the IR emission from the circumstellar dust in the spectral range 5-25. Further, with our composite grain model, we fit the average observed IRAS-LRS emission curve obtained for circumstellar dust around several M-type stars (Whittet, 2003) and two other individual IRAS stars.
| Computational | Particle Shape | Inclusions/size | Specifications of | |
| method | and composition/ | model/method | ||
| material | ||||
| Our work | DDA | Oblate | Inclusion size in terms | All composite grain |
| (2010) | of number of dipoles | models with volume | ||
| across the diameter | fraction of inclusions | |||
| Inclusion compositions | viz. 10%, 20% and 30% | |||
| are Graphite/ice & | were studied | |||
| vacuum (for porosity) | ||||
| Lee & | Rayleigh | Oblate | Ice, Size: smaller | Core-mantle grains |
| Draine (1985) | approximation | than wavelength | ||
| Jones (1988) | EMAa𝑎aa𝑎aIt is a mixture of two materials, there are no separate inclusions, size is not applicable. | Spheres | Voids to model | Porosity 25% and 50% |
| Hollow spheres | porous grains | |||
| Greenberg & | EMAa𝑎aa𝑎aIt is a mixture of two materials, there are no separate inclusions, size is not applicable. | Spheres | Organic refractory | Inclusion of CHON |
| Hage (1990) | material, Ice & | particles to model | ||
| voids | cometary grains | |||
| Ossenkopf | EMAa𝑎aa𝑎aIt is a mixture of two materials, there are no separate inclusions, size is not applicable. | Ellipsoids | Al2O3, MgO, MgS | 10% inclusion of Al2O3, |
| et al. (1992) | Fe3O4, Fe2O3, & | MgO and MgS | ||
| amorphous carbon | ||||
| Henning & | DDA | Oblate and Prolate | Inclusion size smaller | Two fractions of |
| Stognienko (1993) | The observed polarization | than wavelength and | inclusions | |
| across the 10 | inclusion composition | Fsilicates/Fgraphites | ||
| feature led them | consists of graphite, | viz. 1.3 & 0.8 | ||
| to conclude that the | ice, voids & | |||
| silicate particles | amorphous carbon | |||
| are oblates | ||||
| rather than prolates | ||||
| O’Donnell | EMAa𝑎aa𝑎aIt is a mixture of two materials, there are no separate inclusions, size is not applicable. | Oblates and prolates | Inclusion composition | Core-mantle particles with |
| (1994) | They found that | consists of | silicate-amorphous ice | |
| prolate grains shift | amorphous carbon, | and amorphous carbon | ||
| the 10 & 18 | glassy carbon, | |||
| features too so as | tholins & voids | |||
| to be consistent | ||||
| with the observed data | ||||
| Min et al. | DDA | Gaussian Random Spheres | Inclusion consists of | Silicate grains |
| (2007) | Gaussian Random | distribution of | with Mg component | |
| Field particles | amorphous carbon, | 0.9 | ||
| hollow spheres | amorphous silicate | |||
| Voshchinnikov & | Layereda𝑎aa𝑎aIt is a mixture of two materials, there are no separate inclusions, size is not applicable. | Spherical grains | Inclusion composition | Volume fraction of inclusions |
| Henning (2008) | spheres | consists of amorphous | range from 0.2 | |
| carbon and amorphous | to 0.9 | |||
| silicates | ||||
| Li et al. | Multi-layereda𝑎aa𝑎aIt is a mixture of two materials, there are no separate inclusions, size is not applicable. | Concentric | Inclusion composition | Mass ratio of amorphous |
| (2008) | sphere model | spherical layers | consists of amorphous | carbon v/s amorphous silicates |
| carbon & porous/voids | to be 0.7 |
| Characteristics of | Characteristics of | Ratio(R) | Observational | |
| 10 feature | 18 feature | 18/10 | characteristics | |
| Our work | Shifts shortwards with | No shift in this | R Decreases with | Dust temperatures 200-350K |
| (2010) | graphite inclusions | feature is indicated | volume fractions of | are derived from composite |
| & no broadening of | graphite; increases | grain models fit the | ||
| this feature is | with porosity & | observed IRAS-LRS curve | ||
| indicated | varies between 0.2-0.6 | as well as for 2 stars | ||
| selected in this paper | ||||
| Lee & | No shift is indicated | Not studied | R not determined | Core-mantle grain model fit |
| Draine (1985) | well with the observed | |||
| IR emission from BN object | ||||
| Jones | Feature is | Feature is | R not determined | No comparison was made |
| (1988) | enhanced | enhanced | ||
| Greenberg | Grains with silicate cores | This feature | R not determined | Pure silicate does not fit |
| & Hage (1990) | & refractory organic | was not | the observed emission in | |
| materials as mantles | studied | comets but porous grains | ||
| with 60-80% porosity | and CHON particles fit the | |||
| fit the 10 feature | observed IR emission from | |||
| observed in comets | cometary dust | |||
| Ossenkopf | Feature shifts shortwards | Did not find | R0.3-0.5 | Grain models based on optical |
| et al. (1992) | () & broadens | any shift in | for most inclusions | constants of |
| (FWHM 2-2.7) | this feature | & is enhanced to | astronomical Si (Draine 1985) | |
| with Al2O3 inclusions | 0.68 for MgO | do not fit the observed | ||
| observed IR emission from | ||||
| circumstellar dust | ||||
| Henning & | No appreciable shift | Feature shifts | R0.41-0.47 | Porous and composite grains |
| Stognienko (1993) | with inclusions | shortwards and | do not fit the observed | |
| indicated | broadens with | IR emission from AFGL 2591 | ||
| amorphous carbon | or BN objects | |||
| O’Donnell | No shift in this | No shift in | R=0.51 for prolates | The silicate grains which give rise |
| (1994) | feature with | this feature | R=0.42 for oblates | to the 10 & 18 features do not |
| inclusions indicated | with inclusions | Observed R value | posses any coatings of | |
| is indicated | is between 0.3-0.6 | amorphous or glassy carbon | ||
| Min et al. | Feature shifts shortwards | No shift in | R not determined | GRF, DHS and irregularly |
| (2007) | () & broadens | this feature | shaped particles fit | |
| (FWHM 2-2.5) | the interstellar spectrum | |||
| in the region 5-25 | ||||
| Voshchinnikov | The strength of this | This feature | R not determined | Porous and fluffy grain |
| & Henning (2008) | feature decreases with | was not | models fit the observed | |
| the porosity and the | studied | 10 feature in | ||
| feature also broadens | T-Tauri & Herbig Ae/Be stars | |||
| (FWHM 2.1-2.7) | ||||
| Li et al. | This feature shifts to longer | This feature | R not determined | Observed 10 feature |
| (2008) | wavelengths () | was not | can be explained in | |
| & the profile broadens | studied | terms of porous composite | ||
| (FWHM 2.1-2.8) | dust consisting of | |||
| with porosity | amorphous Si and C & vacuum |
5 Summary and Conclusions
We have used the discrete dipole approximation (DDA) to calculate the absorption efficiency for the composite spheroidal grains and studied the variation of absorption efficiency with the volume fractions of the inclusions in the wavelength region of 5.0-25.0. These results clearly show the variation in the absorption efficiency for the composite grains with the volume fractions of the inclusions as well as with porosity. The results on the composite grains with graphite as inclusions show a shift towards shorter wavelength for the peak absorption feature at 10 with the volume fraction of the inclusions. However, these composite grain models did not show any shift in the 18 peak with the variation in the inclusions or porosities. Henning and Stognienko did not find any shift in either 10 or 18 feature for the oblate composite spheroid containing silicates and graphites. For the porous silicate grains, we did not find any shift in 10 or 18 feature; whereas Li et al. (2008) found the shift towards longer wavelength in the 10 feature for the porous silicate grains. Ossenkopf et al. (1992) found shift towards shorter wavelength in the 10 feature for the composite silicate grains with carbon inclusions. The composite grain models presented in this study did not show any broadening in the 10 and 18 features. In the Table 6 & 7 and Section 4, we compare and summarize all the results.
The dust temperatures between 200-350K derived from the composite grain models fit with the observed IRAS-LRS curve and comparable with the dust temperature range 200-400K as suggested by Voshchinnikov & Henning (2008). The ratio R=Flux(18)/Flux(10) obtained from the composite grain model varies from 0.2 to 0.6 and compares well with that derived from the observed IRAS-LRS curves for the circumstellar dust viz. Little-Marenin and Little (1990); Ossenkopf et al. (1992) and Volk & Kwok (1988).
It must be noted here that the composite grain models considered in the present study are not unique. However, these results on composite grains clearly indicate that the silicate features at 10 and 18 vary with the volume fraction of inclusions and porosities. We also note that the results based on DDA and EMA calculations for the composite grains do not agree. The composite grain models presented in this paper need to be compared with a larger sample of stars with circumstellar dust (Little-Marenin & Little, 1990, Simpson 1991, Ossenkopf et al. 1992 and Henning & Stognienko, 1993).
Acknowledgements.
DBV and RG thank ISRO-RESPOND for the grant (N0. ISRO/RES/2/345/ 2007-08), under which this study has been carried out. Authors thank the referee for constructive suggestions.References
- (1) Bazell D. and Dwek,1990,ApJ,360,342
- (2) Bohren A. and Huffman J.B.,1983,in Absorption and Scattering of light by Small Particles
- (3) Chylek, P., Videen, G., Geldart, D.J.W., Dobbie, J., William, H.C., 2000: in Light Scattering by Non-spherical Particles, Mishchenko, M., Hovenier, J.W. and Travis, L.D. (eds), Academic Press, New York, p. 274
- (4) Dobbie J., 1999, PhD Thesis, Dalhousie University,
- (5) Draine B.T., 1985, ApJS, 57, 587
- (6) Draine B.T., 1987, Preprint Princeton Observatory, No. 213
- (7) Draine B.T., 1988, ApJ, 333, 848
- (8) Draine B.T. and Flatau P.J., 2003, DDA code version ’ddscat6’
- (9) Greenberg, J.M and Hong, S.S., 1975, Ed. N. Watson, Acad. Publ, p132
- (10) Gupta, Ranjan, Singh, H.P., Volk, K. and Kwok, S., 2004, ApJS, 152, 201
- (11) Gupta, Ranjan, Mukai, T, Vaidya, D.B., Sen, A.K. and Okada, Y., 2005, A&A, 441, 555
- (12) Gupta R., Vaidya D.B., Dobbie J.S. and Chylek P., 2006, Astrophys. Space Sci., 301, 21
- (13) Greenberg, J.M. and Hage, J., 1990, ApJ, 361, 251
- (14) Henning, Th. and Stognienko, R, 1993, A&A, 280, 609
- (15) Hoogzaad, S, Molster, F. and Dominik, C., 2002, A&A, 389, 547
- (16) Iati, M.A., Giusto, A., Saija, R., Borghese, F., Denti, P., Cecchi-Pestellini, C. and Aielo, S., 2004, ApJ, 615, 286
- (17) Irvine W. M. and Pollack J. B., 1968, ICARUS, 8, 324
- (18) Jones, A. P., 1988, 234, 209
- (19) Lee H. M. and Draine B. T., 1985, ApJ, 290, 211
- (20) Li M.P., Shi Q.J.,and Li, A.., 2008, MNRAS, 390, 778
- (21) Little-Marenin J.R and Little, S.J., 1990, AJ, 94, 1173
- (22) Mathis J.S., 1996, Ap.J., 472, 643
- (23) Mathis J.S. and Whiffen G., 1989, Ap J., 341, 808
- (24) Mathis J.S., Rumpl W., Nordsieck K.H., 1977, Ap.J., 217, 425
- (25) Min, M., Dominik, C., Hovenier, J., deKoter, A., Waters, L.A.F.M., 2006, A&A, 445, 1005
- (26) Min, M., Waters, L.A.F.M.,deKoter, A., Hovenier, J., Keller, L.P. and Markwick-Kemper, F., 2007, A&A, 462, 667
- (27) Mishchenko, M.L., Travis, L.D. and Lacis, A.A., 2002, in Scattering, Absorption and Emission of Light by Small Particles, CUP, Cambridge, UK, p.184
- (28) O’Donnell, J.E., 1994, ApJ, 437, 262
- (29) Olnon, F.M. & Raimond. E., 1986, A&AS, 65, 607
- (30) Ossenkopf V., 1991, A&A, 251, 210
- (31) Ossenkopf V., Henning Th and Mathis, J. 1992, A&A, 261, 567
- (32) Perrin J.M. and Lamy P.L., 1990, ApJ, 364, 146
- (33) Perrin J.M. and Sivan J.P. 1990, A & A, 228, 238
- (34) Purcell, E.M. and Pennypacker, C.R., 1973, ApJ, 186, 705
- (35) Saija R.,Iati M.,Borghese F.,Denti P.,Aiello S.,Cecchi-Pestellini C. ApJ.,(2001), 539,993
- (36) Simpson, J. P., 1991, ApJ, 368, 570
- (37) Vaidya D.B. and Gupta R., 1997, A &A, 328, 634
- (38) Vaidya D.B. and Gupta Ranjan, 1999, A & A, 348, 594
- (39) Vaidya D.B., Gupta R., Dobbie J.S and Chylek P., 2001, A & A, 375, 584
- (40) Vaidya D.B., Ranjan Gupta and Snow T.P., 2007, MNRAS 379, 791
- (41) Vaidya D.B. and Gupta R., 2009, JQSRT, 110, 1726
- (42) Volk, K. and Kwok, S., 1988, ApJ, 331, 435
- (43) Voshchinnikov N.V. and Mathis, J.S., 1999, ApJ, 526, 257
- (44) Voshchinnikov, N.V., Il’in, V.B. and Th. Henning, 2005, A&A, 429, 371
- (45) Voshchinnikov N.V.,Il’in V.B., Henning Th., Dobkova D.N.. 2006, A&A,445,993
- (46) Voshchinnikov, N.V, and Henning Th., 2008, A&A Letts., 483, L9
- (47) Whittet D.C.B., 2003, in Dust in the Galactic Environments, pp 125, 2nd Edn. (IOC Publishing Ltd. UK)
- (48) Wolff M.J., Clayton G.C., Martin P.G. and Sculte-Ladlback R.E., 1994, ApJ, 423, 412
- (49) Wolff M.J., Clayton G.C. and Gibson S.J., 1998, ApJ, 503, 815