Infrared Spectroscopy of the Diffuse Ionized Halos of Edge-on Galaxies
Abstract
We present a study of ionized gas, PAHs, and H2 emission in the halos of three edge-on galaxies, NGC 891, NGC 5775 and NGC 3044, based on m Spitzer Space Telescope spectra. The [Ne III]/[Ne II] ratio, an excellent measure of radiation hardness, rises with in the halo of NGC 891. It is also higher in the halo of NGC 5775 than in the disk. NGC 3044 presents a more confusing situation. To explain the [Ne III]/[Ne II] as well as optical line ratio behavior in NGC 891, we carry out a simple exploration of parameter space with CLOUDY, which indicates a large increase in radiation temperature with height. Illustrative examples of physical models using a Monte Carlo radiative transfer code show that the rising neon ratio may be explained by adding a vertically extended, hot stellar source to a thin disk of massive stars. However, several other sources of hard spectra may be relevant. PAH features have scale heights of 430–530 pc in NGC 891 and 720–1080 pc in NGC 5775, suggesting they can be transported by disk-halo flows. Within NGC 891 and NGC 5775, scale heights are similar for all PAHs. For NGC 891, the scale heights exceed that of 8 m emission, indicating a transition from more ionized to more neutral PAHs with height. Most PAH equivalent widths are higher in the halos. H2 17.03 m emission with scale heights of pc in NGC 891 and 850 pc in NGC 5775 suggests a molecular component in a surprisingly thick layer.
1 Introduction
Gaseous halos of spiral galaxies have grown in importance in recent years as they are at the interface between galaxies and their environments, and as such are the sites of many physical processes that dictate galaxy evolution. Supernovae and stellar winds in disks can pump mass and energy into halos setting up a disk-halo cycle of gas (Norman & Ikeuchi 1989), depending on the level of star formation activity. Halos may also contain gas accreting onto galaxies, either primordial or from companions (Sancisi et al. 2008). Gas from these two sources may interact dynamically, thermally, and chemically. Such feedback from star formation is believed to be important for understanding the growth of galaxies and their current properties (White & Frenk, 1991).
The discovery of thick layers of interstellar gas and dust, whether referred to as “halos” or “extraplanar” components, has opened up a window on these issues. In the past twenty years or so, such thick layers have been discovered in just about every component of the ISM, especially in X-rays (e.g., Tüllmann et al. 2006b; Strickland et al. 2004), HI (e.g., Oosterloo, Fraternali, & Sancisi 2007), radio continuum (e.g., Dahlem, Lisenfeld, & Rossa 2006), diffuse ionized gas (DIG; e.g., Rossa & Dettmar 2003b; Rand 1996), and dust (Howk & Savage 1999; Alton et al. 1998, 2000). Particularly for the DIG, X-ray, radio continuum and dust components, their brightness and extent correlate with the level of disk star formation, both within and among galaxies, indicating an origin in a disk-halo flow (Rand 1996, 1998a; Rossa & Dettmar 2003a; Tüllmann et al. 2006a; Strickland et al. 2004; Dahlem et al. 2006; Howk & Savage 1999). Yet, some halo gas may be due to continued primordial infall onto galaxy disks, which some lines of evidence indicate is necessary to maintain star formation (e.g., Chiappini, Matteucci, & Gratton 1997; Bauermeister, Blitz, & Ma 2010). Also, the metallicities of many Galactic High Velocity Clouds are as low as 0.1 Z (Wakker 2004), possibly indicating a mixing of primordial and processed gas. Finally, lagging DIG (e.g., Heald et al. 2007) and HI (Oosterloo et al. 2007) halos have also been interpreted as a signature of such mixing (Fraternali & Binney 2008), although other explanations are possible (Benjamin, 2002).
1.1 Spectroscopy of DIG
The DIG is a valuable tracer of energetic processes occurring in gaseous halos, largely through the substantial leverage provided by observations of emission lines. Studies of halo or “extraplanar”DIG in external edge-ons have been motivated by the detailed characterization of the DIG (or Reynolds Layer) of the Milky Way (Reynolds 1990; Haffner et al. 2009), and the questions that have arisen therefrom. One of the most important questions is what keeps the DIG ionized.
Despite the large vertical extent of extraplanar DIG layers in many galaxies (e.g., Rand 1996), there is much evidence from various diagnostic line ratios that the primary source of ionization is radiation leaking from a thin disk of massive stars (e.g., Rand 1997, 1998b; Greenawalt, Walterbos, & Braun 1997; Collins & Rand 2001; Otte, Gallagher, & Reynolds 2002; Haffner, Reynolds, & Tufte 1999; Hoopes & Walterbos 2003; Madsen, Reynolds, & Haffner 2006). In the Milky Way, such radiation is also the only source that can meet the energetic requirement of keeping the DIG layer ionized (Reynolds 1990). Most commonly observed is that the ratios of [S II] and [N II] to H generally increase with distance from the suspected ionizing source, in the Milky Way and in external galaxy disks and halos (all emission lines, and ionization energies necessary to create the responsible ions, relevant for this paper are listed in Table 1). This is a signature of a falling ionization parameter, , (e.g., Domgorgen & Mathis 1994; Rand 1998b) but other factors have been argued to affect line ratios significantly – namely elevated gas temperatures in the diffuse gas (Reynolds et al. 2001; Haffner et al. 1999) and hardening of the radiation field during its propagation (Hoopes & Walterbos 2003; Wood & Mathis 2004, hereafter WM).
The situation is further complicated by the spatial behavior of other line ratios, such as [O III]/H, [O I]/H, and He I/H (see Haffner et al. 2009 for a summary). The first of these ratios, in particular, shows behavior in many galaxies suggesting that some DIG ionization occurs through processes other than photo-ionization by a thin disk of massive stars. In several external spiral galaxies, both edge-on and more face-on, this ratio increases or stays relatively constant with distance from the ionizing stars (e.g., Rand 1998b, 2000; Galarza, Walterbos, & Braun 1999; Otte et al. 2002; Hoopes & Walterbos 2003; Miller & Veilleux 2003). An increase with height has also been found in the Reynolds Layer in the inner Galaxy (Madsen & Reynolds 2005). This may be partially explained by elevated gas temperatures, although Collins & Rand (2001) find this explanation insufficient for NGC 5775 and UGC 10288. In cases such as these and the well-studied NGC 891, other sources of ionization are indicated, with shocks receiving the most attention (e.g., Collins & Rand 2001). Not all extraplanar DIG layers may require such a source, however. Some show a drop of [O III]/H with height, (Tüllmann & Dettmar 2000; Miller & Veilleux 2003). One of these is NGC 3044, especially clear in the more westerly of the two long slit spectra presented by Tüllmann & Dettmar (2000).
A further complication is the assumed abundances. In general, solar or “ISM” abundances are assumed in photo-ionization models (e.g., Domgorgen & Mathis 1994; Sembach et al. 2000; WM), but one can expect some sensitivity of line ratios to abundances, either directly, or through variation in the cooling efficiency. Sembach et al. (2000) find that most line ratios vary inversely with abundance in their photo-ionization models, although Domgorgen & Mathis (1994) and WM find a more complicated relationship. Given the possibility that halo gas contains a mix of disk-halo cycled and primordial gas, abundance variations may well be important.
Finally, one should mention the complication caused by extinction, which has been found to be significant even at kpc from the disk in several edge-on spirals, including NGC 891 (Howk & Savage 1999, 2000, and references therein). We crudely estimate in this paper that there should be many magnitudes of visual extinction in the midplanes of the galaxies we report on. Therefore, apart from the effect of extinction on line ratios, the depth along the line of sight to which we are probing optically likely varies significantly with .
With these various difficulties in interpreting optical line ratios, it is desirable to have a diagnostic of ionization with a more straightforward interpretation. Such an opportunity is provided by the Infrared Spectrograph (IRS; Houck et al. 2004) on board the Spitzer Space Telescope (Werner et al. 2004), which allows measurement of the ratio of the 15.56 m [Ne III] (ionization potential 41.0 eV) and 12.81 m [Ne II] (ionization potential 21.6 eV) lines, as well as others. This ratio provides a diagnostic of the hardness of ionizing radiation that is relatively insensitive to extinction, gas-phase abundances, and gas temperature (being low excitation lines in warm gas) – three of the biggest sources of confusion for the optical lines [the ratio is enhanced in low-metallicity galaxies, but this is attributed to the associated harder stellar radiation fields (e.g. Hunt et al. 2010, Hao et al. 2009)]. Pioneering work with the Infrared Space Observatory (ISO) first demonstrated the power of this diagnostic (e.g., Thornley et al. 2000; Giveon et al. 2002; and Verma et al. 2003).
In Rand, Wood, & Benjamin (2008, hereafter RWB) we presented our first measurements of this ratio in the DIG halo of NGC 891 (assumed distance 9.5 Mpc), at kpc on opposite sides of the disk. The ratio was found to be elevated in both extraplanar pointings relative to the disk.
If the DIG is ionized by radiation leaking out of the disk, then the same stars, with the same metallicities, are responsible for disk and halo ionization, and our result for NGC 891 would therefore be due to propagation effects. To understand whether such a scenario is viable, we combined the neon ratio with optical line ratios along a long slit running through the IRS pointings, and modeled line emission from the DIG layer using the 2D Monte-Carlo radiative transfer code of Wood, Mathis, & Ercolano (2004). The code is also capable of 3D simulations. The models include the effects of radiation field hardening and explore various temperatures and luminosities of the radiation field, and were tailored to the diffuse ISM density distribution of NGC 891. As applied to optical line ratios for the Reynolds layer and the halo of NGC 891, WM had found that spectral hardening reduced the need for a non-ionizing heat source, yet it was still not possible to match all the line ratio data, so that additional heating and/or a secondary ionization source still seems to be required. With the neon ratio included, RWB found that no model could reproduce the observed low values of this ratio and its rise with ; neither could they predict a rising [O III]/H, or the typical values of [O I]/H, and He I/H. They are more successful in reproducing the rise of [S II]/H and [N II]/H, at least semi-quantitatively. We emphasize that including a non-ionizing heat source or a metallicity gradient should affect the optical line ratios significantly but not the neon ratio. These results are obviously problematic for such photo-ionization models.
Clearly, one wishes to know whether the values of the neon ratio measured by RWB, and their enhancement off the plane, are typical of DIG layers, whether this infrared ratio reflects trends in optical ratios, especially [O III]/H (the second ionization potential of oxygen is 35.1 eV, nearly as high as that of neon), and whether the neon ratio in general presents such difficulties for photo-ionization models. We have therefore extended our observations to kpc on both sides of the plane in NGC 891 (where [O III]/H rises more dramatically), and observed disk and halo positions in two other edge-ons, NGC 5775 and NGC 3044 [we use the same distances, 24.8 Mpc and 16.1 Mpc, respectively, as in Collins et al. (2000) and Lee & Irwin (1997))], where coincident optical spectra along slits perpendicular to the disk are also available. The former galaxy is more actively star forming than NGC 891 (Rand 1996), while the long-slit spectroscopy indicates a strongly rising [O III]/H with (Rand 2000). By contrast, as mentioned above, NGC 3044 shows a falling [O III]/H, especially for one long slit whose location is the focus of our IRS observations. It also has a relatively bright extraplanar DIG layer (Rossa & Dettmar 2003a).
We reconsider photo-ionization models in light of our results, focusing on NGC 891. We begin with a general exploration of parameter space using the CLOUDY code (Ferland et al., 1998), asking the simple question of whether there is any combination of ionization parameter, radiation temperature and gas temperature that can reproduce the infrared and optical line ratios in NGC 891 independently at each height. That exploration opens up a wide range of parameter space with a new set of constraints to consider in physical models, and suggests a tractable way to explore multiple ionization sources in future work. Consistent with these findings, we present an initial exploration of this space with new Monte Carlo radiative transfer models that include a second, vertically extended stellar ionizing source.
1.2 Dusty Halos
The dust content of gaseous halos can provide clues to their origin. There is plenty of evidence for dusty halos through both emission (e.g., Whaley et al. 2009) and absorption (e.g., Howk & Savage 1999). That dusty halos are powered by star formation driven disk-halo cycling of gas is suggested by the correlation among galaxies between the presence of extraplanar H extinction and emission (e.g., Howk & Savage 1999). It seems most likely that dust is transported upwards with the gas. However, other explanations for halo dust are possible (see Howk & Savage 1997 for a general discussion), including radiative acceleration of grains (Franco et al. 1991), which may lift clouds to heights of a few hundred pc through gas-dust coupling. It has also been argued that grain lifetimes are much shorter than the typical residence time in the ISM (Draine 2003), implying much dust formation and modification in the ISM. It seems more likely that such dust formation would take place in the denser disk environment than in halos, although the energetic processes involved in disk-halo flows may modify dust properties. This latter point may be important for understanding dust evolution and provides motivation for studies such as ours.
The IRS provides the ability to study emission from Polycyclic Aromatic Hydrocarbons (PAHs; Leger & Puget 1984; Allamandola, Tielens, & Barker 1985; Bakes, Tielens, & Bauschlicher 2001a; Bakes et al. 2001b; Draine & Li 2007) - molecules up to about 20 in size containing up to a few thousand C atoms which in SINGS galaxies are found to contribute a few percent of the dust mass (Draine et al. 2007). Emission features in the m range are thought to arise from more neutral PAHs relative to features in the m range (Draine & Li 2007; Galliano et al. 2008).
It is uncertain how PAHs relate to the larger dust grains, but it has become clear in recent years that PAH emission is suppressed relative to the emission from larger grains in the immediate vicinity of recently formed stars (e.g., Lebouteiller et al. 2007), a result attributed to destruction of PAH molecules by UV radiation (e.g., Gordon et al. 2008). A key piece of evidence for this picture is the decrease of PAH Equivalent Widths (EW) with increasing radiation field hardness (at least in the eV range), as measured by [Ne III]/[Ne II], in star forming regions (Madden et al. 2006; Wu et al. 2006; Engelbracht et al. 2008), although there seems to be no correlation below [Ne III]/[Ne II] 1 (Brandl et al. 2006; Gordon et al. 2008), the regime that will be relevant here.
In halos, radiation fields are much weaker, whatever their hardness, and it is less likely that processing of grains by radiation will be important. Furthermore, it should be pointed out that in the general ISM as well as in halos, radiation field intensities are low enough so that even the continuum in the m range should be dominated by grains heated by single photons rather than ones in thermal equilibrium, according to Draine & Li (2007). We should therefore expect that the PAH spectrum should not vary significantly with radiation hardness or intensity for the kinds of environments relevant here. Rather, relative variations in PAH emission are likely to reflect real changes in the PAH population, and would point to other energetic processes likely to be relevant for halos, such as the aforementioned photo-levitation, or shocks, where PAHs may be produced (by grain collisions or sputtering; Jones, Tielens, & Hollenbach 1996), as well as destroyed (Micelotta, Jones, & Tielens, 2010).
Imaging is beginning to reveal extended halos of PAHs in edge-on galaxies (e.g., Whaley et al. 2009 for NGC 891, Howk et al. 2009 for NGC 5775). Spectroscopy reveals more detailed information but fewer studies exist. In RWB our limited spectra provided a first look at scale heights and EWs of PAH features in NGC 891. Elsewhere, the halo of the starburst M82 has also been studied spectroscopically, first by Engelbracht et al. (2006). More recently, Galliano et al. (2008) find that the intensity ratios of both the 6.2 and 7.7 m features relative to the 11.2 m feature decrease in this halo, which they interpret as a drop in the contribution from ionized PAHs. Otherwise, they find the mix of PAHs in M82 is quite invariant. In the same galaxy, Beirão et al. (2008) find higher EWs of neutral PAHs, but not ionized PAHs, in the halo than in the disk, but they attribute this to a drop in the continuum longward of 10 m relative to the PAH strength.
With our larger set of IRS spectra we can start to examine these issues in the halos of more normal, albeit still quite actively star forming, edge-on galaxies, and do so in more depth than was possible in RWB. Scale heights of PAH emission can be compared with those of other vertically extended components to relate PAH and gaseous halos. Scale heights of various features and disk-halo contrasts of their EWs can be compared to search for modification of the PAH population with height.
2 Observations
The data were taken on 2008 March 26 (NGC 5775), September 9 (NGC 891), and 2009 January 7–8 (NGC 3044) (program ID40284; PI: R. Rand) using the staring mode of the IRS Short-High (SH) module on board Spitzer. A log of the observations is given in Table 2. The SH module is a cross-dispersed echelle spectrograph providing spectral coverage from 9.9 to 19.6 m with a resolving power of 600. The aperture has dimensions of x. In staring mode the SH module nods between two pointings centered 1/3 and 2/3 of the way along the slit.
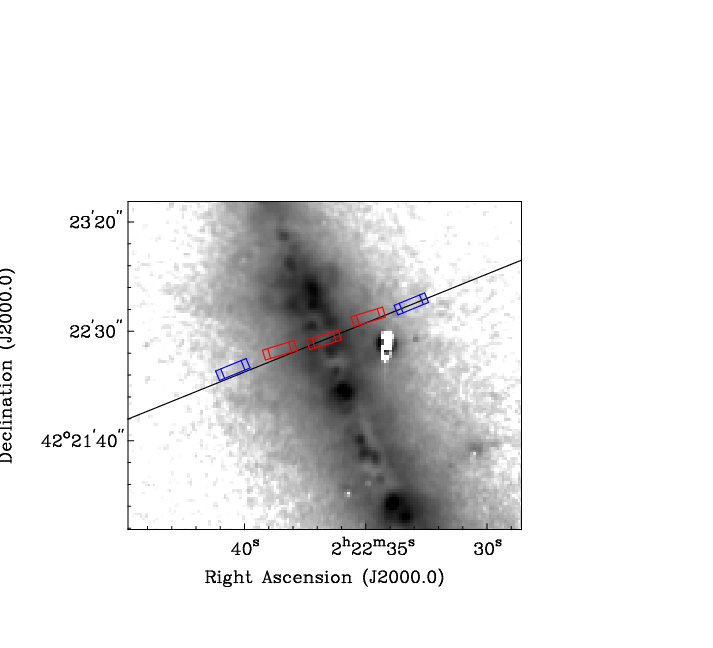
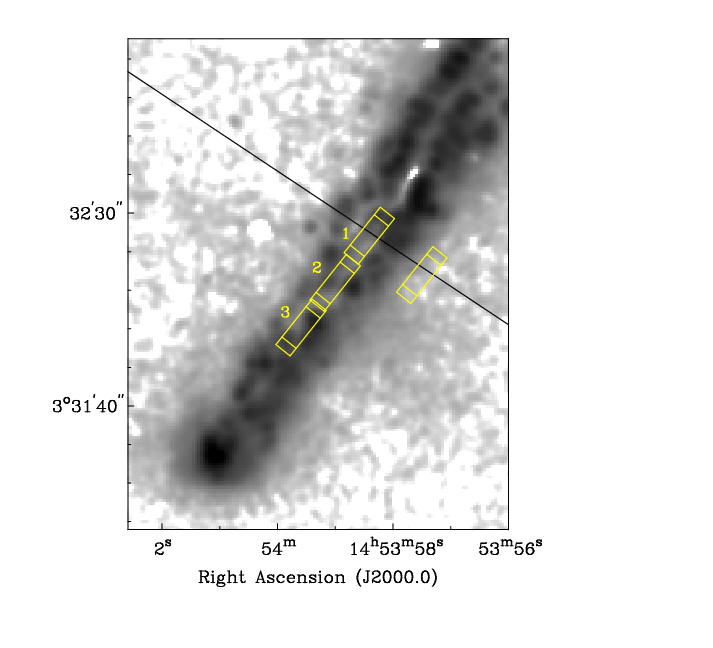
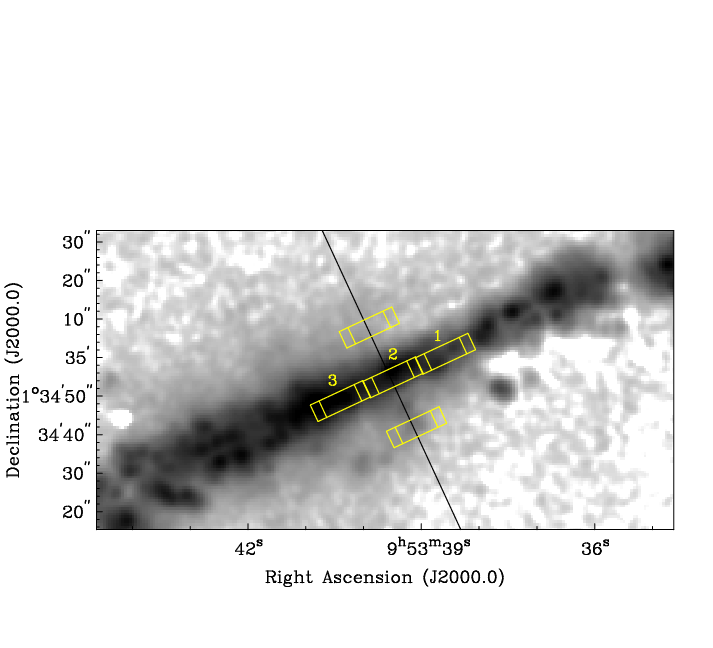
Coordinates of all pointings are given in Table 2, while Figures 1, 2, and 3 show the locations of the apertures (including the NGC 891 apertures from RWB) on H images of the three galaxies, as well as the overlapping long slits discussed above. For NGC 891, the new observations were made at locations in the halo of NGC 891 centered at a height of approximately kpc (hereafter “east halo” and “west halo” pointings) on opposite sides of a location in the disk at 100 from the center of the galaxy. The reconstructed pointings indicate that the actual slit centers were at heights of 2.0 and 1.9 kpc on the east and west sides, respectively. The NGC 5775 halo pointing is at kpc on the SW side of the halo. Three locations in the disk below were observed (since a pointing NW of the disk position directly underlying the halo position would include the nucleus and thus perhaps not be representative of the disk, both additional disk pointings are toward the SE). For NGC 3044, our two halo pointings are at heights of 0.7 and 1.2 kpc from the disk on the NE and SW sides, respectively, and three disk locations were also observed.
Because of the bright infrared background, separate sky observations are necessary for IRS exposures of faint emission, particularly when the emission is expected to fill the slit. These were performed contiguously with the target observations, using an exposure time equal to that of the halo observations for each galaxy.
The data were processed through versions S17.2 (NGC 5775), S18.1 (NGC 891) and S18.5 (NGC 3044) of the IRS reduction pipeline, providing the Basic Calibrated Data (BCD) products. Post-BCD processing was carried out according to the Infrared Spectrograph Data Handbook Version 2.0. Charge accumulation can be present in long integrations, evidenced by steady increases in the signal, but no significant effect was found in our data. “Rogue” pixels were cleaned using the contributed IRSCLEAN_MASK software. For each of the AORs listed in Table 2 and for each nod, the 2-D spectra were averaged using sigma-clipping at the 3 level. For each galaxy, the resulting sky spectra for both nods were averaged and subtracted from all target observations. All remaining extreme pixels not removed by IRSCLEAN_MASK were replaced with averages of adjacent pixels in the sky-subtracted spectra.
One-dimensional spectra were extracted (and calibrated based on standard star observations) with the package SPICE (version 2.2), using the full aperture width. Note that, due to slit loss correction uncertainties, the flux calibration is only fully accurate if the source is uniformly bright and covers an area much larger than the slit. In practice, our sources usually show some gradient across the slit (at worst a factor of 3 for the NGC 3044 halo pointings; the halo pointings of NGC 891 also show a significant gradient at about the 30–50% level). However, for the most part we can argue that the flux corrections are either minimal or accounted for in the scatter of our derived values. The two halo pointings for NGC 891 yield similar fluxes, and our main conclusions hold regardless of the scatter between these pointings (the same is true of the data in RWB). For NGC 5775, the three disk pointings also show similar fluxes, especially for the PAH features, which have a typical dispersion of 5% from pointing to pointing. This value may serve as a reasonable upper limit for slit loss correction variations given the contribution from real structure in the disk and other sources of error. We therefore assume fluxes from our halo pointing are also not significantly affected by slit loss uncertainties. For NGC 3044, apart from such uncertainties, our results are unfortunately compromised by what we assume is a large degree of real variation in the disk pointings.
A final spectrum for each pointing was formed by combining the resulting 1-D spectra for each AOR and nod. As the spectral orders overlap, the ends of each order were removed from the final spectra. The spectra are shown in Figures 4, 5, and 6.


As in RWB, we checked that the fluxes in our halo pointings cannot be due to disk emission convolved with the PSF of the IRS SH module using the Spitzer contributed software STINYTIM. In all cases, such a contribution from disk emission to the halo fluxes is negligible compared to the measured values.
Line intensities and EWs were measured with the IRAF111IRAF is distributed by the National Optical Astronomy Observatory, which is operated by the Association of Universities for Research in Astronomy, Inc., under cooperative agreement with the National Science Foundation. program splot by summing pixels over the line extent and subtracting a linear baseline. We compute error bars on intensities and EWs following RWB, taking into account noise in the spectra and the estimated uncertainties in the flux scale of IRS data, as described in the Infrared Spectrograph Data Handbook Version 3.1. Random noises measured around the relatively flat continuum at 15 m wavelength range from about 1 mJy for the disk pointings to 0.07 mJy for the NGC 891 halo pointings.
We identify the following stronger PAH features and give in parentheses the wavelength range used to estimate their fluxes and and to define a linear continuum for the EWs: 11.2 m ( m), 12.0 m ( m), 12.7 m ( m), 16.5 m ( m), and 17.4 m ( m). Weaker features are also seen in some cases at 13.6, 14.3 and 15.9 m. All of these features are commonly seen in galaxies (e.g., Smith et al. 2007). The spectra from RWB were also reanalyzed to ensure that all features were measured in a consistent way.
Defining the continuum for these PAH features is difficult and in some cases the “continuum” values may include blended emission from discrete features. It may therefore be instructive to consider an EW which minimizes this possible contamination. Hence, we also consider EWs of the combined 11.2, 12.0 and 12.7 m and weaker 13.6 and 14.3 m complexes using a linear continuum from 10.8 to 14.5 m, and the combined 17 m complex using a linear continuum from 16.3 to 17.7 m. Spectral decompositions of low-resolution IRS spectra suggest that the emission in these two wavelength ranges is dominated by discrete PAH features (e.g., Smith et al. 2007), while the ranges used for continuum are indeed essentially free of discrete features. Even for this type of EW, however, there is concern that the 10.8 m continuum may be lowered by silicate absorption centered at 9.7 m (e.g., Chiar & Tielens 2006). We will discuss the effects of extinction in general on our results below. Just as importantly, even the “continuum” in the SH band is probably due to single-photon PAH heating: Draine et al. (2007) conclude this to be the case for 16 m emission observed in SINGS galaxies with the “blue peak-up” array of the IRS.
3 Results
3.1 Ionized Gas Phase Emission Lines
We detect [Ne II] 12.81 m, [Ne III] 15.56 m, and [S III] 18.71 m in all pointings. Line intensities and ratios are presented in Tables , along with upper limits on [S IV] 10.51 m emission.
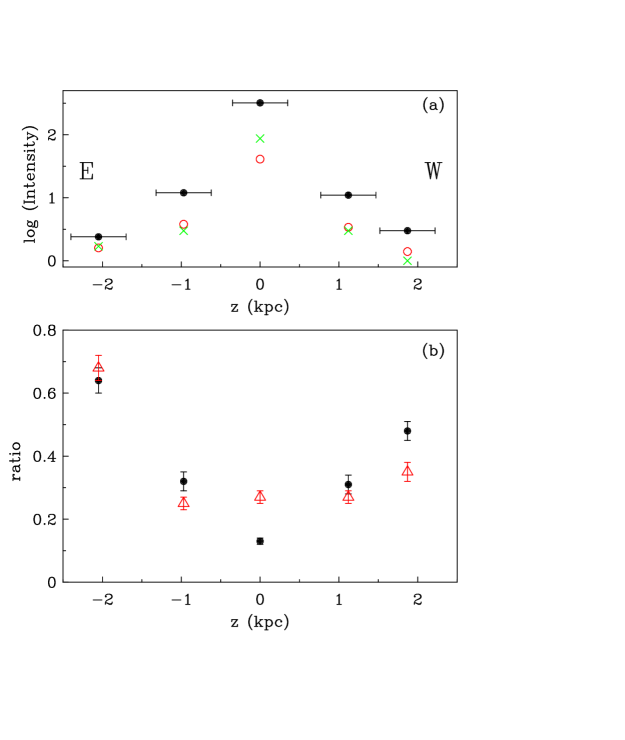
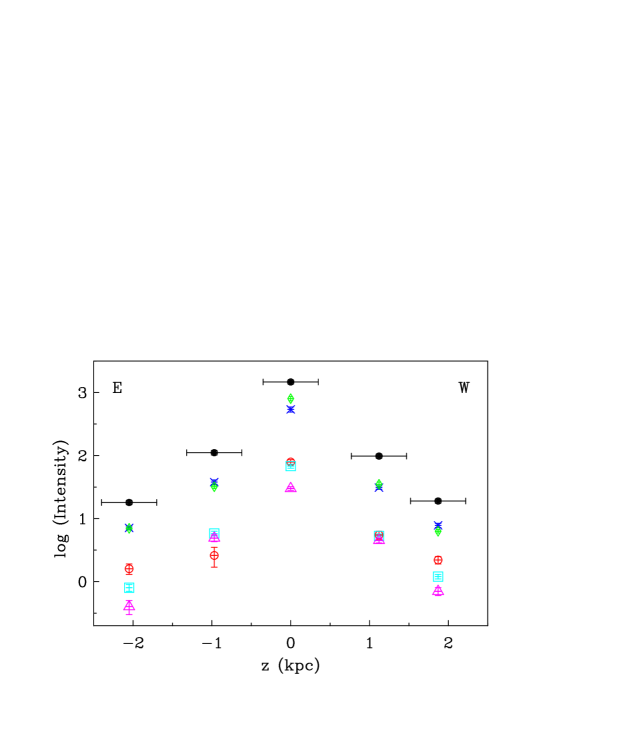
The data for NGC 891 also warrant a graphical presentation. [Ne III], [Ne II] and [S III] intensities for NGC 891 from the current data and RWB are plotted in Figure 7a while Figure 7b shows [Ne III]/[Ne II] and [S III]/[Ne II] ratios. The falloff of intensity with is not well described by an exponential for some lines. Nevertheless, we report equivalent exponential emission scale heights in Table 10 and plot them in Figure 8 (error bars reflect the scatter in the data on the two sides of the disk) to give a sense of the vertical extent of the emission. The key result is that the trend of rising [Ne III]/[Ne II] for this galaxy found by RWB is continued by the kpc pointings. The near constancy of [S III]/[Ne II] reported by RWB, however, is only continued in the east halo pointing at kpc; the value in the west halo is significantly higher. This is somewhat surprising given the similar ionization potentials of S++ and Ne+.
For NGC 5775, there is a small but significant (at about the 5 level) [Ne III]/[Ne II] contrast between the three (remarkably consistent) disk and one halo pointings. The equivalent exponential emission scale heights for the three lines are listed in Table 10 and plotted in Figure 8 (error bars reflect the scatter in the disk values). For NGC 3044, the disk and halo pointings show a tremendous amount of scatter for the intensities and both line ratios, precluding any trends from being seen.

As in RWB, we crudely estimate the effects of extinction at the positions of our midplane pointings on the above results based on CO and HI observations and assuming Galactic extinction properties. There are many assumptions in this calculation, including the conversion from CO intensity to H2 column density, the gas-to-dust ratio, and the near-IR extinction law. Resolution mismatches between these maps and the IRS SH observations are also a source of error. For NGC 891, we use the same gas column densities as in RWB. For NGC 5775, we use SEST CO 1–0 and uniformly-weighted VLA HI maps from Lee et al. (2001), with the caveat that the CO map has a relatively low angular resolution of 43” (the resolution of the HI map is 13.5”). For NGC 3044, we use the uniformly weighted VLA HI map from Lee & Irwin (1997) at about 21” resolution, and (kindly provided to us by J. Irwin) the CO 2–1 map from Lee (1998) at 21” resolution, along with an average CO 2–1/1–0 ratio of 0.41. We convert CO intensities to H2 column densities assuming a conversion factor of mol cm-2 (K km s-1)-1, as used by Scoville et al. (1993) for NGC 891. With these assumptions, we estimate total gas column densities at the position of our central disk pointing in each galaxy.
From these column densities, we estimate the midplane extinction at a representative wavelength of 15 m, making the same assumptions as in RWB: the Galactic relation between gas column density and (Bohlin, Savage, & Drake 1978), the standard Galactic extinction law to relate to (e.g., Draine 2003), and an approximate relation from Milky Way observations by Rosenthal et al. (2000) and Jiang et al. (2006) [although the model of Weingartner & Draine (2001) for indicates a value closer to 0.2]. We also assume that the dust and emitting gas are well mixed and thus only half of the dust lies in front of the gas on average. For NGC 891, we estimate a midplane extinction at 15 m of 0.5 mag, which supercedes the value reported by RWB. For NGC 5775 we find a value of only 0.12 mag, and for NGC 3044 the extinction is negligible. Since these values are subject to such large uncertainties, they can be little more than illustrative. For the extinction curve of Rosenthal et al. (2000), extinction should be about 50% higher at 17 m, and perhaps 100% higher at m, due to silicate absorption at 9.7 and 18 m. These midplane extinctions are also likely to be lower limits given the low resolution of many of the CO and HI observations. It may well be that the bulk of the molecular and atomic gas is in unresolved layers for many of these maps. However, given the lack of observations of sufficiently high resolution, we do not attempt to quantify this possibility here by making any assumptions.
A midplane extinction of 0.5 mag, more appropriate for NGC 891, reduces scale heights by 30%, while a value of 0.1 mag, more appropriate for NGC 5775, reduces scale heights by 8%. For the aforementioned infrared extinction curves, extinction for the [Ne II] and [Ne III] lines should be comparable and therefore line ratios should not be signficantly affected. Extinction for the [S III] line may be somewhat higher.
3.2 PAH Emission Features
Tables 3, 5, 7 and 8 show the intensities and EWs of PAH features for the three galaxies, as well as the intensity integrated over the most feature-free spectral range, m, which we refer to as the 15 continuum. Intensities for the 11.2 m feature include the secondary peak at about 11.0 m. EWs of the combined features discussed in §2 are also listed, and are hereafter referred to as EWshort and EWlong. For the NGC 891 pointings in RWB, EW and , EW and , and the 15 m continuum intensities are , and (all in units of 10-17 erg cm-2 s-1 arcsec2) for the disk, east halo at kpc and west halo at kpc, respectively. The spectra allow us to characterize the vertical distribution of PAH and continuum emission and to search for general differences of PAH emission properties between disks and halos.
The rather large scatter in PAH feature brightness in the disk pointings of NGC 3044 preclude meaningful statements about the vertical distribution of emission. Hence we focus on NGC 891 (where the GTO spectra discussed by RWB confirm that our disk pointing is representative) and NGC 5775, where the three disk pointings show a very small scatter in PAH emission. Figure 9 shows PAH and 15 m continuum intensities vs. on a logarithmic scale for NGC 891. Most features can reasonably be described by exponential distributions; and results of exponential fits to the east and west sides separately are presented in Table 10 and Figure 8. Scale heights range from 430 to 530 pc for PAH features (with an average of pc, the error accounting for the dispersion of the ten values in Table 10), similar to the range reported in RWB, while the 15 m continuum has scale heights of 440 pc and 380 pc for the east and west sides, respectively. Hence, we have a hint that PAH emission is more vertically extended than the continuum emission, although the uncertainties are large. The EW analysis below will strengthen this conclusion. Table 10 and Figure 8 also show scale heights for NGC 5775, assuming an exponential distribution. For these, intensities for the three disk positions have been averaged, and the error bars on the scale heights reflect the scatter and the average uncertainty of the three measurements. Here, the scale heights are much larger than in NGC 891, ranging from 720 to 1080 pc. But within each galaxy, PAH scale heights are similar, given the error bars.
Extinction will lower scale heights as described above for the gas lines. Scale heights of the 11.2 and 17.4 m features are likely to be reduced more by extinction than those of the other features.
The PAH emission scale heights in NGC 891 with no extinction correction are larger than that of the CO-emitting gas layer, which has a FWHM of 225 pc (Scoville et al. (1993)). The HI layer is modeled by Oosterloo, Fraternali, & Sancisi (2007) as thin and thick exponential layers with scale heights increasing with radius from to 0.5 kpc for the former and 1.25 to 2.5 kpc for the latter, which contains 30% of the gas. Hence, the PAH emission scale heights are clearly larger than the CO scale height and are perhaps more comparable to that of the thin HI layer, with or without our extinction correction. For NGC 5775, Irwin (1994) finds an exponential scale height of 1.1 kpc for the HI, while the molecular layer thickness is presumably substantially less but is not well known. So again, it is probably the case that the PAH scale heights are comparable to or somewhat less than that of the HI layer.
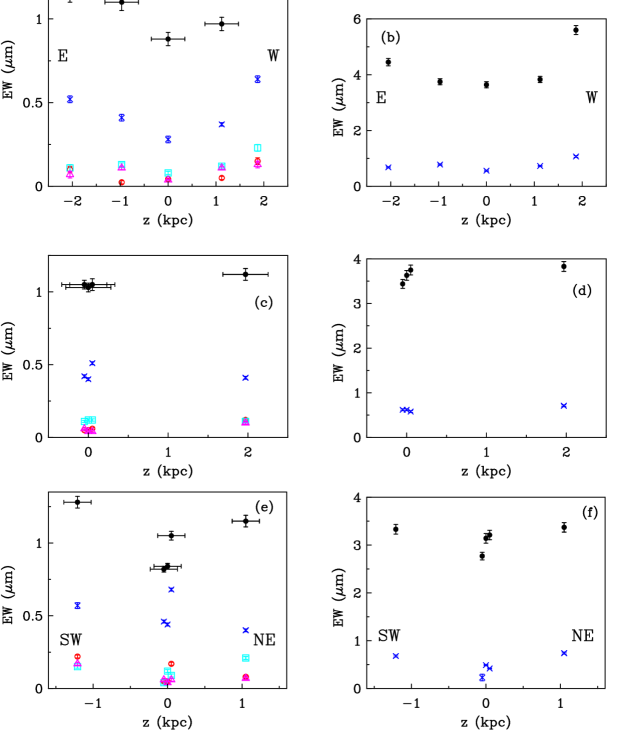
More significant results can be extracted from the EWs. These are not sensitive to any possible extinction contrast between disk and halo, although individual values may be affected by the shape of the extinction curve. Also, for NGC 3044, while intensities show much scatter among the disk positions, the EWs are more consistent. Figure 10 shows EWs of the five bright PAH features, and EWshort and EWlong, plotted as a function of for NGC 891, NGC 5775 and NGC 3044, respectively. These figures make it clear that, for most features (all five in Figure 10a, three of five in Figures 10c and 10e, and all in Figures 10b, 10d and 10f), EWs are higher in the halo than in the disk, no matter which way they are measured. Note that for NGC 891 this conclusion differs from that in RWB, where a significant disk-halo EW contrast was found only for the 17.4 m feature. We attribute this difference to the more careful EW measurements in this work. Given the scatter among galaxies, no feature stands out here as having a significantly higher disk-halo EW contrast than others.
3.3 H2 Emission
The H2 S(1) 17.03 m line is detected in all pointings. H2 mid-IR emission lines arise from rotational excitation in warm gas. Such emission is usually attributed to PDRs (e.g., van Dishoeck 2004) but may also arise in shocks (e.g., Neufeld et al. 2006). Scale heights for best-fit exponentials are given in Table 10 and plotted in Figure 8. For NGC 891, the values of 550 and 580 pc are somewhat higher than found by RWB without the kpc data points. Again, the scale height in NGC 5775, 850 pc, is significantly larger. Extinction (see above) may lower these values somewhat. Like the PAH features, these scale heights are comparable to the HI scale heights in both galaxies. It is difficult to interpret these results in terms of column densities of infrared-emitting molecular hydrogen from only one spectral line. A full analysis would require several rotational transitions to be observed so that excitation temperatures and ortho-para ratios could be modeled (e.g., Brunner et al. 2008; Roussel et al. 2007; Neufeld et al. 2006). Nevertheless, the discovery of emission from H2 with scale heights in the range pc suggests a molecular gas component with a surprisingly large vertical extent. We do note, however, that there have been indications of a faint, vertically extended CO emitting component in NGC 891 (Garcia-Burillo et al. 1992; Sofue & Nakai 1993). Again the greater scale height in NGC 5775 suggests that disk-halo flows are somehow responsible for this vertical extent.
4 DIG Photo-ionization modeling
As stated in §1, the [Ne III]/[Ne II] ratio provides an excellent diagnostic of ionization as it is relatively free of effects of extinction, gas temperature and gas abundances that can complicate interpretation of common optical line ratios. The extraplanar pointings at kpc on either side of the plane of NGC 891 continue the trend of rising [Ne III]/[Ne II] with found by RWB. There is a significant but much smaller rise in NGC 5775, while scatter in the ratio prevents any trend from being observed in NGC 3044. All values of the ratio in DIG range from about 0.1 to 1. A similar trend is seen in M82 by Beirão et al. (2008), with values increasing from about 0.15 in the disk to a high of 0.27 a few arcseconds above the disk.
These results indicate a higher ionization state in the halos of these two galaxies, confirming what had been suggested by the more problematic [O III] line (Collins & Rand 2001). For what follows, we focus on NGC 891, where we have by far the most information on halo line ratios. In addition to [Ne III]/[Ne II] values, Figure 11 shows the dependence with height of [N II]/H, [S II]/H, [O I]/H, [O III]/H, and He I /H (a relatively clean optical diagnostic of ionization, for which extinction is the major concern and the faintness of the helium line the major challenge) along a slit running through nearly all of our IRS pointings (as shown in Figure 1). The optical data are from Rand (1997) and Rand (1998b).

We wish to understand what sources of ionization can explain these behaviors, with particular attention paid to the constraints provided by the neon ratio.
Our main focus in this paper is on stellar photo-ionization, but by necessity we attempt to broaden the parameter space heretofore considered in ionization models in general. We take two approaches. We begin by using the CLOUDY code (Ferland et al., 1998) to ask, independently at each height of 0, 1 and 2 kpc, whether there are any combinations of radiation temperature, ionization parameter, and gas temperature that can reproduce the observed ratios (§4.1). By simply exploring this parameter space, we temporarily set aside the issue of whether any solution corresponds to a reasonable physical or “structural” model - that is, we do not try to explain why there might be changes in radiation temperature with , or what balance of heating and cooling may lead to a certain gas temperature. However, the difficulty encountered in previous modeling, even before the strong constraints provided by the infrared lines were available, suggests that this naive approach is a useful way to constrain what kinds of physical models may be viable.
Before turning to physical models, we make several remarks about shocks (§4.2). Although standard shock models in combination with photo-ionization have been explored to explain the optical line ratio behavior in the DIG of several edge-ons (see §I), we point out the difficulty in applying such models to halo environments, and that our approach offers a more feasible way of considering them.
In considering secondary sources of ionization, we have been partly motivated by the possibility of a second, hot, vertically extended source of photo-ionization as a way of producing a rising [Ne III]/[Ne II] ratio with . Indeed, our CLOUDY results will give us further motivation to consider such a source. As an illustration of such a physical model, in our second approach (§4.3) we will then turn to the Monte Carlo photo-ionization code described in Wood & Mathis (2004) and employed in RWB, adding such a component to the thin layer of massive stars we considered in that paper. This code is well suited to exploration of additional stellar sources. Our CLOUDY results will open up a broad range of parameter space to consider in such models, and it is beyond the scope of this paper to explore fully this parameter space - hence we restrict ourselves to a few illustrative cases.
4.1 Line Ratio Constraints on Physical Conditions vs. Height in NGC 891
The increasing level of ionization in the gaseous halos indicates an increase in the ionization parameter, the hardness of the radiation field, the gas temperature, or a combination of all three. One difficulty in explaining the observed emission lines lies in the fact that at any given height there is a range of densities. There is also quite probably a range of temperatures, either due to variation in photoionization heating or the presence of other forms of dissipational heating, such as shocks, turbulence, cosmic rays, or magnetic reconnection, that are expected to become important at low densities. It is therefore to be expected that it will be difficult to match the observed ratios with a single model. Uniform density models seem likely to fail, and models with a priori density variations would have to guess the right combinations of density variations to match all the line ratios. Past attempts at photoionization modeling have confirmed that it is challenging to match the observed emission lines.
With several measured line ratios, particularly in the halo of NGC 891, this problem is overdetermined. In this subsection, we use these line ratios to try diagnose the local physical conditions in the gas as a function of height, independent of any model to produce these physical conditions. In an ideal situation, in which one density/temperature phase dominates the observed emission, one set of physical parameters would match all the line ratios simultaneously. Although some line ratios remain problematic, we find that four key line ratios can be matched simultaneously and yield a change of physical conditions versus height that is physically plausible.
We have used the photoionization code CLOUDY v8.0 for a solar metallicity gas to calculate how measured line ratios in the gaseous halo of NGC 891 vary as a function of three parameters: the ionization parameter, , the “radiation temperature” (for convenience we parametrize the spectral shape with a blackbody spectrum), , and the gas temperature, . The ionization parameter is defined in terms of the plane-parallel flux of photons with energy greater than 13.6 eV, , the speed of light, , and the particle density of hydrogen atoms, . The ionization parameter and blackbody temperature determine the photoionization rate of the different ions by specifying the flux and spectral shape of the radiation field. An absorbed stellar flux or spectra from X-ray emitting gas could also be used.
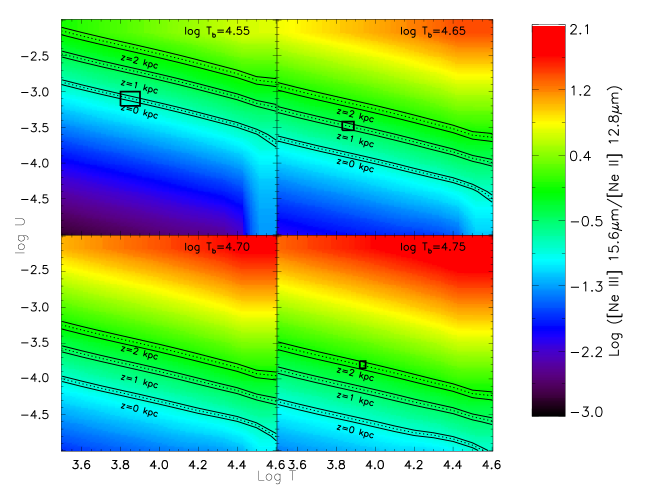
Figure 12 shows how the [Ne III]/[Ne II] ratio varies as a function of these three parameters. In the range of parameters space that we considered, this ratio spans five orders of magnitude! With the relatively small uncertainties in the measured line ratio at each of the three heights, a thin sheet of the three-dimensional parameter space is allowed. To go from the ratio observed at kpc to that observed at kpc, holding two of the three parameters fixed, would require a whopping 1.25 dex () increase in the gas temperature, a 0.7 dex () increase in ionization parameter, or a modest 0.1 dex () increase in blackbody temperature. The relative insensitivity of this line ratio to gas temperature, which only occurs because of the temperature dependence of the recombination rates, makes it a key diagnostic.
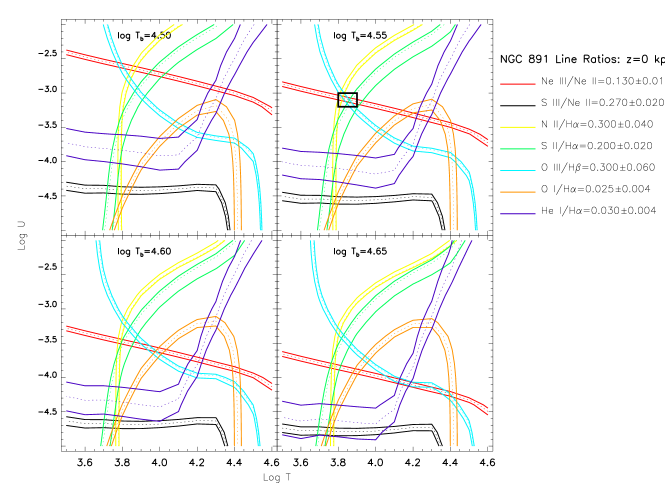
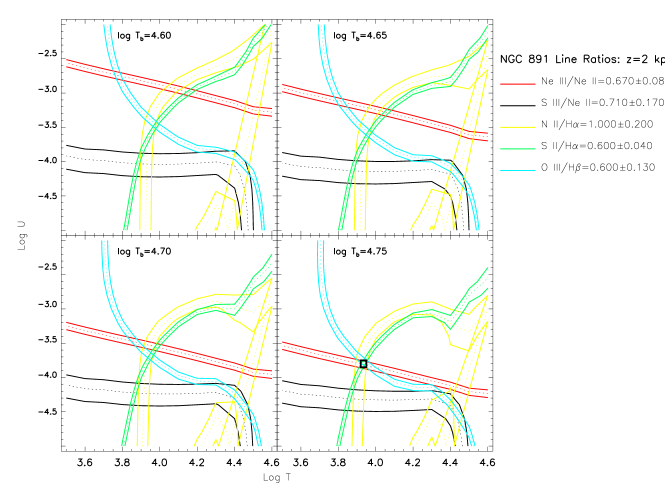
Incorporation of the other observed gas line ratios produces equivalent slices through parameter space, most of which have a stronger gas temperature dependence. The allowed parameter space based on measured line ratios at , 1, and 2 kpc are shown in Figures 13-15. The ratios [S II]/H and [N II]/H behave similarly, requiring a higher gas temperature to match the observed data as the ionization parameter increases. [O III]/H, on the other hand, has the opposite behavior, requiring lower gas temperature as the ionization parameter increases. The intersection point of these three ratios already identifies a very limited section of parameter space. With the addition of the infrared [Ne III]/[Ne II] ratio, the problem becomes over-determined. The fact that the parameter space allowed by the intersection point of these optical line ratios (as well as He I/H at kpc, although the uncertainties are relatively large) also agrees with the [Ne III]/[Ne II] is suggestive that one type of gas, with a unique set of physical conditions, dominates the observed emission. (We will address the remaining ratios shortly.)
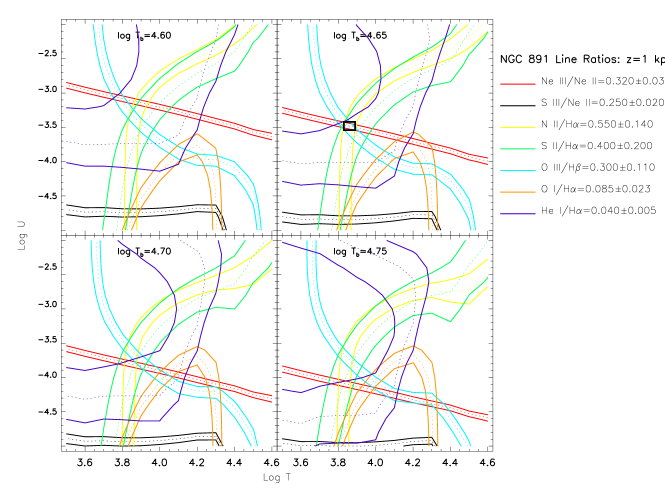
Although the intersection of these four line ratios in parameter space is not perfect for kpc, it is satisfactory given the uncertainties in the abundances for NGC 891. And for and 2 kpc, it is possible to identify a unique set of parameters that simultaneously match all four line ratios (and He I/H at kpc). The derived parameters, as a function of height, are given in Table 11 (the 1 uncertainties define a volume in parameter space – the quoted uncertainties are those projected onto each axis). This table also gives the derived value for the (plane-parallel) flux of hydrogen ionizing photons, , normalized to a density of . Since these values are derived solely from the line ratios, it is possible that non-physical values could have been obtained, and yet they seem plausible. First they indicate a drop in ionization parameter by a factor of five over a distance of 2 kpc (despite the increasing level of ionization). When converted to a flux of hydrogen ionizing photons, it indicates an incident flux at kpc of , where . If we assume a constant density, only 41% and 20% of the incident flux reaches kpc and 2 kpc, respectively. Using a representative gas density scale height of kpc (see RWB) and a fixed filling factor, these decrease to 27% and 8% of the incident flux at kpc and 2 kpc, respectively. Both the total photon flux and the order of magnitude attenuation are comparable to what is observed in the Galactic warm ionized medium, which has a total flux of hydrogen-ionizing photons of at kpc (Reynolds, 1990) and well above the plane, based on the measurement of H emission from high velocity clouds (Tufte et al., 2002). The values obtained for the Galaxy were obtained by measuring the H flux and not from any line ratio information. It is encouraging that two different techniques yield such similar numbers for two galaxies.
Over the same distance, the derived gas temperature in the halo of NGC 891 increases by 20%, from K to K. This modest increase is also consistent with the increase in gas temperature that has been claimed for the Milky Way by Reynolds, Haffner, & Tufte (1999), who pointed out that this might be evidence for a non-photoionization source of heating at low densities. One test of this temperature gradient in edge-on systems would be a detection of the faint [N II] 5755 Å line, as the ratio of this to the brighter [N II] line is an unambiguous temperature diagnostic (Reynolds et al., 2001). So far, only 2 upper limits on the temperature in the DIG halo of NGC 891 of 13,000 K and 10,000 K on the east and west sides, respectively, have been set from the very sensitive spectrum of Rand (1997). However, another way of estimating the gas temperature, based on the [N II]/H ratio (Haffner et al., 1999), and applied to NGC 891 (Collins & Rand, 2001), also suggests a rise in gas temperature consistent with the derived rise here within the errors.
The most surprising result of our parametrized approach to constraining the physical conditions is the required hardening of the radiation field. Parametrized as a blackbody temperature, this is a 58% increase, from 36,000 K to 57,000 K. This change cannot be explained by the radiation hardening expected as the photoionizing flux from the base of the halo loses lower energy photons as the radiation percolates upward (RWB). Some additional source of ionizing radiation with a hard spectrum is needed. However, this source of radiation must not produce too much thermal heating of the gas, nor may it exceed the constraints on the ionization parameter. In §4.3, we explore one such possible source.
It is fortunate that this approach, with three parameters, can match four or five line ratios simultaneously, but what about the ratios we have neglected so far? Of the three remaining ratios, the most challenging problem is to match the rising [O I]/H at the same time that [O III]/H is also rising. In general, [O I] emission is thought to trace of the neutral phase. The neutral oxygen fraction is ”locked” to the neutral hydrogen fraction by charge exchange, but the gas must also be hot enough to excite the optical line emission. For that reason, it has generally been assumed that [O I] should trace regions of low or partial ionization, in particular the warm boundaries of neutral clouds (Reynolds et al., 1998).
Figures 13-15 make it clear that to match both this line ratio and [S III]/[Ne II], while still maintaining the same values for [S II]/H and [N II]/H, requires an ionization parameter of or . If we were to assume a two-phase medium with identical gas temperatures and irradiating spectral shape, this would require a density ratio of 32 and 20 at kpc and 1 kpc, respectively. These are plausible density contrasts for a two-phase interstellar medium (Wolfire et al., 2003). However, this assumes that the H and [O I] emission regions are co-spatial. Reynolds et al. (1998) argue that in the Galactic warm ionized medium most of the H emission arises in a different physical region than the [O I] emission. This would increase the [O I]/H ratio in the [O I] emitting zone, requiring a different set of parameters. (For a fixed temperature and radiation temperature, this would yield an even lower ionization parameter.)
In a future study we will see if a two-phase or multi-phase combination can be constructed to match all of the emission line ratios. This will include the line ratios considered here as well as the increasing [O II] 3727 Å/H emission observed in edge-on spirals (Otte et al., 2001) – including along the same slit location in NGC 891 as considered here – as well as the Galactic WIM (Mierkiewicz et al., 2006).
4.2 On Shocks
It has also been suggested that shocks may play a role in increasing the ionization level with height (e.g. Rand 1998b, Collins & Rand 2001, Miller & Veilleux 2003). Although it is well established that the power requirements to maintain these ionized layers can only be supplied by stellar radiation, and not, for example, the mechanical input of supernovae shocks (Reynolds, 1990), this does not preclude the possibility of shocks altering the line ratios in the lower density, high gas where the power requirements are much reduced. Shocks, of course, are just one example of non-photoionization heating, where the kinetic energy of gas is converted to thermal energy and radiation. Other possibilities include turbulence (kinetic energy thermal energy + radiation), magnetic reconnection (magnetic thermal energy + radiation), and cosmic-ray heating (particle kinetic energy thermal energy + radiation).
In a standard plane-parallel shock model, the optical line emission originates in three distinct zones (Dopita & Sutherland, 1996). First, there is the non-equilibrium cooling zone. As the gas behind a shock front cools, it passes through the different ionization stages, where the ionization level is set by the gas temperature and by photoionization from the radiation produced by the hotter gas closer to the shock front. However, frequently the cooling is faster than the recombination and the ionization level is no longer in equilibrium. Ions with the highest ionization potential are the most likely to be produced in this zone. The second relevant region is the photoabsorption zone. For a strong shock, the gas is compressed by a factor of four by the shock front. As it cools, it compresses further, where the amount of compression depends on the relative importance of thermal and magnetic pressure. When the gas reaches K, it reaches a plateau in temperature until all of the ionizing flux produced in the post-shock gas has been absorbed. Since this zone is compressed, and irradiated by an extreme ultraviolet or X-ray flux, it usually dominates the optical line emission from the shock front, with emission line ratios distinctly different from standard H II regions. For example, [Ne III] is enhanced relative to [O III] by a factor of 6 in shocks (Dopita & Sutherland, 1996). The third region is the ionized precursor. Radiation from the post-shock gas streams in front of the shock, ionizing the low density pre-shock medium.
There are two reasons why it is difficult to compare standard shock models to data on low density halos. First, these models are usually calculated in the absence of an external radiation field. Since the bulk of the emission for most of the optical/infrared lines tends to come from the photoabsorption zone (due to the higher emission measures), the halo radiation field must also be added self-consistently to the radiation emitted by the post-shock gas. For example, in the low density conditions of the halo, this photoabsorption zone may never fully recombine.
The second difficulty is that at the low densities of the halo, the physical thickness of the shock increases to the point that the plane-parallel approximation becomes inappropriate. In can be shown that the emergent hydrogen ionizing photon flux is proportional to the particle flux through a plane-parallel shock front, , where is the shock speed, and is the pre-shock density. The dimensionless efficiency factor, , depends principally on the shock speed and modestly on the amount of compression allowed by the magnetic field in the post-shock gas. This factor ranges from 3 to 12 for shock speeds between 150 to 300 (Benjamin, 1994). This allows us to estimate the length of the precursor zone and the photoabsorption zone by assuming the ionizing photon flux incident on each zone is balanced by the recombination in a gas column, , where is the gas temperature in units of K, is the shock velocity in units of , is the hydrogen recombination rate, and is the hydrogen density in the irradiated gas in units of . We see that for reasonable halo parameters, the thickness of the precursor zone can exceed the thickness of the entire ionized layer. For this reason, many shock model predictions exclude the contribution of the precursor. The thickness of the photoabsorption zone will be reduced by the compression factor experienced by the post-shock gas, typically by a factor of 4 to 400. The compression depends principally on the magnetic field in the post-shock gas.
Because of the certain presence of the external radiation field, and the fact that the bulk of the optical line emission in shocks is reprocessed flux from the post-shock gas, our previous approach of parametrizing the emission as a function of temperature, ionization parameter, and spectral hardness is still appropriate. However, the spectral shape will be much different than the blackbody flux that we have used. In principle, we could repeat the analysis in the previous subsection, replacing the blackbody spectrum with the spectrum emergent from shock-heated gas combined with the background stellar flux, and we will consider this in future work. This would require the incorporation of (at least) two additional free parameters, the shock velocity/post-shock temperature and the flux level of ionizing photons.
4.3 Illustrative Physical Models for NGC 891
In RWB we used the Monte Carlo photo-ionization code described in WM to attempt to understand whether the rise of the neon ratio with in NGC 891 found in our Spitzer Cycle 2 data could be explained by photo-ionization due to massive stars in a thin disk. We also considered the runs of the optical line ratios shown in Figure 11. The details of the models are presented in RWB, therefore we emphasize here only a few of the most important features. Stars of temperature 40 kK, 45 kK and 50 kK were considered, with a total luminosity of 1051 ionizing photons per second, although one model considered a luminosity four times higher. While our standard models place the stars in a diffuse gas density structure (based on observations of NGC 891), one model also considers the effects of spectral hardening by denser gas around the stars - this involves passing the radiation field through a spherical gas distribution whose size is set to allow 15% of the ionizing photons to escape.
Our main result was that no model could reproduce the rise of [Ne III]/[Ne II] with z, with values of this ratio being generally overpredicted. The models did a better job in reproducing the observed runs of [S II]/H and [N II]/H, but could not produce a rising [O III]/H as observed, predicted too low values of [O I]/H, and could not match the values of He I/H.
The additional data on NGC 891 presented in this paper and the above exploration of parameter space in photo-ionization scenarios with CLOUDY show that the situation will not change – a thin disk of hot stars will not suffice. Instead they suggest that we vary the distribution of ionizing sources, such that gas at higher is ionized primarily by sources that have, in the mean, harder spectra. Here we focus on such a source which is well suited to modeling by the Monte Carlo code by adding a secondary, hot stellar ionizing source with a vertically extended distribution.
Our goal here is simply to present some illustrative models showing parameters for such a component (temperature, scale height, fraction of ionizing photons contributed) that, when added to our previous models, can approximately match the neon ratio behavior, rather than to perform an exhaustive search of parameter space. The first reason for this limited approach is that there are many possible ways in which the parameters suggested by our CLOUDY models could be incorporated into a physical model, not all of which may have a well-motivated physical explanation. Second, while we can find motivation for including the second source in several candidate types of stars based on Milky Way studies, information is scarce concerning their potential effectiveness as contributors to the ionization, and virtually non-existent regarding their distribution in NGC 891. Hence, our problem is not well constrained.
Hot sources in the Milky Way that may have a larger vertical extent than the main massive star layer include sdO and sdB stars, post-AGB stars, young white dwarfs, and runaway O stars. We return to the viability of each of these candidates after we present the modeling results. However, we do note here two related contexts in which such sources have been considered: Binette et al. (1994), Taniguchi, Shioya, & Murayama (2000), and Stasińska et al. (2008) have explored possible importance of hot post-AGB stars and planetary nebula nuclei in explaining high [O III]/H and [N II]/H ratios in Seyfert and LINER spectra, while Annibali et al. (2010) and Sarzi et al. (2010) have considered the importance of post-AGB stars for ionization in elliptical galaxies.
Instead of the point-source geometry for the ionizing sources considered in RWB, here we use plane-parallel distributions. The massive stars occupy an infinitely thin layer, while an exponential describes the vertical distribution of the secondary component. We simulate a disk area of 4 kpc by 4 kpc. For the massive stars, we only consider a temperature of 30 kK, and do not consider leakage. For the second component, we focus on hot, evolved, low mass stars and use stellar spectra from the Tbingen NLTE model atmospheres (e.g. Rauch et al., 2009). We consider 50 kK models with elements from H to Ni, as well as ones with no H (He+C+N+O) to represent He-rich stars such as the sdOs. This choice should give us at least some idea of whether our results are sensitive to composition, which can vary greatly among subdwarf stars, for example (Heber, 2009). The total ionizing luminosity in our models is photons s-1.
Figures 16 and 17 show resulting line ratios for two models where stars with the H-Ni spectra with a scale height of 1 kpc contribute 5% and 7.5% (“HNi5” and “HNi7.5” models) of the total ionizing luminosity, respectively. The extended component has only been included on the positive- side, although it will also slightly ionize the opposite side as the emission is isotropic. First, we note that almost all line ratios show a sharp spike or dip in the midplane which is not seen in the data. This is a consequence of the idealized nature of the models, where the midplane line of sight passes through the center of the ionized structure. Real lines of sight in the midplane presumably sample a range of such impact parameters, and should therefore reflect some mix of DIG and HII regions. Hence, we do not expect to match ratios correctly within the star forming layer.


At and 2 kpc, these models bracket the observed neon line ratios seen in NGC 891. Varying the contribution from the extended stellar component has little effect on the behavior of [Ne II]/H with height, but greatly affects the behavior of [Ne III]/H (we do not report these ratios for the data mainly because extinction in the infrared and optical lines should vastly differ). Models with scale heights of 0.5 kpc and 2 kpc (not shown) produce, respectively, no rise, and much too steep a rise in the neon ratio off the plane. From this we can conclude that, for this representative temperature of the extended component, the rate of rise of the neon ratio between and 2 kpc is governed mainly by the scale height of these stars, rather than their relative contribution to the ionizing flux. Hence, the only way to reproduce a rising neon ratio with such models is to include a vertically extended ionizing component, as we have done.
Optical line ratios are more difficult to interpret, as already stated – nevertheless, we summarize here how these models fare in reproducing these ratios. Comparing Figures 11, 16, and 17, the HNi5 model produces the rising trend in [O III]/H in the halo with values close to those observed, and comes reasonably close to matching the observed range of values of He I/H of about . In these aspects, the model is much more successful than the ones presented in RWB. However, [S II]/H and [N II]/H, although rising in the model, are now too low compared to the data. The models of RWB were more successful in this regard. [O I]/H is also badly underpredicted, although this was also true for the RWB models. A negative abundance gradient with height will not help the situation: for instance, from the results of WM, [S II]/H and [N II]/H would be further lowered.
The HNi7.5 model, while also producing rising [S II]/H, [N II]/H and [O III]/H ratios, underpredicts the first two even more than the HNi5 model, and overpredicts the third. The behavior of He I/H is similar to that for the HNi5 model.
The He-rich star model (not shown) produces a very similar behavior of the neon ratio to the HNi5 model when such stars contribute 30% of the ionizing flux. Their contribution is necessarily relatively large because the high helium content of the stars’ atmospheres suppresses the neon-ionizing flux significantly. However, this model yields very low [N II]/H () and [S II]/H () ratios that decline with . [O III]/H rises with but is overpredicted, [O I]/H is badly underpredicted, while the behavior of He I/H is similar to that for the HNi5 and HNi7.5 models. We therefore do not consider such models further.
If we focus only on the success of the HNi5 and HNi7.5 models in bracketing the observed behavior of the neon ratio with height, and ignore the problems introduced in matching other line ratios, we can then ask which type of aforementioned hot star could be responsible. The distribution of such stars is unknown in NGC 891, and therefore we can only try to constrain the possibilities based on what is known in the Milky Way. The only information available on the distribution of stars in NGC 891 relative to the Milky Way is very general – thin and thick disk scale heights have been measured for both galaxies – and we end by summarizing these measurements.
Of the various types of hot stars mentioned above, sdO stars may be the most likely in terms of temperature and z-distribution, but have the disadvantage that they tend to be He-rich. These stars have T=40–80 kK, although in a sample of 21 He-rich sdOs, most were found to have T=45–55 kK (Thejll et al., 1994), while in another sample of 33 such stars, most were in the range 38–48 kK (Stroeer et al., 2007). Temperatures for a sample of 13 sdOs with subsolar helium abundances are in the range 35–80 kK (Stroeer et al., 2007). Heights above the plane for the sample of Thejll et al. (1994) are estimated to be 0.4–1.5 kpc, and Thejll et al. speculate that they may form a thick disk or halo population. More recently, Napiwotzki (2008) finds from kinematics of 31 He-sdOs that 41% are in the thin disk, 39% in the thick disk, and 20% in the halo. Their space density is very uncertain. Downes (1986) found a value in the Solar neighborhood of about pc-3, although with a low scale height of pc. If the scale height is indeed 1 kpc, the midplane space density would be reduced. The midplane space density of such stars in our HNi5 model can be derived if we assume that our extended component consists of stars of a typical sdO luminosity of 150 L, based on values from Thejll et al. (1994). We find a value of pc-3. Hence it seems, although information is very scarce, that such an extended component cannot be ruled out on grounds of space density, temperature or scale height.
de Boer et al. (1997) find that the sdB stars also have a large scale height of about 1 kpc, but these stars are certainly too cool to be responsible for the neon line behavior. The Milky Way post-AGB stars in the catalog of Szczerba et al. (2007) are also too cool, with temperatures not exceeding 25 kK. Much hotter post-AGB stars include the PG1159 stars (Green, Schmidt, & Liebert, 1986), which have temperatures of order 100 kK. Only 40 are known (Werner et al., 2008).
A sample of white dwarfs in the Sloan Digital Sky Survey are found to have a scale height of about 340 pc, consistent with several earlier determinations (Harris et al., 2006). These authors also find a possible trend of increasing scale height with decreasing luminosity (and therefore temperature), but the statistical significance is uncertain. Such a trend would naturally be expected because of heating of the disk over time. Nevertheless, it seems that luminous, hot white dwarfs should have a scale height of much less than 1 kpc. If the PG1159 stars are evolving into hot white dwarfs, the same conclusion should apply to them.
Runaway O stars account for of all O stars (Gies, 1987) and form a distribution more vertically extended than the thin disk. However, most have ’s of less than 100 km s-1, so it is difficult to see how they could form a layer with a 1 kpc scale height given their lifetimes. In fact, such stars in the sample of Moffat et al. (1998) are mostly within 200 pc of the midplane. Some B stars are found at greater heights (Allen & Kinman, 2004, and references therein), but again are too cool to be candidates here.
Of course, candidate sources with appropriate temperatures may have a different scale height and volume density in NGC 891. While individual candidate stellar types are difficult to study, the overall stellar disk structure of NGC 891 has been modeled several times, beginning with van der Kruit & Searle (1981), who were the first to report a thick disk. From -band photometry, Morrison et al. (1997) derived scale heights for the thin and thick disks of pc and kpc, respectively, with the thick disk contributing of the surface brightness in the midplane. Xilouris et al. (1998), modeling starlight and extinction from five-band photometry, found a thin disk scale height of 400 pc. More recently, Ibata, Mouhcine, & Rejkuba (2009) found a thick disk scale height of kpc from star counts in HST ACS images. Thin and thick disk scale heights are therefore larger than in the Milky Way, where Jurić et al. (2008) find values of 0.3 kpc and 0.9 kpc from the Sloan Digital Sky Survey. Hence, there may well be an extended distribution of hot, evolved stars in NGC 891, but one cannot currently say more than this.
We conclude from this initial exploration that such a component cannot be ruled out as an explanation for the neon ratio behavior given what is known about the stellar distribution in NGC 891 and the required space density of this component in our models. It also may help explain the [O III]/H and He I/H behavior in this galaxy. However its inclusion does introduce problems with other optical line ratios. As previously mentioned, a more complete exploration of parameter space in such models, including a consideration of non-ionizing heating, may result in a better match to the data for NGC 891, but is beyond the scope of this paper.
Finally, we note that any contribution of a hidden AGN or nuclear super star cluster with a hard spectrum is very unlikely to be a factor in NGC 891. First, the structure of the H halo emission correlates with star formation in the disk, both in the contrast on either side of the minor axis, and on the scale of individual filaments (Rand, 1998a). Second, in a slit running parallel to the disk at a height of 700 pc in the DIG halo, [N II]/H, [S II]/H, and [O I]/H all anti-correlate with H halo intensity, dropping at the location of filaments (Rand, 1998b). These results imply a strong connection between line ratios and disk star formation, with no indication of a contribution from a nuclear source.
5 Discussion of PAHs
Our main results for PAH emission scale heights are as follows. First, the scale heights (depending on extinction) are many hundreds of pc. This result adds to the growing evidence for vertically extended PAH distributions in galaxies (e.g., Engelbracht et al. 2006; Beirão et al. 2008; Howk 2009). Specifically for these two galaxies, in the IRAC 8 m image of NGC 891, Whaley et al. (2009) measure a scale height of pc (with no extinction correction), while the IRAC 8 m image of NGC 5775 presented by Howk (2009) clearly shows a very extended layer with much vertical filamentary structure – although this wavelength traces more ionized PAHs. Second, the PAH scale heights are greater in NGC 5775 than in NGC 891 – the former also featuring more active star formation and more extended warm ionized and neutral gas halos (Irwin 1994; Collins et al. 2000; Oosterloo et al. 2007; Rand et al. 1990). Our PAH scale heights are comparable to or somewhat lower than the HI scale heights. Third, within NGC 891 and NGC 5775, scale heights are similar among the various PAH features.
There are two obvious caveats to consider when interpreting these PAH scale heights. The first is that we have halo measurements at only one distance along the major axis in each galaxy. The second is that the scale heights should reflect the intensity of the exciting radiation as well as the PAH density distribution.
No PAH feature stands out as having a significantly greater or smaller scale height in either galaxy halo. Thus, there is little evidence for significant modification between disk and halo of the relatively large, neutral PAH population responsible for the discrete features in this wavelength range. However, for NGC 891, the 8 m (dominated by the PAH feature at 7.7 m) scale height of pc measured by Whaley et al. (2009) (uncorrected for extinction) is significantly lower than our average of pc for the PAH features. In order for this difference to be an extinction effect, the extinction at 8 m would need to be about 1 mag greater than for our PAH features. Although 9.7 m silicate absorption may have a significant effect in the 8 m band, it may also affect the 11.2 m band (perhaps even more so than the 7.7 m feature which dominates the 8 m images; Galliano et al. 2008), while the 17.4 m feature could suffer from significant, albeit less, extinction due to the 18 m silicate feature. We therefore consider extinction an unlikely explanation. Furthermore, the PAH emission spectrum should be relatively independent of ISRF strength for the weak radiation fields expected in integrated disk and halo lines of sight (Galliano et al. 2008; Draine & Li 2007). Therefore the difference in scale heights most likely represents a real change in the PAH population between disk and halo. The result seems consistent with the drop of the 7.7 m/11.2 m intensity ratio with in the M82 outflow (Galliano et al., 2008). According to the models of Draine & Li (2007), the 7.7 m feature is due to smaller and more ionized PAHs than those responsible for the m features, although Galliano et al. (2008) claim that the 7.7 m/11.2 m ratio is sensitive only to ionization and not size variations. Our results would then indicate a significant drop in PAH ionization, and possibly a transition to larger PAHs, with height in the halo of NGC 891.
These results suggest a picture in which PAHs are transported upward from the disk (where they are thought to form in C-rich evolved AGB star envelopes) coupled with warm gas as part of a disk-halo flow. However, as discussed in §1, other mechanisms could be at work. Regarding radiative acceleration of dust, Davies et al. (1998) find that the process is less efficient for smaller grains. Alternatively, PAHs could form in situ. One possible mechanism is the shattering of larger grains in shocks, which could be effective for shock speeds as low as 50 km s-1 (Jones et al. 1996).
Shocks may also destroy PAHs, with larger ones being able to withstand faster shocks. Micelotta, Jones, & Tielens (2010) find partial destruction of PAHs for shocks of km s-1, while ones with 50 and 200 C atoms do not survive shocks faster than 100 km s-1 and 125 km s-1, respectively. PAHS in the m range probably contain a few hundred to a few thousand C atoms (Draine & Li, 2007), so if shock speeds are less than about 125 km s-1 they should survive. On the other hand, the lower scale height of the 8 m emission relative to the m features could be due to shock modification. If the former arise mostly from PAHs of C atoms (Draine & Li, 2007) there may be partial destruction for shock speeds near 100 km s-1, if one interpolates the models of Micelotta et al. (2010) for the 50 and 200 C atom cases.
We have also found that most m PAH EWs are higher at kpc than in the midplane, using two different methods to estimate the continuum. Beirão et al. (2008) find a similar trend between disk and halo for PAH EWs in this wavelength range in M82. One might conclude that, together with the increase in [Ne III]/[Ne II] seen in NGC 891 and NGC 5775, the result reflects previous findings of an increase of EWs with radiation field hardness (e.g., Wu et al. 2006 for Blue Compact Dwarf Galaxies; Engelbracht et al. 2008 for starbursts). However, our values are in the regime [Ne III]/[Ne II] , where such a correlation does not exist in star forming regions (Brandl et al. 2006; Gordon et al. 2008). PAH features also weaken in galaxies with low metallicity (e.g., Madden et al. 2006; Wu et al. 2006). There is no direct information on how metallicity varies with height in our three halos. Some lines of evidence, for instance the generally low metallicities of Milky Way High Velocity Clouds (Wakker 2004), suggest halos may have lower metallicities than disks, possibly as a result of mixing of disk-halo cycled and primordial gas. However, these clouds are found at heights much greater than kpc (Wakker et al. 2007). Regardless, a drop in metallicity with height would be expected to produce, if anything, a drop in EWs.
Hence, the explanation of this result is not clear. As mentioned before, it should be kept in mind that there is evidence (Draine et al. 2007) from SINGS galaxies that, just like the discrete features, the continuum in the 16 m range is mainly due to single-photon heating of PAHs. In fact, feature and continuum radiation in this range is dominated by molecules of size molecules for weak radiation fields in the model of Draine & Li (2007). If the continuum throughout the m range is also dominated by single-photon PAH heating, then our result suggests a perhaps rather subtle change in the PAH population between disk and halo. It is not clear which, if any, of the physical mechanisms described above may be responsible.
6 Conclusions
We have presented m spectroscopy of the disks and halos of the edge-on galaxies NGC 891, NGC 5775 and NGC 3044. Regarding the gas-phase lines, our main result is that [Ne III]/[Ne II] is higher in the halos of NGC 891 and NGC 5775 than in the disks. Scatter in NGC 3044 prevents any trend from being seen.
These results exacerbate the problem of explaining DIG line ratio behavior with simple photo-ionization models featuring a thin disk of massive stars. Focusing on NGC 891, where we have the most observational constraints, we have explored parameter space in CLOUDY photo-ionization models to try to determine, as a function of height, what combination of radiation temperature (assuming blackbodies for simplicity), ionization parameter and gas temperature may reproduce the observed IR and optical line ratios. We find that a dramatic rise in radiation temperature with is required, as well as a more modest rise in gas temperature and a fall in ionization parameter. Not all line ratios can be reproduced without considering more complex models, however. We then considered representative physical photo-ionization models incorporating a thin disk of massive stars in combination with a thick disk of hot (50 kK), presumably evolved stars. We found that the neon ratio behavior in particular could be approximately reproduced for such a thick disk with scale height of order 1 kpc and a contribution of of the ionizing radiation. Whether such a component exists in NGC 891 (or even the Milky Way) remains very unclear, but it cannot yet be ruled out based on space density, temperature and scale height arguments. In our models, such a component is also reasonably successful in reproducing the rising [O III]/H and approximate He I/H values in this galaxy. However its inclusion does introduce problems with other line ratios. A secondary stellar source is not the only way of increasing radiation hardness with height, and our exploration of parameter space with CLOUDY suggests a feasible way in which other such sources, including hard EUV/X-ray radiation, may be included in future work.
PAHs in NGC 891 and NGC 5775 form a vertically extended distribution, with emission scale heights larger in NGC 5775, as is the case for the HI gas. The PAH emission scale heights are comparable to, or somewhat less than, the HI values. These results suggest that PAHs participate in the active disk-halo flows in these two galaxies. In NGC 891, the scale heights are larger than the 8 scale height, suggesting a transition to more neutral, and possibly larger, grains with . Most PAH equivalent widths are higher in the halos than in the disks, again indicating some slight modification in the PAH population in the halo environment. Shocks and radiative acceleration are processes that may affect PAH populations in halos.
The 17 m H2 line is detected in all pointings, indicating a warm molecular gas component with a large vertical extent, reaching as high as kpc. The greater scale height of this emission in NGC 5775 vs. NGC 891 again suggests a connection with disk-halo flows. Column densities and temperatures cannot be derived without measurement of additional transitions, however. Future observations will no doubt reveal the fraction of halo gas mass in this phase, and its importance for understanding the ISM of halos.
Finally, we wish to stress here the importance of the neon ratio in understanding the energetics of the diffuse ISM, and the great advantage it holds over optical diagnostics. Future instruments capable of sensitive, high spatial and spectral resolution observations of these and other mid-IR lines should be a strong priority as these lines reveal a wealth of information.
References
- Allamandola et al. (1985) Allamandola, L. J., Tielens, A. G. G. M., & Barker, J. R. 1985, ApJ, 290, L25
- Allen & Kinman (2004) Allen, C., & Kinman, T. 2004, in Revista Mexicana de Astronomia y Astrofisica, vol. 27, Vol. 21, Revista Mexicana de Astronomia y Astrofisica Conference Series, ed. C. Allen & C. Scarfe, 121–127
- Alton et al. (1998) Alton, P. B., Bianchi, S., Rand, R. J., Xilouris, E. M., Davies, J. I., & Trewhella, M. 1998, ApJ, 507, L125
- Alton et al. (2000) Alton, P. B., Rand, R. J., Xilouris, E. M., Bevan, S., Ferguson, A. M., Davies, J. I., & Bianchi, S. 2000, A&AS, 145, 83
- Annibali et al. (2010) Annibali, F., Bressan, A., Rampazzo, R., Zeilinger, W. W., Vega, O., & Panuzzo, P. 2010, ArXiv e-prints
- Bakes et al. (2001a) Bakes, E. L. O., Tielens, A. G. G. M., & Bauschlicher, Jr., C. W. 2001a, ApJ, 556, 501
- Bakes et al. (2001b) Bakes, E. L. O., Tielens, A. G. G. M., Bauschlicher, Jr., C. W., Hudgins, D. M., & Allamandola, L. J. 2001b, ApJ, 560, 261
- Bauermeister et al. (2010) Bauermeister, A., Blitz, L., & Ma, C. 2010, ApJ, 717, 323
- Beirão et al. (2008) Beirão, P., Brandl, B. R., Appleton, P. N., Groves, B., Armus, L., Förster Schreiber, N. M., Smith, J. D., Charmandaris, V., & Houck, J. R. 2008, ApJ, 676, 304
- Benjamin (1994) Benjamin, R. A. 1994, PhD thesis, THE UNIVERSITY OF TEXAS AT AUSTIN.
- Benjamin (2002) Benjamin, R. A. 2002, in Astronomical Society of the Pacific Conference Series, Vol. 276, Seeing Through the Dust: The Detection of HI and the Exploration of the ISM in Galaxies, ed. A. R. Taylor, T. L. Landecker, & A. G. Willis, 201–+
- Binette et al. (1994) Binette, L., Magris, C. G., Stasińska, G., & Bruzual, A. G. 1994, A&A, 292, 13
- Bohlin et al. (1978) Bohlin, R. C., Savage, B. D., & Drake, J. F. 1978, ApJ, 224, 132
- Brandl et al. (2006) Brandl, B. R., Bernard-Salas, J., Spoon, H. W. W., Devost, D., Sloan, G. C., Guilles, S., Wu, Y., Houck, J. R., Weedman, D. W., Armus, L., Appleton, P. N., Soifer, B. T., Charmandaris, V., Hao, L., Higdon, J. A. M. S. J., & Herter, T. L. 2006, ApJ, 653, 1129
- Brunner et al. (2008) Brunner, G., Sheth, K., Armus, L., Wolfire, M., Vogel, S., Schinnerer, E., Helou, G., Dufour, R., Smith, J.-D., & Dale, D. A. 2008, ApJ, 675, 316
- Chiappini et al. (1997) Chiappini, C., Matteucci, F., & Gratton, R. 1997, ApJ, 477, 765
- Chiar & Tielens (2006) Chiar, J. E., & Tielens, A. G. G. M. 2006, ApJ, 637, 774
- Collins & Rand (2001) Collins, J. A., & Rand, R. J. 2001, ApJ, 551, 57
- Collins et al. (2000) Collins, J. A., Rand, R. J., Duric, N., & Walterbos, R. A. M. 2000, ApJ, 536, 645
- Dahlem et al. (2006) Dahlem, M., Lisenfeld, U., & Rossa, J. 2006, A&A, 457, 121
- Davies et al. (1998) Davies, J. I., Alton, P., Bianchi, S., & Trewhella, M. 1998, MNRAS, 300, 1006
- de Boer et al. (1997) de Boer, K. S., Aguilar Sanchez, Y., Altmann, M., Geffert, M., Odenkirchen, M., Schmidt, J. H. K., & Colin, J. 1997, A&A, 327, 577
- Domgorgen & Mathis (1994) Domgorgen, H., & Mathis, J. S. 1994, ApJ, 428, 647
- Dopita & Sutherland (1996) Dopita, M. A., & Sutherland, R. S. 1996, ApJS, 102, 161
- Downes (1986) Downes, R. A. 1986, ApJS, 61, 569
- Draine (2003) Draine, B. T. 2003, ARA&A, 41, 241
- Draine et al. (2007) Draine, B. T., Dale, D. A., Bendo, G., Gordon, K. D., Smith, J. D. T., Armus, L., Engelbracht, C. W., Helou, G., Kennicutt, Jr., R. C., Li, A., Roussel, H., Walter, F., Calzetti, D., Moustakas, J., Murphy, E. J., Rieke, G. H., Bot, C., Hollenbach, D. J., Sheth, K., & Teplitz, H. I. 2007, ApJ, 663, 866
- Draine & Li (2007) Draine, B. T., & Li, A. 2007, ApJ, 657, 810
- Engelbracht et al. (2006) Engelbracht, C. W., Kundurthy, P., Gordon, K. D., Rieke, G. H., Kennicutt, R. C., Smith, J.-D. T., Regan, M. W., Makovoz, D., Sosey, M., Draine, B. T., Helou, G., Armus, L., Calzetti, D., Meyer, M., Bendo, G. J., Walter, F., Hollenbach, D., Cannon, J. M., Murphy, E. J., Dale, D. A., Buckalew, B. A., & Sheth, K. 2006, ApJ, 642, L127
- Engelbracht et al. (2008) Engelbracht, C. W., Rieke, G. H., Gordon, K. D., Smith, J.-D. T., Werner, M. W., Moustakas, J., Willmer, C. N. A., & Vanzi, L. 2008, ApJ, 678, 804
- Ferland et al. (1998) Ferland, G. J., Korista, K. T., Verner, D. A., Ferguson, J. W., Kingdon, J. B., & Verner, E. M. 1998, PASP, 110, 761
- Franco et al. (1991) Franco, J., Ferrini, F., Barsella, B., & Ferrara, A. 1991, ApJ, 366, 443
- Fraternali & Binney (2008) Fraternali, F., & Binney, J. J. 2008, MNRAS, 386, 935
- Galarza et al. (1999) Galarza, V. C., Walterbos, R. A. M., & Braun, R. 1999, AJ, 118, 2775
- Galliano et al. (2008) Galliano, F., Madden, S. C., Tielens, A. G. G. M., Peeters, E., & Jones, A. P. 2008, ApJ, 679, 310
- Garcia-Burillo et al. (1992) Garcia-Burillo, S., Guelin, M., Cernicharo, J., & Dahlem, M. 1992, A&A, 266, 21
- Gies (1987) Gies, D. R. 1987, ApJS, 64, 545
- Giveon et al. (2002) Giveon, U., Sternberg, A., Lutz, D., Feuchtgruber, H., & Pauldrach, A. W. A. 2002, ApJ, 566, 880
- Gordon et al. (2008) Gordon, K. D., Engelbracht, C. W., Rieke, G. H., Misselt, K. A., Smith, J.-D. T., & Kennicutt, Jr., R. C. 2008, ApJ, 682, 336
- Green et al. (1986) Green, R. F., Schmidt, M., & Liebert, J. 1986, ApJS, 61, 305
- Greenawalt et al. (1997) Greenawalt, B., Walterbos, R. A. M., & Braun, R. 1997, ApJ, 483, 666
- Haffner et al. (2009) Haffner, L. M., Dettmar, R.-J., Beckman, J. E., Wood, K., Slavin, J. D., Giammanco, C., Madsen, G. J., Zurita, A., & Reynolds, R. J. 2009, Reviews of Modern Physics, 81, 969
- Haffner et al. (1999) Haffner, L. M., Reynolds, R. J., & Tufte, S. L. 1999, ApJ, 523, 223
- Hao et al. (2009) Hao, L., Wu, Y., Charmandaris, V., Spoon, H. W. W., Bernard-Salas, J., Devost, D., Lebouteiller, V., & Houck, J. R. 2009, ApJ, 704, 1159
- Harris et al. (2006) Harris, H. C., Munn, J. A., Kilic, M., Liebert, J., Williams, K. A., von Hippel, T., Levine, S. E., Monet, D. G., Eisenstein, D. J., Kleinman, S. J., Metcalfe, T. S., Nitta, A., Winget, D. E., Brinkmann, J., Fukugita, M., Knapp, G. R., Lupton, R. H., Smith, J. A., & Schneider, D. P. 2006, AJ, 131, 571
- Heald et al. (2007) Heald, G. H., Rand, R. J., Benjamin, R. A., & Bershady, M. A. 2007, ApJ, 663, 933
- Heber (2009) Heber, U. 2009, ARA&A, 47, 211
- Hoopes & Walterbos (2003) Hoopes, C. G., & Walterbos, R. A. M. 2003, ApJ, 586, 902
- Houck et al. (2004) Houck, J. R., Roellig, T. L., van Cleve, J., Forrest, W. J., Herter, T., Lawrence, C. R., Matthews, K., Reitsema, H. J., Soifer, B. T., Watson, D. M., Weedman, D., Huisjen, M., Troeltzsch, J., Barry, D. J., Bernard-Salas, J., Blacken, C. E., Brandl, B. R., Charmandaris, V., Devost, D., Gull, G. E., Hall, P., Henderson, C. P., Higdon, S. J. U., Pirger, B. E., Schoenwald, J., Sloan, G. C., Uchida, K. I., Appleton, P. N., Armus, L., Burgdorf, M. J., Fajardo-Acosta, S. B., Grillmair, C. J., Ingalls, J. G., Morris, P. W., & Teplitz, H. I. 2004, ApJS, 154, 18
- Howk (2009) Howk, J. C. 2009, ArXiv e-prints
- Howk et al. (2009) Howk, J. C., Ribaudo, J. S., Lehner, N., Prochaska, J. X., & Chen, H.-W. 2009, MNRAS, 396, 1875
- Howk & Savage (1997) Howk, J. C., & Savage, B. D. 1997, AJ, 114, 2463
- Howk & Savage (1999) —. 1999, AJ, 117, 2077
- Howk & Savage (2000) —. 2000, AJ, 119, 644
- Hunt et al. (2010) Hunt, L. K., Thuan, T. X., Izotov, Y. I., & Sauvage, M. 2010, ApJ, 712, 164
- Ibata et al. (2009) Ibata, R., Mouhcine, M., & Rejkuba, M. 2009, MNRAS, 395, 126
- Irwin (1994) Irwin, J. A. 1994, ApJ, 429, 618
- Jiang et al. (2006) Jiang, B. W., Gao, J., Omont, A., Schuller, F., & Simon, G. 2006, A&A, 446, 551
- Jones et al. (1996) Jones, A. P., Tielens, A. G. G. M., & Hollenbach, D. J. 1996, ApJ, 469, 740
- Jurić et al. (2008) Jurić, M., Ivezić, Ž., Brooks, A., Lupton, R. H., Schlegel, D., Finkbeiner, D., Padmanabhan, N., Bond, N., Sesar, B., Rockosi, C. M., Knapp, G. R., Gunn, J. E., Sumi, T., Schneider, D. P., Barentine, J. C., Brewington, H. J., Brinkmann, J., Fukugita, M., Harvanek, M., Kleinman, S. J., Krzesinski, J., Long, D., Neilsen, Jr., E. H., Nitta, A., Snedden, S. A., & York, D. G. 2008, ApJ, 673, 864
- Lebouteiller et al. (2007) Lebouteiller, V., Brandl, B., Bernard-Salas, J., Devost, D., & Houck, J. R. 2007, ApJ, 665, 390
- Lee (1998) Lee, S.-W. 1998, PhD thesis, AA(QUEEN’S UNIVERSITY AT KINGSTON (CANADA))
- Lee & Irwin (1997) Lee, S.-W., & Irwin, J. A. 1997, ApJ, 490, 247
- Lee et al. (2001) Lee, S.-W., Irwin, J. A., Dettmar, R.-J., Cunningham, C. T., Golla, G., & Wang, Q. D. 2001, A&A, 377, 759
- Leger & Puget (1984) Leger, A., & Puget, J. L. 1984, A&A, 137, L5
- Madden et al. (2006) Madden, S. C., Galliano, F., Jones, A. P., & Sauvage, M. 2006, A&A, 446, 877
- Madsen & Reynolds (2005) Madsen, G. J., & Reynolds, R. J. 2005, ApJ, 630, 925
- Madsen et al. (2006) Madsen, G. J., Reynolds, R. J., & Haffner, L. M. 2006, ApJ, 652, 401
- Micelotta et al. (2010) Micelotta, E. R., Jones, A. P., & Tielens, A. G. G. M. 2010, A&A, 510, A36+
- Mierkiewicz et al. (2006) Mierkiewicz, E. J., Reynolds, R. J., Roesler, F. L., Harlander, J. M., & Jaehnig, K. P. 2006, ApJ, 650, L63
- Miller & Veilleux (2003) Miller, S. T., & Veilleux, S. 2003, ApJ, 592, 79
- Moffat et al. (1998) Moffat, A. F. J., Marchenko, S. V., Seggewiss, W., van der Hucht, K. A., Schrijver, H., Stenholm, B., Lundstrom, I., Setia Gunawan, D. Y. A., Sutantyo, W., van den Heuvel, E. P. J., de Cuyper, J., & Gomez, A. E. 1998, A&A, 331, 949
- Morrison et al. (1997) Morrison, H. L., Miller, E. D., Harding, P., Stinebring, D. R., & Boroson, T. A. 1997, AJ, 113, 2061
- Napiwotzki (2008) Napiwotzki, R. 2008, in Astronomical Society of the Pacific Conference Series, Vol. 392, Hot Subdwarf Stars and Related Objects, ed. U. Heber, C. S. Jeffery, & R. Napiwotzki, 139–+
- Neufeld et al. (2006) Neufeld, D. A., Melnick, G. J., Sonnentrucker, P., Bergin, E. A., Green, J. D., Kim, K. H., Watson, D. M., Forrest, W. J., & Pipher, J. L. 2006, ApJ, 649, 816
- Norman & Ikeuchi (1989) Norman, C. A., & Ikeuchi, S. 1989, ApJ, 345, 372
- Oosterloo et al. (2007) Oosterloo, T., Fraternali, F., & Sancisi, R. 2007, AJ, 134, 1019
- Otte et al. (2002) Otte, B., Gallagher, III, J. S., & Reynolds, R. J. 2002, ApJ, 572, 823
- Otte et al. (2001) Otte, B., Reynolds, R. J., Gallagher, III, J. S., & Ferguson, A. M. N. 2001, ApJ, 560, 207
- Rand (1996) Rand, R. J. 1996, ApJ, 462, 712
- Rand (1997) —. 1997, ApJ, 474, 129
- Rand (1998a) —. 1998a, Publications of the Astronomical Society of Australia, 15, 106
- Rand (1998b) —. 1998b, ApJ, 501, 137
- Rand (2000) —. 2000, ApJ, 537, L13
- Rand et al. (1990) Rand, R. J., Kulkarni, S. R., & Hester, J. J. 1990, ApJ, 352, L1
- Rand et al. (2008) Rand, R. J., Wood, K., & Benjamin, R. A. 2008, ApJ, 680, 263
- Rauch et al. (2009) Rauch, T., Nickelt, I., Stampa, U., Demleitner, M., & Koesterke, L. 2009, in Astronomical Society of the Pacific Conference Series, Vol. 411, Astronomical Society of the Pacific Conference Series, ed. D. A. Bohlender, D. Durand, & P. Dowler, 388–+
- Reynolds (1990) Reynolds, R. J. 1990, ApJ, 349, L17
- Reynolds et al. (1999) Reynolds, R. J., Haffner, L. M., & Tufte, S. L. 1999, ApJ, 525, L21
- Reynolds et al. (1998) Reynolds, R. J., Hausen, N. R., Tufte, S. L., & Haffner, L. M. 1998, ApJ, 494, L99+
- Reynolds et al. (2001) Reynolds, R. J., Sterling, N. C., Haffner, L. M., & Tufte, S. L. 2001, ApJ, 548, L221
- Rosenthal et al. (2000) Rosenthal, D., Bertoldi, F., & Drapatz, S. 2000, A&A, 356, 705
- Rossa & Dettmar (2003a) Rossa, J., & Dettmar, R.-J. 2003a, A&A, 406, 493
- Rossa & Dettmar (2003b) —. 2003b, A&A, 406, 505
- Roussel et al. (2007) Roussel, H., Helou, G., Hollenbach, D. J., Draine, B. T., Smith, J. D., Armus, L., Schinnerer, E., Walter, F., Engelbracht, C. W., Thornley, M. D., Kennicutt, R. C., Calzetti, D., Dale, D. A., Murphy, E. J., & Bot, C. 2007, ApJ, 669, 959
- Sancisi et al. (2008) Sancisi, R., Fraternali, F., Oosterloo, T., & van der Hulst, T. 2008, A&A Rev., 15, 189
- Sarzi et al. (2010) Sarzi, M., Shields, J. C., Schawinski, K., Jeong, H., Shapiro, K., Bacon, R., Bureau, M., Cappellari, M., Davies, R. L., de Zeeuw, P. T., Emsellem, E., Falcón-Barroso, J., Krajnović, D., Kuntschner, H., McDermid, R. M., Peletier, R. F., van den Bosch, R. C. E., van de Ven, G., & Yi, S. K. 2010, MNRAS, 402, 2187
- Scoville et al. (1993) Scoville, N. Z., Thakkar, D., Carlstrom, J. E., & Sargent, A. I. 1993, ApJ, 404, L59
- Sembach et al. (2000) Sembach, K. R., Howk, J. C., Ryans, R. S. I., & Keenan, F. P. 2000, ApJ, 528, 310
- Smith et al. (2007) Smith, J. D. T., Draine, B. T., Dale, D. A., Moustakas, J., Kennicutt, Jr., R. C., Helou, G., Armus, L., Roussel, H., Sheth, K., Bendo, G. J., Buckalew, B. A., Calzetti, D., Engelbracht, C. W., Gordon, K. D., Hollenbach, D. J., Li, A., Malhotra, S., Murphy, E. J., & Walter, F. 2007, ApJ, 656, 770
- Sofue & Nakai (1993) Sofue, Y., & Nakai, N. 1993, PASJ, 45, 139
- Stasińska et al. (2008) Stasińska, G., Vale Asari, N., Cid Fernandes, R., Gomes, J. M., Schlickmann, M., Mateus, A., Schoenell, W., & Sodré, Jr., L. 2008, MNRAS, 391, L29
- Strickland et al. (2004) Strickland, D. K., Heckman, T. M., Colbert, E. J. M., Hoopes, C. G., & Weaver, K. A. 2004, ApJS, 151, 193
- Stroeer et al. (2007) Stroeer, A., Heber, U., Lisker, T., Napiwotzki, R., Dreizler, S., Christlieb, N., & Reimers, D. 2007, A&A, 462, 269
- Szczerba et al. (2007) Szczerba, R., Siódmiak, N., Stasińska, G., & Borkowski, J. 2007, A&A, 469, 799
- Taniguchi et al. (2000) Taniguchi, Y., Shioya, Y., & Murayama, T. 2000, AJ, 120, 1265
- Thejll et al. (1994) Thejll, P., Bauer, F., Saffer, R., Liebert, J., Kunze, D., & Shipman, H. L. 1994, ApJ, 433, 819
- Thornley et al. (2000) Thornley, M. D., Schreiber, N. M. F., Lutz, D., Genzel, R., Spoon, H. W. W., Kunze, D., & Sternberg, A. 2000, ApJ, 539, 641
- Tufte et al. (2002) Tufte, S. L., Wilson, J. D., Madsen, G. J., Haffner, L. M., & Reynolds, R. J. 2002, ApJ, 572, L153
- Tüllmann et al. (2006a) Tüllmann, R., Breitschwerdt, D., Rossa, J., Pietsch, W., & Dettmar, R.-J. 2006a, A&A, 457, 779
- Tüllmann & Dettmar (2000) Tüllmann, R., & Dettmar, R.-J. 2000, A&A, 362, 119
- Tüllmann et al. (2006b) Tüllmann, R., Pietsch, W., Rossa, J., Breitschwerdt, D., & Dettmar, R.-J. 2006b, A&A, 448, 43
- van der Kruit & Searle (1981) van der Kruit, P. C., & Searle, L. 1981, A&A, 95, 116
- van Dishoeck (2004) van Dishoeck, E. F. 2004, ARA&A, 42, 119
- Verma et al. (2003) Verma, A., Lutz, D., Sturm, E., Sternberg, A., Genzel, R., & Vacca, W. 2003, A&A, 403, 829
- Wakker (2004) Wakker, B. P. 2004, Ap&SS, 289, 381
- Wakker et al. (2007) Wakker, B. P., York, D. G., Howk, J. C., Barentine, J. C., Wilhelm, R., Peletier, R. F., van Woerden, H., Beers, T. C., Ivezić, Ž., Richter, P., & Schwarz, U. J. 2007, ApJ, 670, L113
- Weingartner & Draine (2001) Weingartner, J. C., & Draine, B. T. 2001, ApJ, 548, 296
- Werner et al. (2008) Werner, K., Rauch, T., Reiff, E., & Kruk, J. W. 2008, in Astronomical Society of the Pacific Conference Series, Vol. 391, Hydrogen-Deficient Stars, ed. A. Werner & T. Rauch, 109–+
- Werner et al. (2004) Werner, M. W., Roellig, T. L., Low, F. J., Rieke, G. H., Rieke, M., Hoffmann, W. F., Young, E., Houck, J. R., Brandl, B., Fazio, G. G., Hora, J. L., Gehrz, R. D., Helou, G., Soifer, B. T., Stauffer, J., Keene, J., Eisenhardt, P., Gallagher, D., Gautier, T. N., Irace, W., Lawrence, C. R., Simmons, L., Van Cleve, J. E., Jura, M., Wright, E. L., & Cruikshank, D. P. 2004, ApJS, 154, 1
- Whaley et al. (2009) Whaley, C. H., Irwin, J. A., Madden, S. C., Galliano, F., & Bendo, G. J. 2009, MNRAS, 395, 97
- White & Frenk (1991) White, S. D. M., & Frenk, C. S. 1991, ApJ, 379, 52
- Wolfire et al. (2003) Wolfire, M. G., McKee, C. F., Hollenbach, D., & Tielens, A. G. G. M. 2003, ApJ, 587, 278
- Wood & Mathis (2004) Wood, K., & Mathis, J. S. 2004, MNRAS, 353, 1126
- Wood et al. (2004) Wood, K., Mathis, J. S., & Ercolano, B. 2004, MNRAS, 348, 1337
- Wu et al. (2006) Wu, Y., Charmandaris, V., Hao, L., Brandl, B. R., Bernard-Salas, J., Spoon, H. W. W., & Houck, J. R. 2006, ApJ, 639, 157
- Xilouris et al. (1998) Xilouris, E. M., Alton, P. B., Davies, J. I., Kylafis, N. D., Papamastorakis, J., & Trewhella, M. 1998, A&A, 331, 894
| Line | Ionization Potential (eV) |
|---|---|
| H 6563 | 13.6 |
| S II 6716 | 10.4 |
| N II 6583 | 14.5 |
| O I 6300 | 13.6 |
| O III 5007 | 35.1 |
| He I 5876 | 24.6 |
| Ne II 12.81 m | 21.6 |
| Ne III 15.56 m | 41.0 |
| S III 18.71 m | 19.1 |
| S IV 10.51 m | 34.8 |
| Date | PointingaaPointing center of the field of view (each nod pointing is symmetrically offset from this position) | R.A. (J2000.0) | Decl. (J2000.0) | Integ. time per nod (sec) |
|---|---|---|---|---|
| 2008 Mar 26 | NGC 5775 Disk 1 | 14h 53m 58.4s | 3∘ 24 | 975 |
| 2008 Mar 26 | NGC 5775 Disk 2 | 14h 53m 59.0s | 3∘ 12 | 975 |
| 2008 Mar 26 | NGC 5775 Disk 3 | 14h 53m 59.6s | 3∘ 00 | 975 |
| 2008 Mar 26 | NGC 5775 Halo | 14h 53m 57.5s | 3∘ 14 | 3854 |
| 2008 Mar 26 | NGC 5775 Sky | 14h 54m 11.7s | 3∘ 58 | 3854 |
| 2008 Sep 9 | NGC 891 Halo east | 2h 22m 40.5s | 42∘ 13 | 21194 |
| 2008 Sep 9 | NGC 891 Halo west | 2h 22m 33.2s | 42∘ 44 | 21194 |
| 2008 Sep 9 | NGC 891 Sky | 2h 23m 32.7s | 42∘ 21 | 21194 |
| 2009 Jan 7 | NGC 3044 Halo SE | 9h 53m 39.1s | 1∘ 42 | 10597 |
| 2009 Jan 7 | NGC 3044 Disk 1 | 9h 53m 38.6s | 1∘ 01 | 975 |
| 2009 Jan 8 | NGC 3044 Disk 2 | 9h 53m 39.5s | 1∘ 55 | 975 |
| 2009 Jan 8 | NGC 3044 Disk 3 | 9h 53m 40.4s | 1∘ 49 | 975 |
| 2009 Jan 8 | NGC 3044 Halo NW | 9h 53m 39.9s | 1∘ 08 | 10597 |
| 2009 Jan 8 | NGC 3044 Sky | 9h 53m 39.5s | 1∘ 30 | 10597 |
| East Halo | East Halo | West Halo | West Halo | |
|---|---|---|---|---|
| Line | IntensityaaIntensity units are 10-17 erg cm-2 s-1 arcsec-2 | EW | Intensity | EW |
| m | m | |||
| [S IV] 10.51 m | 0.17bbUpper limits are 3 | 0.16 | ||
| [Ne II] 12.81 m | 2.40.2 | 3.00.2 | ||
| [Ne III] 15.56 m | 1.60.1 | 1.40.1 | ||
| [S III] 18.71 m | 1.70.1 | 1.00.1 | ||
| H2 S(1) 17.03 m | 1.40.1 | 1.70.1 | ||
| PAH 11.2 m | 18.21.3 | 1.140.04 | 19.21.4 | 1.360.05 |
| PAH 12.0 m | 1.60.3 | 0.100.02 | 2.20.3 | 0.150.02 |
| PAH 12.7 m | 7.10.5 | 0.520.02 | 7.80.6 | 0.640.02 |
| PAH 16.5 m | 0.80.1 | 0.110.02 | 1.20.1 | 0.230.02 |
| PAH 17.4 m | 0.40.1 | 0.070.02 | 0.70.1 | 0.130.02 |
| PAH m | 4.450.13 | 0.680.02 | ||
| PAH m | 4.450.13 | 0.680.02 | ||
| 15 m continuumccIntegrated over m | 7.00.5 | 0.6.30.4 |
| Position | [Ne III]/[Ne II] | [S III]/[Ne II] |
|---|---|---|
| East Halo | 0.670.04aaErrors are based on random noise in the data and the wavelength-dependent pointing uncertainty only. | 0.710.04 |
| West Halo | 0.470.03 | 0.330.03 |
| Disk 1 | Disk 1 | Disk 2 | Disk 2 | Disk 3 | Disk 3 | Halo | Halo | |
|---|---|---|---|---|---|---|---|---|
| Line | IntensityaaUnits are 10-17 erg cm-2 s-1 arcsec-2 | EW | Intensity | EW | Intensity | EW | Intensity | EW |
| (m) | (m) | (m) | (m) | |||||
| [S IV] 10.51 m | 3.7bbUpper limits are 3 | 3.8 | 3.9 | 0.5 | ||||
| [Ne II] 12.81 m | 967 | 1278 | 15510 | 13.80.9 | ||||
| [Ne III] 15.56 m | 172 | 242 | 282 | 3.20.3 | ||||
| [S III] 18.71 m | 312 | 393 | 564 | 4.30.3 | ||||
| H2 S(1) 17.03 m | 292 | 322 | 302 | 3.00.2 | ||||
| PAH 11.2 m | 104572 | 1.050.03 | 100670 | 1.030.03 | 97267 | 1.050.03 | 846 | 1.120.04 |
| PAH 12.0 m | 607 | 0.050.005 | 647 | 0.050.005 | 708 | 0.060.006 | 101 | 0.120.009 |
| PAH 12.7 m | 35624 | 0.420.01 | 33823 | 0.400.01 | 36825 | 0.510.01 | 232 | 0.410.01 |
| PAH 16.5 m | 554 | 0.110.007 | 575 | 0.120.008 | 545 | 0.120.008 | 4.40.4 | 0.110.009 |
| PAH 17.4 m | 283 | 0.060.005 | 233 | 0.040.005 | 213 | 0.040.006 | 3.90.4 | 0.100.009 |
| PAH m | 3.40.1 | 3.60.1 | 3.750.1 | 3.830.1 | ||||
| PAH m | 0.680.02 | 0.780.02 | 0.580.01 | 0.710.02 | ||||
| 15 m continuumccIntegrated over m | 42728 | 42728 | 40226 | 332 |
| Position | [Ne III]/[Ne II] | [S III]/[Ne II] |
|---|---|---|
| Disk 1 | 0.180.02aaErrors are based on random noise in the data and the wavelength-dependent pointing uncertainty only. | 0.320.01 |
| Disk 2 | 0.190.01 | 0.310.01 |
| Disk 3 | 0.180.01 | 0.360.01 |
| Halo | 0.230.01 | 0.310.01 |
| Disk 1 | Disk 1 | Disk 2 | Disk 2 | Disk 3 | Disk 3 | |
|---|---|---|---|---|---|---|
| Line | IntensityaaUnits are 10-17 erg cm-2 s-1 arcsec-2 | EW | Intensity | EW | Intensity | EW |
| (m) | (m) | (m) | ||||
| [S IV] 10.51 m | 1.1 | 2.4bbUpper limits are 3 | 4.3 | |||
| [Ne II] 12.81 m | 30.82.1 | 825 | 18412 | |||
| [Ne III] 15.56 m | 18.51.2 | 614 | 544 | |||
| [S III] 18.71 m | 11.90.8 | 272 | 483 | |||
| H2 S(1) 17.03 m | 11.20.8 | 121 | 383 | |||
| PAH 11.2 m | 20114 | 1.050.03 | 56139 | 0.820.02 | 106674 | 0.840.02 |
| PAH 12.0 m | 313 | 0.170.01 | 335 | 0.05 | 778 | 0.050.01 |
| PAH 12.7 m | 826 | 0.680.01 | 21515 | 0.460.01 | 42327 | 0.440.01 |
| PAH 16.5 m | 7.20.9 | 0.090.01 | 122 | 0.040.01 | 736 | 0.120.01 |
| PAH 17.4 m | 4.60.8 | 0.060.01 | 152 | 0.060.01 | 233 | 0.040.01 |
| PAH m | 3.20.1 | 2.80.1 | 3.10.1 | |||
| PAH m | 0.420.01 | 0.230.07 | 0.490.01 | |||
| 15 m continuumccIntegrated over m | 75.34.9 | 27618 | 52734 |
| North Halo | North Halo | South Halo | South Halo | |
|---|---|---|---|---|
| Line | IntensityaaUnits are 10-17 erg cm-2 s-1 arcsec-2 | EW | Intensity | EW |
| m | m | |||
| [S IV] 10.51 m | 0.18 | 0.18bbUpper limits are 3 | ||
| [Ne II] 12.81 m | 4.80.3 | 4.40.3 | ||
| [Ne III]15.56 m | 1.70.1 | 3.70.2 | ||
| [S III] 18.71 m | 2.40.2 | 1.230.09 | ||
| H2 S(1) 17.03 m | 3.70.2 | 1.90.1 | ||
| PAH 11.2 m | 36.92.6 | 1.150.04 | 33.52.3 | 1.280.04 |
| PAH 12.0 m | 2.70.3 | 0.080.008 | 6.10.5 | 0.220.01 |
| PAH 12.7 m | 9.60.7 | 0.400.01 | 12.50.9 | 0.570.02 |
| PAH 16.5 m | 3.80.3 | 0.210.01 | 2.40.2 | 0.150.01 |
| PAH 17.4 m | 1.20.2 | 0.070.01 | 2.50.2 | 0.170.01 |
| PAH m | 3.40.1 | 3.30.1 | ||
| PAH m | 0.740.02 | 0.680.02 | ||
| 15 m continuumccIntegrated over m | 15.11.0 | 12.60.8 |
| Position | [Ne III]/[Ne II] | [S III]/[Ne II] |
|---|---|---|
| Disk 1 | 0.600.02aaErrors are based on random noise in the data and the wavelength-dependent pointing uncertainty only. | 0.390.01 |
| Disk 2 | 0.740.02 | 0.320.01 |
| Disk 3 | 0.290.01 | 0.260.01 |
| North Halo | 0.350.02 | 0.490.02 |
| South Halo | 0.840.03 | 0.280.01 |
| Line | NGC 891 East Halo | NGC 891 West Halo | NGC 5775 |
|---|---|---|---|
| [Ne II] 12.81 | |||
| [Ne III]15.56 | |||
| [S III] 18.71 | |||
| H2 S(1) 17.03 m | |||
| PAH 11.2 m | |||
| PAH 12.0 m | |||
| PAH 12.7 m | |||
| PAH 16.5 m | |||
| PAH 17.4 m | |||
| PAH 15 m continuum |
| Height | bbAll fluxes of hydrogen ionizing photons are scaled to the same density. Assuming a gas scaleheight of kpc and no change in gas filling factor would reduce the fluxes at kpc and kpc by a factor of 0.65 and 0.42 respectively. | |||||
|---|---|---|---|---|---|---|
| (kpc) | () | (K) | (K) | |||
| ccEmission line ratios come closest together at listed parameters, but there is no unique solution. | () | |||||
| () | ||||||
| () |