Distance to the PN K 335Distance to the PN K 335 \draft
masers(H2O) — stars: late-type — stars: winds, outflow — stars: kinematics — ISM: planetary nebulae: individual (K 335)
Measurement of the Distance and Proper Motions of the H2O Masers in the Young Planetary Nebula K 335
Abstract
In this paper we present the results of very long baseline interferometry (VLBI) observations carried out with the VLBI Exploration of Radio Astrometry (VERA) array and the Very Long Baseline Array (VLBA) toward H2O masers in a young planetary nebula K 335. From the VERA observations we measured the annual parallax and proper motion of a bright water maser spot in K 335. The resulting distance is 3.9 kpc. This is the first time that the parallax of a planetary nebula is obtained by observations of its maser emission. On the other hand, the proper motion of K 335 as a whole was estimated to be 3.340.10 mas yr-1, 5.930.07 mas yr-1. From these results we determined the position and velocity of K 335 in Galactic cylindrical coordinates: () (7.11 kpc, 275∘, 140 pc) and () (3316, 23311, 112) km s-1, respectively. Additionally, from our VLBA observations we measured the relative proper motions among the water maser spots located in the central region of the nebula, which have been proposed to be tracing a toroidal structure. The distribution and relative proper motions of the masers, compared with previous reported observed epochs, suggest that such structure could be totally destroyed within a few years, due to the action of high velocity winds and the expansion of the ionization front in the nebula.
1 Introduction
Determining the distance to astronomical sources represents one of the most challenging tasks in modern astronomy. The measurements become more difficult in the cases where there is no standard candle or ruler that establishes a direct relationship between an observable parameter and the distance. This is the situation of planetary nebulae (PNe) for which our knowledge on the distance still remains poor. The distance is a crucial parameter for studying the physical conditions and evolution of PNe. Furthermore, it also provides information on the location and velocity of these objects within the Galaxy, which indicate the stellar population to which PNe belong and their kinematical history in the Galaxy (see e.g. Imai et al. 2007). However, until now, the distances to less than 50 PNe have been estimated individually with a reasonable accuracy (e.g. Guzmán et al. 2009 and references therein). While most of those measurements were performed through indirect methods that are based on assumptions that cannot hold true in all cases, only about one third of them have been obtained by a direct method: trigonometric parallax of the central star. This method demands very precise astrometry (of the order of milliarcsecs) of a source at several epochs, resulting in a very arduous task. Fortunately, in recent years the techniques of VLBI in radio astronomy have been improved in such a way that, by carrying out careful astrometric observations, we can measure the trigonometric parallax, and subsequently the distance to the cosmic objects with great accuracy (e.g. Imai et al. 2007; Loinard et al. 2007, Nakagawa et al. 2008; Reid et al. 2009; Moellenbrock et al. 2009, Sato et al. 2010). An important constraint on these observations is that the sources must exhibit emission with high surface brightness. This requirement is met by the maser emission. Therefore, we can accurately determine the distance to PNe that present this type of emission by observing the masers in their envelopes. Moreover, these observations can be used as a powerful tool to study the kinematics of the circumstellar gas in water maser emitting PNe at very small scale.
K 335 is the first PN for which the association with water maser emission was discovered (Miranda et al. 2001). Since then, surveys of water masers toward very young PNe have been carried out, aiming to find more sources of the same type. As a result, two additional PNe have been found to be harboring water molecules: IRAS 17347-3139 (de Gregorio-Monsalvo et al. 2004) and IRAS 18061-2505 (Gómez et al. 2008). These three sources are characterized by showing bipolar lobes and a narrow and obscured equatorial band, as seen in the optical and infrared images (Miranda et al. 1998; Sahai et al. 2007). Thus, it has been suggested that a bipolar wind and a high density equatorial torus could be present in these PNe (Gómez et al. 2008; Tafoya et al. 2009), similarly to those observed in their progenitors, the pre-planetary nebulae. The presence of dust and high density gas could explain why the water maser molecules remain in the nebula even when the central star is already emitting a large amount of ionizing photons (Tafoya et al. 2007).
Miranda et al. (2001) observed the water masers in K 335 with the Very Large Array (VLA) and found that they are located in the central region of the nebula as well as at the tips of the two point-symmetric radio lobes of the nebula. The masers at the tips of the radio lobes resemble those of the so-called water fountain nebulae (Imai et al. 2002; Claussen et al. 2009), and they seem to be associated with a bipolar, precessing wind. On the other hand, the masers in the central region appear distributed along the equatorial, dark band, suggesting that they are associated with an equatorial torus. This idea has been considered by Uscanga et al. (2008), who modeled the central masers of K 335 as arising from a rotating-expanding ring-like structure. However, detailed measurements of the internal motion of these masers are necessary to better understand the kinematics of the different structures in this nebula.
In order to determine with higher accuracy the distance to the young planetary nebula K 335, and to measure the proper and internal motions of the water masers in the nebula, we carried out multi epoch VLBI observations. For this purpose, we have used the VLBI Exploration of Radio Astrometry (VERA) Array of the National Astronomical Observatory of Japan (Kobayashi et al. 2003) and the Very Long Baseline Array (VLBA) of the NRAO999The National Radio Astronomy Observatory is a facility of the National Science Foundation operated under cooperative agreement by Associated Universities, Inc.. The details of the observations are described in §2. The annual parallax and proper motion measurement of K 335, as well as the internal motions of the masers are presented in §3. In §4 we discuss the results and their implications on the study of K 335.
2 Observations and data reduction
2.1 VERA Observations
The observations of the K 335 H2O masers at 22 GHz with VERA were carried out during 16 epochs from 2007 October to 2009 August. Table 1 gives a summary of these observations. At each epoch, the total observation time was about 8 hours, including the scans on K 335 and the fringe phase and position reference source, J192559.6210626 (hereafter J1925+2106), which is one of the International Celestial Reference Frame (ICRF) sources. Since these two sources are spatially separated by only 0\arcdeg.57 it was possible to use the VERA’s dual-beam system. The telescope observed K 335 and J1925+2106 for 8 minutes every 20 minutes; in between, the target maser source IRAS 19312+1950 and its correspondent reference source were also observed. The astrometric results for that source are presented by Imai et al. (2010). The signals were digitized in four quantization levels, and then divided into 16 base-band channels (BBCs) in a digital filter unit, each of which had a bandwidth of 16 MHz. One of the BBCs was assigned to the frequency of the H2O maser emission in K 335 while the other 15 BBCs were assigned to the continuum emission from J1925+2106.
The data correlation was made with the Mitaka FX correlator. The accumulation period of the correlation was set to 1 second. The correlation outputs consisted of 512 and 32 spectral channels for the H2O maser and reference continuum emission, respectively. A velocity spacing of 0.42 km s-1 was obtained in each spectral channel for the H2O maser emission.
The data reduction was mainly made with the Astronomical Imaging Processing System (AIPS) package of the NRAO. To achieve a good astrometry, we performed the following procedure. At first, we recalculated the delay-tracking solutions for the correlated data using an improved delay-tracking model. Through the whole data analysis, we adopted the coordinates of the delay-tracking center: 192744023, 21∘30′0344 for K 335 and 192559605352, 21∘06′26.16198 for the position reference source J1925+2106. The delay-tracking solutions included delay contributions from the atmosphere, which were estimated using the global positioning system data (Honma et al. 2008). Subsequently, the differences due to instrumental delays between the two signal paths in the dual beam system were calibrated using differential delays, which were measured using artificial noise signals injected at the same time into the two receivers. Then, fringe-fitting and self-calibration were performed on the fringe phase and position reference source data, whose solutions were applied to the maser emission data. Only the solutions of the BBC with the same frequency as that of the H2O maser emission were used for the fringe-phase compensation. Finally, the image cubes of the maser source were obtained by visibility deconvolution through the CLEAN algorithm. A few CLEAN boxes were specified after trial imaging. This is necessary to avoid false identification of maser emission in the phase-referenced dirty images, which have high-level side lobes due to imperfect phase compensation. The typical rms noise in the emission-free spectral channel images is given in Table 1.
| Observation | VERA | BeamcccSynthesized beam size resulting from natural weighted visibilities; major and minor axis lengths and position angle. | Astrometry | ||
|---|---|---|---|---|---|
| Code | Epoch | TelescopesaaaTelescope whose data were valid for phase-referencing maser imaging. M: Mizusawa, R: Iriki, O: Ogasawara, S: Ishigakijima. | Noisebbbrms noise in units of mJy beam-1 in the emission-free spectral channel image. | [mas, ∘] | valid? |
| r07298a | 2007 October 25 | MROS | 56 | 1.340.78 , 45.8 | Yes |
| r07333a | 2007 November 29 | MROS | 78 | 1.450.70 , 50.7 | Yes |
| r07358b | 2007 December 25 | MROS | 82 | 1.490.53 , 50.8 | Yes |
| r08042b | 2008 February 11 | MROS | 40 | 1.290.88 , 57.3 | Yes |
| r08080b | 2008 March 20 | MROS | 38 | 1.340.83 , 47.5 | Yes |
| r08106a | 2008 April 15 | MROS | 66 | 1.170.63 , 55.9 | Yes |
| r08142a | 2008 May 21 | MROS | 61 | 1.770.80 , 45.3 | NodddPossible large position offsets due to a systematic error. |
| r08182a | 2008 June 30 | MROS | 87 | 1.440.74 , 50.4 | NodddPossible large position offsets due to a systematic error. |
| r08211a | 2008 July 29 | MROS | 127 | 1.310.77 , 52.3 | NodddPossible large position offsets due to a systematic error. |
| r08271a | 2008 September 27 | MO | — | — | NoeeeVisibility data valid for the image synthesis were obtained only from the Mizusawa and Ogasawara stations. |
| r08344a | 2008 December 11 | MROS | 65 | 1.480.78 , 55.4 | Yes |
| r09013b | 2009 January 13 | MROS | 41 | 1.230.73 , 47.8 | Yes |
| r09045a | 2009 February 14 | MRS | 94 | 1.950.73 , 44.5 | NofffVisibility data valid for the image synthesis were obtained only from the Mizusawa, Iriki, and Ishigakijima stations. |
| r09126a | 2009 May 8 | MROS | 54 | 1.750.77 , 47.0 | NodddPossible large position offsets due to a systematic error. |
| r09160a | 2009 June 11 | MROS | 93 | 1.410.75 , 49.6 | Yes |
| r09241a | 2009 August 29 | MROS | 79 | 1.620.73 , 45.2 | NogggNo maser emission was detected. |
2.2 VLBA Observations
The VLBA observations were carried out at 3 epochs: 2003 September 24, 2003 November 20, and 2003 December 21. The observation settings were basically the same for the 3 epochs. The ten antennas of the VLBA were used in all the epochs. K 335 was observed during intervals of 40 minutes, alternated with observations of 10 minutes on the calibrators J1925+2106, BL Lac and 3C345. The total on-source observation time was 6.5 hours. One IF with right circular polarization was used for our measurements. The bandwidth was 8 MHz centered at 20 km s-1 with respect to the local standard of rest (LSR). The data was correlated with the VLBA correlator in Socorro, NM, sampling 256 channels, which resulted in a spectral spacing of 31.25 kHz, corresponding to 0.42 km s-1.
The data reduction was performed using the AIPS package. The amplitude calibration was made using a priori knowledge of the gains and system temperatures of the system and antennas. The residual delays were obtained using the source J1925+2106, and the bandpass calibration was made by using the sources BL Lac and 3C345. After this calibration, we performed fringe-fitting for the spectral channel with the strongest emission. In this process, the information of the absolute position is lost. Subsequently, we self-calibrated the visibilities of this channel and the solutions were copied to the rest of the spectral data. The self-calibrated data was deconvolved through the CLEAN algorithm; the rms noise in a single channel of the final data cube was typically 5 mJy beam-1. Subsequently, we proceeded to search for maser emission using the AIPS task SAD with the criteria of detecting emission above 10 times the noise level. From the candidate maser emission, we selected only those features that appeared in more than three contiguous spectral channels and found their positions by fitting a two-dimensional Gaussian model to the brightness distribution. The relative positional accuracy of the detected maser spots was typically better than 10 as.
3 Results
Thanks to the dual-beam system of VERA we were able to determine the positions of the water masers of K 335 with respect to the ICRF, which is a quasi-inertial reference frame based on the radio position of 212 extragalactic sources whose positions are known better than 0.5 mas (Ma et al. 1998). The absolute position error of maser spots with respect to the reference source achieved by our VERA observations was 0.1 mas. Therefore, they were suitable to determine the annual parallax and proper motion of K 335. On the other hand, our VLBA observations provided only the relative positions of the masers with respect to a reference feature. In consequence, we did not use them for the calculation of the annual parallax and proper motion of K 335 as a whole. However, these observations provided higher sensitivity, allowing us to detect fainter maser features than those detected with VERA. Thus, the VLBA observations were used to quantify the relative internal motions of the masers. Following we describe the results of the observations from each array.
3.1 Annual parallax and proper motion of K 3-35
[t!]l@rl@ rl@ cc
Parameters of the H2O maser spots in K 335 detected with VERA
vLSRhhfootnotemark: h
R.A. offset ()iifootnotemark: i
Dec offset ()iifootnotemark: i
jjfootnotemark: j
Feauturekkfootnotemark: k
[km s-1]
[mas]
[mas]
[Jy beam-1]
label
\endfirsthead
Table 1 – continued from previous page
vLSRhhfootnotemark: h
R.A. offset ()iifootnotemark: i
Dec offset ()iifootnotemark: i
jjfootnotemark: j
Feauturekkfootnotemark: k
[km s-1]
[mas]
[mas]
[Jy beam-1]
label
Continued on next page
\endfoot
hhfootnotemark: h Local-Standar-of-Rest velocity of the channel map.
iifootnotemark: i Position offset with respect to the delay-traacking center of the data correlation (see main text) in units of mas. The value in parenthesis is the relative position error given by the AIPS task JMFIT.
jjfootnotemark: j Peak intensity of the maser spot.
kkfootnotemark: k Label of the maser feature to which the maser spot belongs (see main text and Fig. 1). No label was assigned for those maser spots that did not show association with the other maser feature and that only appeared sporadically.
\endlastfoot2007 October 25
22.57 49.86 (0.02) 36.16 (0.02) 1.70 F
22.15 49.84 (0.02) 36.11 (0.02) 1.41 F
21.30 35.37 (0.01) 27.48 (0.02) 2.32 A
20.88 35.32 (0.01) 27.43 (0.01) 2.34 A
2007 November 29
22.57 50.07 (0.01) 36.85 (0.01) 2.87 F
22.15 50.03 (0.01) 36.86 (0.01) 2.80 F
21.73 35.62 (0.01) 28.26 (0.02) 2.89 A
21.30 35.61 (0.01) 28.23 (0.01) 12.20 A
20.88 35.61 (0.01) 28.21 (0.01) 8.02 A
20.46 35.63 (0.03) 28.06 (0.04) 0.67 A
2007 December 25
22.57 51.20 (0.07) 39.98 (0.04) 0.89 –
22.57 50.26 (0.04) 37.24 (0.03) 1.59 F
22.15 50.27 (0.05) 37.24 (0.04) 0.92 F
22.15 48.71 (0.07) 37.06 (0.06) 0.68 –
21.73 35.79 (0.05) 28.66 (0.04) 0.77 A
21.30 35.75 (0.02) 28.67 (0.02) 4.04 A
20.88 35.78 (0.03) 28.65 (0.03) 3.23 A
21.30 34.32 (0.06) 28.44 (0.04) 1.47 –
2008 February 11
22.99 50.36 (0.03) 37.80 (0.03) 0.57 F
22.57 50.38 (0.01) 37.81 (0.01) 2.98 F
22.15 50.39 (0.01) 37.79 (0.01) 1.95 F
21.73 35.82 (0.03) 30.14 (0.03) 0.75 A
21.30 35.81 (0.03) 29.62 (0.05) 0.66 A
20.88 35.88 (0.03) 29.12 (0.02) 0.70 A
2008 March 20
22.57 50.68 (0.02) 38.55 (0.02) 2.62 F
22.15 50.68 (0.02) 38.53 (0.02) 1.32 F
21.30 36.16 (0.03) 30.03 (0.03) 0.79 A
20.88 36.18 (0.02) 29.85 (0.02) 0.74 A
2008 April 15
22.57 51.15 (0.01) 38.83 (0.01) 2.16 F
22.15 51.11 (0.02) 38.88 (0.02) 1.19 F
21.30 36.65 (0.01) 30.22 (0.01) 2.03 A
20.88 36.69 (0.02) 30.15 (0.02) 1.51 A
2008 May 21
22.57 51.59 (0.09) 39.23 (0.11) 2.52 F
22.15 51.58 (0.09) 39.24 (0.11) 1.52 F
20.88 36.98 (0.08) 30.66 (0.10) 1.17 A
2008 June 30
22.57 52.34 (0.04) 39.24 (0.04) 1.75 F
22.15 52.70 (0.10) 42.78 (0.09) 0.62 –
22.57 50.89 (0.05) 41.17 (0.05) 1.07 –
22.15 52.33 (0.05) 39.29 (0.06) 0.73 F
21.30 37.88 (0.04) 30.69 (0.05) 0.80 A
2008 July 29
22.57 50.55 (0.08) 38.30 (0.08) 0.87 –
22.57 51.42 (0.13) 34.88 (0.07) 0.72 –
2008 December 11
22.99 53.59 (0.03) 42.84 (0.02) 0.72 F
22.57 44.91 (0.05) 39.31 (0.04) 0.45 H
22.57 53.63 (0.03) 42.79 (0.02) 0.81 F
22.15 44.95 (0.05) 39.30 (0.05) 0.35 H
22.15 53.62 (0.09) 42.85 (0.06) 0.47 F
2009 January 13
22.99 45.00 (0.04) 40.17 (0.04) 0.39 H
22.99 53.78 (0.02) 43.58 (0.02) 0.62 F
22.57 45.04 (0.02) 40.12 (0.02) 0.79 H
22.57 53.80 (0.02) 43.54 (0.02) 0.73 F
22.15 45.07 (0.03) 40.09 (0.03) 0.41 H
22.15 53.78 (0.04) 43.56 (0.04) 0.26 F
2009 February 14
22.57 54.37 (0.03) 43.51 (0.03) 1.13 F
22.57 52.63 (0.09) 41.70 (0.09) 0.46 –
22.15 45.62 (0.05) 40.14 (0.05) 0.62 H
22.15 54.21 (0.06) 43.64 (0.06) 0.66 F
21.30 39.77 (0.07) 35.59 (0.08) 0.42 A
2009 May 8
22.57 55.37 (0.07) 44.54 (0.09) 0.75 F
22.15 55.31 (0.09) 44.60 (0.09) 0.44 F
2009 June 11
22.57 55.41 (0.09) 45.49 (0.09) 0.63 F
22.57 55.14 (0.06) 45.30 (0.07) 0.70 F
| Epoch | R.A. offset | () | Dec. offset | () | |
|---|---|---|---|---|---|
| [mas] | [mas] | [mas] | [mas] | [Jy beam-1] | |
| 2007 October 25 | 49.86 | (0.02) | 36.16 | (0.02) | 1.70 |
| 2007 November 29 | 50.07 | (0.01) | 36.85 | (0.01) | 2.87 |
| 2007 December 25 | 50.26 | (0.04) | 37.24 | (0.03) | 1.59 |
| 2008 February 11 | 50.38 | (0.01) | 37.81 | (0.01) | 2.98 |
| 2008 March 20 | 50.68 | (0.02) | 38.55 | (0.02) | 2.62 |
| 2008 April 15 | 51.15 | (0.01) | 38.83 | (0.01) | 2.16 |
| 2008 December 11 | 53.63 | (0.03) | 42.79 | (0.02) | 0.81 |
| 2009 January 13 | 53.80 | (0.02) | 43.54 | (0.02) | 0.73 |
| 2009 June 11 | 55.14 | (0.06) | 45.30 | (0.07) | 0.70 |
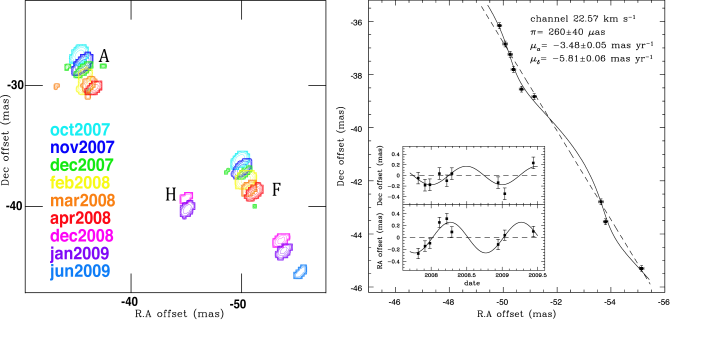
Table 2 shows the parameters of the water maser spots (i.e. maser emission in each individual channel map) detected with VERA during 14 epochs of observation. We found maser emission in the channels corresponding to the range of velocities v20.88 – 23.00 km s-1. The velocity of these masers corresponds to that of those located in the central region of K 335. The masers associated to the bipolar lobes, found by Miranda et al. (2001), are likely to have disappeared, given that they were not detected neither by de Gregorio-Monsalvo et al. (2004), nor in our observations. When the emission from all the epochs is velocity-integrated and mapped, we identify three maser features, which are defined as groups of maser spots that for a given observation epoch are spatially separated by 0.5 mas with a v 1.3 km s-1. These maser features correspond to physical maser clumps and they are shown in the left panel of Figure 1, labeled as , and (also see Table 2). Notice that for the features and we have used the same labels as for those detected with the VLBA, shown in Figure 2. The reason of doing this is that we noticed that the relative positions, as well as the LSR velocities, of two of the maser features detected with VERA are quite similar to those of the features labeled as and from the VLBA observations. Therefore, it is reasonable to assume that they are the same maser features. The feature was detected in two epochs with VERA but not with the VLBA. Within each feature, the relative positions of the maser spots change slightly (50 as) from one epoch to another. This can be due to a combination of the uncertainty in the determination of the position and the turbulent motion of the gas within the masing region. This variation is significant when compared to the parallax (250 as, see below). Therefore, in order to determine the annual parallax from the maser emission, it is necessary to trace the motion on the sky of a spot that remains relatively stable in position within the masing cloud and that can be detected during most of the epochs of observation. It has been found that this requirement is generally met by the brightest spots, i.e. their positions are better determined and they are not significantly affected by the turbulent motions within the masing region (e.g., Imai 1999). From the three maser features found in our observations with VERA, the feature was detected in most of the epochs. Within this maser feature, there are three spots with velocities at v22.15 km s-1, 22.57 km s-1and 22.99 km s-1; only the one at v22.57 km s-1was detected at sufficient number of epochs to be used for the parallax and proper motion measurements.
| maser | vLSR | RA offsetmmmThe positions are referred to the brightest spot labeled as in Figure 2. | ()nnnRelative position errors. | Dec offsetmmmThe positions are referred to the brightest spot labeled as in Figure 2. | ()nnnRelative position errors. | I | () |
|---|---|---|---|---|---|---|---|
| km s-1 | [mas] | [mas] | [mas] | [mas] | [Jy] | [Jy] | |
| 1st Epoch: | |||||||
| B | 21.26 | 0.261 | (0.001) | 1.062 | (0.002) | 0.674 | (0.006) |
| C | 20.84 | 0.279 | (0.004) | 3.598 | (0.008) | 0.096 | (0.005) |
| D | 22.10 | 4.406 | (0.014) | 4.446 | (0.023) | 0.035 | (0.005) |
| E | 22.10 | 8.464 | (0.003) | 5.155 | (0.004) | 0.192 | (0.005) |
| F | 22.52 | 14.030 | (0.001) | 8.705 | (0.001) | 2.396 | (0.006) |
| G | 23.36 | 22.110 | (0.034) | 32.000 | (0.040) | 0.013 | (0.004) |
| 2nd Epoch | |||||||
| B | 21.26 | 0.276 | (0.001) | 1.098 | (0.002) | 1.004 | (0.009) |
| C | 20.84 | 0.303 | (0.008) | 3.581 | (0.015) | 0.155 | (0.011) |
| D | 22.10 | 4.452 | (0.015) | 4.465 | (0.023) | 0.074 | (0.011) |
| E | 22.10 | 8.451 | (0.004) | 5.131 | (0.006) | 0.291 | (0.011) |
| F | 22.52 | 14.050 | (0.001) | 8.692 | (0.001) | 6.960 | (0.011) |
| G | 23.36 | 22.170 | (0.005) | 32.040 | (0.009) | 0.128 | (0.008) |
| 3rd Epoch | |||||||
| B | 21.26 | 0.277 | (0.001) | 1.126 | (0.001) | 1.099 | (0.010) |
| E | 22.10 | 8.449 | (0.009) | 5.121 | (0.009) | 0.143 | (0.008) |
| F | 22.52 | 14.070 | (0.001) | 8.688 | (0.001) | 3.143 | (0.009) |
| G | 23.36 | 22.210 | (0.014) | 32.060 | (0.020) | 0.064 | (0.007) |
The motion on the sky of the maser spot at v22.57 km s-1 () was modeled as a combination of a linear proper motion and the sinusoidal component due to the annual motion of the Earth. Thus, any other non-linear proper motion was considered to be negligible. In a first approach, we fitted the data from all the observation epochs. We noticed that some data points showed a significant offset from the model, as compared to the rest of the observations. We also noticed that the same offsets were found in the data of the source IRAS 19312+1950 (see §2.1). This source was observed during the same observation runs as K 335 and the results of the observations are presented by Imai et al. (2010). Since these two sources and their corresponding calibrators are different and independent from each other, we concluded that the observed offsets of some data points from the model must be due to a systematic problem during the observations at those epochs, which could not be removed during the calibration process. Therefore, we flagged out the points corresponding to the epochs that showed the systematic offset and performed the fitting again. The last column of Table 1 indicates whether the data was used for the fitting or not; Table 3 shows the parameters of the data points used in the fitting process.
The position of the peak of the emission of at the different epochs, along with the fitted model are shown in the right panel of Figure 1. In the inset of this Figure, we also show the motion of the maser spot as a function of time after subtracting a derived linear proper motion of 3.48 mas yr-1, 5.81 mas yr-1, which corresponds to the absolute proper motion of the feature . The error bars indicate the mean standard deviation of the data from the model: ( 0.09 mas, 0.11 mas). They were set to be the same for all the data points. The annual parallax was estimated to be 26040 as, which corresponds to a distance to the source of 3.9 kpc.
Note that this result relies on the assumption that we are tracing the motion of the same maser spot for all the epochs. It is known that the water maser emission of astronomical sources could be very variable, even on time scales of days. Particularly, the distribution of the masers in K 335 seems to have changed significantly since their discovery by Miranda et al. (2001). However, we are confident that we are tracing the motion of the same maser spot in our VERA observations due to the following reasons: i) We are using the maser emission from the same velocity channel map for all the epochs (v22.57 km s-1). ii) The brightness of the maser spot used for the measurement did not change significantly during the observations (see Table 3). iii) If we were not observing the same maser spot, the position would show sudden jumps as a function of time, instead of the smooth linear-sinusoidal motion seen in Figure 1; that would be reflected as data points that show significant departures from the fitted model. Therefore, even if the maser spot disappeared from one epoch to another, it would be tracing the same physical maser clump after reappearing. On the other hand, it is likely that the maser spot experienced non-linear motions during the two years of observations, slightly departing from the linear-sinusoidal fitted model. However, these departures are considered within the error bars shown in Figure 1. Thus, our estimation of the distance is not affected.
| maser | ()oooThe proper motions are referred to the brightest spot labeled as . | ()oooThe proper motions are referred to the brightest spot labeled as . | ()pppThe proper motions are referred to a reference frame in which the sum of the proper motions equals zero. | ()pppThe proper motions are referred to a reference frame in which the sum of the proper motions equals zero. |
|---|---|---|---|---|
| [mas yr-1] | [mas yr-1] | [mas yr-1] | [mas yr-1] | |
| 0.140 (0.025) | 0.075 (0.010) | 0.001 (0.088) | 0.043 (0.042) | |
| 0.217 (0.031) | 0.337 (0.027) | 0.076 (0.090) | 0.220 (0.049) | |
| 0.011 (0.025) | 0.034 (0.010) | 0.152 (0.088) | 0.151 (0.042) | |
| 0.154 (0.025) | 0.197 (0.010) | 0.295 (0.088) | 0.079 ( 0.042) | |
| 0.216 (0.030) | 0.071 (0.013) | 0.075 (0.089) | 0.189 (0.042) | |
| 0.141 ( 0.092) | 0.118 (0.043) | |||
| 0.578 (0.047) | 0.321 (0.013) | 0.437 (0.097) | 0.203 (0.043) |
3.2 Internal proper motions of the water masers
From our VLBA observations we mapped the maser emission towards the central region of K 335. The maser spots located at the tip of the lobes of K 335, as reported by Miranda et al. (2001), were not detected in our images above a 3– noise level. The detected emission appears as individual maser features spread over an area of 20 20 mas within a velocity range of v20 – 25 km s-1 and they are labeled as , , , , , and in Figure 2. The integrated flux density of the strongest feature was approximately 20 Jy (see inset in left panel of Figure 2). This flux is higher than those observed by Miranda et al. (2001) and Tafoya et al. (2007) by a factor of 10. The features , , , and were detected in the three epochs of observation, while the features and were only detected in two epochs (Table 4). In general the emission from each feature appears in more than 3 channels (i.e. each maser feature consists of more than 3 maser spots). The relative position of the spots within a maser feature changes slightly from each other (50 as) at the different epochs, due to the uncertainty of the position and to the internal turbulent motion of the gas in the masing region. This variation is significant when compared to the internal proper motions (see Table 5). Thus, following the same reasoning as in the case of the VERA observations (see §3.1), we have used the position of the strongest spot of each feature to determined their relative proper motions.

The spot used for the self-calibration process, which is contained within the feature labeled as in Figure 2, was initially chosen as the reference point to derive the relative proper motions of the other spots. We measured the offsets and then performed a linear least squares fitting as a function of time. The result gives us the motions of the masers as seen from an observer attached to the feature . However, since the absolute proper motion of the feature was measured from the VERA observations (see §3.1), we decided to change the frame of reference of the relative proper motions from the feature to the feature by subtracting the corresponding proper motion vector (see Table 5). Subsequently, by adding the the absolute proper motion of the feature to the the relative proper motions of the other masers, we determined the absolute proper motions of all the features.
We noticed that the absolute linear proper motion of the feature measured with VERA coincides with the axis of the bipolar outflow of K 335, suggesting that this maser, and the others as well, could be tracing the motion of the gas in the outflow. However, this proper motion is very similar to that of the source IRAS 19312+1950: 2.61 mas yr-1, 6.73 mas yr-1 (Imai et al. 2010). This source is located in the sky very close to K 335 (2∘) at a very similar distance from the Sun 3.8 kpc). This coincidence indicates that the proper motions of the masers in these two sources are due to their motion within the Galaxy rather than to internal motions. Furthermore, in the case of K 335, it is reasonable to assume that the magnitude of the internal motions of the masers projected on the plane of the sky is of the same order as the radial velocity of the masers, vrad5 km s-1 (0.3 mas yr-1), assuming a systemic velocity of the source of 26 km s-1(Tafoya et al. 2007). This value is one order of magnitude smaller than the observed proper motions of the masers. Thus, we conclude that these absolute proper motions are mainly showing the motion of the whole nebula, which can be approximated as the average of all of them: 3.340.10 mas yr-1, 5.930.07 mas yr-1. More specifically, this proper motion corresponds to that of a frame of reference in which the sum of the motions of the masers equals zero. The velocity vectors of the masers in that frame of reference are shown in the right panel of Figure 2 and the values of the proper motions are given in Table 5.
4 Discussion
4.1 Distance to K 335 and its location in our Galaxy
The distance to K 335 has been commonly assumed to be 5 kpc, as estimated from the distance scale proposed by Zhang (1995). This distance scale is based on the correlation between the ionized mass, the surface brightness temperature and the radii of the PNe. However, several other values have been estimated by other authors: Cahn et al. (1992) calibrated the parameters of several PNe using the values from other PNe, for which the distances are well known, and estimated a distance to K 335 to be 4 kpc. Aaquist (1993) assumed that K 335 was associated to the L755 molecular cloud for which the kinematical distance based on the velocity of the CO is 9 kpc. van de Steene & Zijlstra (1995) obtained a distance of 6.38 kpc based on a correlation of the brightness temperature and size of the planetary nebulae. Phillips (2002) using the same correlation, but based upon nearby sources, obtained a distance for K 335 of 2.08 kpc. Later, Phillips (2004) re-examined his method and found a distance of 6.56 kpc. Recently, Giammanco et al. (2010) estimated the distance to PNe by means of extinction measurements; they found a distance to K 335, 1 kpc. This value is much smaller than the previous ones and the one we present in this work. This could be due to the fact that Giammanco et al. (2010) based their analysis on the extinction of the H emission, which can be very uncertain for some PNe. This wide variety of values for the distance to K 335 shows how poorly it has been constrained by these methods. It also shows that while the observations that use some indirect technique to measure the distance to several PNe, in general, provide good statistical results (uncertainty of 50% or less), the distance to individual objects, specially very obscured young PNe, might suffer from large uncertainties, in some cases by a factor of 2 or more. This results in a considerable error when determining other parameters of the nebula. From our observations we have obtained the distance to K 335 to be 3.9 kpc with an associated error of 18%. This result improves the accuracy of the value of the distance to this source and has the advantage of being based on a direct measurement, without assumptions on the intrinsic parameters, extinction, etc. We emphasize that this is the first time that the distance to a PN is measure through the parallax of the masers.
In previous works related to K 335, such as those of Miranda et al. (2001); Tafoya et al. (2007); Uscanga et al. (2008); Gomez et al. (2009) in which several parameters of the nebula were obtained, the adopted distance was 5 kpc. Our result improves the estimation of the distance to a value that is a factor of 0.75 smaller than the value used by those authors. In consequence, it is necessary to introduce a correction factor of 0.75 for the values of those parameters that scale linearly with the distance, and a factor of 0.56, for those that scale as . Then, the masers associated with the bipolar ionized lobes, detected by Miranda et al. (2001), are located at 3,800 AU from the center of the nebula, which is also the extent of the ionized lobes. The projected distance to the masers located near the central region of the nebula is only 65 AU. In general the time-scales depend linearly with the distance, which means that they should be shorter by a factor of 0.75 and that K 335 did not enter its PN phase until 1988. This result can explain why there was no He+ emission from K 335 in 1986 (see Miranda et al. 2001 and references therein). On the other hand, the molecular mass of K 335 estimated by Tafoya et al. (2007) would change from 0.017 to 0.01, and the Zeeman pair found by Gómez et al. (2009) would be located at around 110 AU, instead of 150 AU, from the central star.
Given our result on the parallax, it follows that K 335 is located at a distance of 3.9 kpc in the direction with Galactic longitude 56∘, located 140 pc over the Galactic plane, as observed from our Solar System. On the other hand, if we assume that the distance from the Sun to the center of our Galaxy is 8.5 kpc (Dehen & Binney 1998), the galactocentric cylindrical coordinates of K 335 are: () = (7.11 kpc, 275∘, 140 pc). Furthermore, we can estimate the motion of K 335 within our Galaxy by using our approximation of the proper motion discussed in §3.2. First, we use again the assumption that the distance from the Sun to the Galactic center is 8.5 kpc; we also assume a Galactic rotation speed in the Solar circle, 220 km s-1, and a solar motion with respect to the Local Standard of Rest () = (11.1, 12.24, 7.25) km s-1 (Schönrich et al. 2010). Then, by following the formulae presented by Johnson & Soderblom (1987), we obtain a velocity vector for K 335, () = (3316, 23311, 112) km s-1, with positive in the direction of the Galactic center. If we consider a flat rotation curve of the Galaxy, then the velocity of the Local Standard of Rest of K 335 is 220 km s-1and the modulus of the deviation from circular motion is 3714 km s-1.
The derived values for the distance, height over the Galactic plane and peculiar motion of K 335 are similar to those found by Imai et al. (2010) for the water maser emitting post-AGB star IRAS 193121950, which lies only 2 degrees away from K 335. This suggests that they might be tracing a similar population of stars, i.e. relatively high-mass (1.5) evolved stars, located in the Galactic Thin Disk, and whose dynamical age, estimated from their velocity dispersion, is 1 Gyr (e. g. Soubrian et al. 2003). This would be in agreement with the idea that bipolar PN evolved from progenitors with relatively higher mass than the average PN (Corradi et al. 1995). However, to further understand the distribution and kinematics of evolved stars within our Galaxy, more measurements toward this type of stars, similar to those presented in this work, are required.
4.2 The masers in the equatorial region
As previously mentioned, Miranda et al. (2001) found maser emission toward three regions in K 335. The maser emission at the tips of the lobes was suggested to be associated with a bipolar wind while the central masers were thought to be tracing an equatorial toroid. Uscanga et al.(2008) modeled the kinematical distribution of the water masers in the central region of this source using their radial velocity component. These authors found that the field of the radial velocity of the maser emission could be fitted by a model of a rotating and expanding ring-like structure tilted 55∘ with respect to the plane of the sky and with a position angle of 158∘. The expansion and rotation velocity of this ring is 1.4 km s-1and 3.1 km s-1, respectively. To try to test this model, we calculated and plotted the expected proper motions of the masers on the plane of the sky and compare them with those from our observations. Since we do not know exactly the velocity of the masers with respect to the central star, we plotted the proper motions of the masers with respect the the feature . Then, we changed the frame of reference of the model to the maser with the same radial velocity as that of the feature . According to the model, the masers would move 1 mas in 4 years, thus, the distribution of masers is not expected to change significantly. Assuming this, we can directly superimpose the masers and compare the velocity fields. We found that, while the magnitudes of the observed proper motions are similar to those of the model, the directions do not coincide. This disagreement could be due the fact that the masers presented by Miranda et al. (2001) could be arising in different maser clouds from those observed with the VLBA four years later. This idea is supported by the observations toward K 335 presented by de Gregorio-Monsalvo et al. (2004). These authors compared the positions of the water masers from observations carried out in May 2002 to the masers presented by Miranda et al. (2001) using the peak of the radio continuum as the point of reference. The separation of the masers between the two epochs implies expansion velocities of the masers larger than 100 km s-1 in the equatorial region, which results unlikely. This separation can be better explained if we consider that K 335 is a very young planetary nebula whose ionized component is changing rapidly. Since the water maser emission is arising in the regions where the gas has not been ionized, the separation would be indicating the expansion of the ionization front, which would have a speed 100 km s-1.
5 Summary
We presented the results from observations of the water maser emission toward K 335 using two VLBI arrays: VERA and the VLBA. From the VERA observations we have measured the annual parallax of this source, yielding for the first time a direct measurement of its distance: 3.9 kpc with an error of 18%. The value of the distance is a factor of 0.75 smaller than the previously assumed value. This provides a correction factor of 0.75 for those parameters that scale linearly with the distance and a correction factor of 0.56 for those parameters that scale as . This implies that this PN is younger than previously thought. From our measurements of the proper motion and distance, we also determine the location and kinematics of this source in our Galaxy. From the spatial distribution and relative internal motions of the masers, we suggest that the central region of K 335 is evolving rapidly as expected for a young PN and could be due to the expansion of the ionizing front and winds.
Acknowledgments
D.T. acknowledges support from the Japan Society for Promotion of Science (project ID: 22-00022). H.I. has
been financially supported by the Grant-in-Aid for Young Scientists from the Ministry of Education,
Culture, Sports, Science, and Technology (18740109), and by the Grant-in-Aid for Scientific Research
from Japan Society for Promotion Science (20540234). Y.G. acknowledges support from CONACyT grant 80769.
G.A. and J.M.T. acknowledge support from MICINN (Spain) AYA2008-06189-C03 grant (co-funded with FEDER funds).
and from Junta de Andalucía (Spain). L.F.M. is supported partially by grants AYA2008-01934 of the Spanish
MICINN (co-funded by FEDER funds) and FQM1747 of the Junta de Andalucía.
References
- [Aaquist.(1993)] Aaquist, O. B., 1993, A&A, 267, 260
- [Cahn et al.(1992)] Cahn, J. H., Kaler, J. B. & Stanghellini, L., 1992 A&A, 94, 399
- [Claussen et al.(2009)] Claussen, M., Sahai, R. & Morris, M., 2009, ApJ, 619, 219
- [Corradi & Schwarz(1995)] Corradi, L.M. & Schwarz H. E., 1995, A&A, 293, 871
- [de Gregorio-Monsalvo et al.(2004)] de Gregorio-Monsalvo, I., Gómez, Y., Anglada, G., Cesaroni, R., Miranda, L. F., Gómez, J. F. & Torrelles, J. M., 2004, ApJ, 601, 921
- [Dehen & Binney(1998)] Dehen, W. & Binney, J., 1998, MNRAS, 294, 429
- [Giammanco et al. (2010)] Giammanco et al., 2010, accepted by A&A
- [Gómez et al.(2008)] Gómez, J. F., Suárez, O., Gómez, Y., Miranda, L. F., Torrelles, J. M., Anglada, G. & Morata, O., 2008, AJ, 135, 2074
- [Guzmán et al.(2009)] Guzmán, L., Loinard, L., Gómez, Y. & Morisset, 2009, AJ, 138, 46
- [Honma et al.(2008)] Honma, M., et al., 2008, PASJ, 60, 935
- [Imai(1999)] Imai, H., 1999, Ph.D. Thesis, Tohoku University
- [Imai et al.(2002)] Imai, H., Obara, K., Diamond, P. J., Omodaka, T. & Sasao, T., 2002, Nature, 417, 829
- [Imai et al.(2007)] Imai, H., Sahai, R. & Morris, M. 2007, ApJ, 669, 424
- [Imai et al.(2010)] Imai, H., Tafoya, D., Honma, M., Hirota. T. & Miyaji, T., 2010, PASJ, submitted.
- [Johnson & Soderblom(1987)] Johnson, D. R. H. & Soderblom, D. R., 1987, AJ, 93, 864
- [Kobayashi et al.(2003)] Kobayashi et al. 2003, ASP Conf. Ser., 306, 48
- [Loinard et al.(2007)] Loinard, L., Torres, R. M., Mioduszewski, A. J., Rodríguez, L. F., González-Lópezlira, R. A., Lachaume, R., Vázquez, V., & González, E., 2007, ApJ, 671, 546
- [Ma et al.(1998)] Ma, C., Arias, E. F., Eubanks, T. M., Fey, A. L., Gontier, A.-M., Jacobs, C. S., Sovers, O. J., Archinal, B. A. & Charlot, P., 1998, AJ, 116, 516
- [Miranda et al.(1998)] Miranda, L. F., Torrelles, J. M., Guerrero, M. A., Aaquist, O. B. & Eiroa, C., 1998, MNRAS, 298, 243
- [Miranda et al.(2001)] Miranda, L. F., Gómez, Y., Anglada, G. & Torrelles, J. M. 2001, Nature, 414, 284
- [Moellenbrock et al.(2009)] Moellenbrock, G. A., Claussen, M. J. & Goss, W. M., 2009, ApJ, 694, 192
- [Nakagawa et al.(2008)] Nakagawa, A., et al., 2008, PASJ, 60, 1013
- [Phillips(2002)] Phillips, J. P., 2002, ApJS, 139, 199
- [Phillips(2004)] Phillips, J. P., 2004, MNRAS, 353, 589
- [Reid et al.(2009)] Reid, M. J., Menten, K. M., Zheng, X. W., Brunthaler, A., Moscadelli, L., Xu, Y., Zhang, B., Sato, M., Honma, M., Hirota, T., Hachisuka, K., Choi, Y. K., Moellenbrock, G. A. & Bartkiewicz, A., 2009, ApJ, 700, 137
- [Sahai et al.(2007)] Sahai, R., Morris, M., Sánchez Contreras, C. & Claussen, M., 2007, AJ, 134, 2200
- [Sato et al.(2010)] Sato, M., Hirota, T., Reid, M. J., Honma, M., Kobayashi, H., Iwadate, K., Miyaji, T.& Shibata, K. M., 2010, PASJ, 62, 287
- [Schönrich et al.(2010)] Schönrich, R., Binney, J. & Dehnen W., 2010, MNRAS, 403, 1829
- [Soubiran et al.(2003)] Soubiran, C., Bienaymé, O. & Siebert, A., 2003, ARA&A, 398, 141
- [Tafoya et al.(2008)] Tafoya, D., Gómez, Y., Anglada, G., Loinard, L., Torrelles, J. M., Miranda, L. F., Osorio, M., Franco-Hernández, R., Nyman, L.-Å, Nakashima, J. & Deguchi, S., 2007, AJ, 133, 364
- [Tafoya et al.(2009)] Tafoya, D., Gómez, Y., Patel, N. A., Torrelles, J. M., Gómez, J. F., Anglada, G., Miranda, L. F. & de Gregorio-Monsalvo, I., 2009, ApJ, 691, 611
- [Uscanga et al.(2008)] Uscanga, L., Gómez, Y., Raga, A. C., Cantó, J., Anglada, G., Gómez, J. F., Torrelles, J. M. & Miranda, L. F., 2008, MNRAS, 390, 1127
- [van de steene& Zijlstra(1995)] van de Steene, G. C. & Zijlstra, A. A., 1995, A&A, 293, 541
- [Zhang(1995)] Zhang, C. Y., 1995, ApJS, 98..659