Laser-Shock Compression and Hugoniot Measurements of Liquid Hydrogen to 55 GPa
Abstract
The principal Hugoniot for liquid hydrogen was obtained up to 55 GPa under laser-driven shock loading. Pressure and density of compressed hydrogen were determined by impedance-matching to a quartz standard. The shock temperature was independently measured from the brightness of the shock front. Hugoniot data of hydrogen provide a good benchmark to modern theories of condensed matter. The initial number density of liquid hydrogen is lower than that for liquid deuterium, and this results in shock compressed hydrogen having a higher compression and higher temperature than deuterium at the same shock pressure.
pacs:
62.50.-p 51.30.+i 52.72.+v 64.30.-tI INTRODUCTION
The properties of hydrogen at high pressure and high density are of great scientific interest. The equation of state (EOS) of hydrogen at these conditions is essential for modeling of the interior structure of gas giant planets Saumon and Guillot (2004); Nettelmann et al. (2008); Militzer et al. (2008). The large diversity in the estimation of Jupiter’s core mass is resulted from the uncertainty in the EOS data especially in the region around the insulator-to-metal transition. The EOS of hydrogen-isotopes has important practical applications for inertial confinement fusion Lindl (1995), and metallic hydrogen is suggested as a prospective candidate of high-temperature superconductor Ashcroft (1968). Chemical free-energy models Saumon et al. (1995); Ross (1998); Kerley (2003) and simulations Collins et al. (2001); Holst et al. (2008) have been used to predict the properties of warm dense hydrogen, but the results vary widely and have not converged yet. Therefore accurate experimental data for the hydrogen EOS are required for evaluation of the theoretical models and for further understanding of the fundamental nature of hydrogen.
It is more difficult to generate high pressures in hydrogen than in deuterium because of its lower shock impedance. For this reason, most of the recent experimental measurements by shock compression have focused on the heavier isotope Collins et al. (1998); Mostovych et al. (2000); Boehly et al. (2004); Knudson et al. (2004); Boriskov et al. (2005); Hicks et al. (2009). However, it should be noted that the Hugoniots for the two isotopes do not scale in density. Owing to the difference in zero-point energy, the mole volume of liquid hydrogen is larger than deuterium Wiberg (1955); Kerley (2003). As a result, hydrogen is expected to have higher compression and higher Hugoniot temperature than deuterium at the same pressure.
There is a large gap in the experimental achievement of shock compression between liquid hydrogen and deuterium. The principal Hugoniot for liquid deuterium was measured up to 220 GPa using laser-driven shock waves Hicks et al. (2009). For the case of liquid hydrogen, the Hugoniot was studied experimentally only to 10 GPa by a gas gun and explosive method more than two decades ago Dick and Kerley (1980); Nellis et al. (1983). The metallization of hydrogen on the Hugoniot is expected to occur at much higher pressure. In this work, we carried out laser-shock experiments of liquid hydrogen to pressures exceeding 10 GPa in order to make a quantitative comparison of the hydrogen Hugoniot around the metal transition with the deuterium data.
II EXPERIMENTS
The experiments were performed on the GEKKO HIPER laser facility at the Institute of Laser Engineering, Osaka University. The laser is a neodymium-doped glass system operating at the third harmonics wavelength of 351 nm. Laser energies between 0.8 and 1.4 kJ were delivered to generate the shock pressures using a nominally square pulse of 2.5 ns in duration. The laser focal spot of 600 m in diameter was smoothed using Kinoform phase plates. This resulted in the effective laser intensities between 4 and W/cm2.
Figure 1 shows the experimental setup and target arrangement. The cryogenic hydrogen target consisted of two z-cut -quartz plates, by which the hydrogen layer was sandwiched. The thickness of the quartz was 50 m for both of them. These quartz plates were glued to kovar flanges attached to a copper cell filled with liquid molecular hydrogen at 15 K. The gap between the two quartz windows was 30-250 m thick. The laser-side quartz was deposited by 40 m aluminum as a pusher. The aluminum layer has another important role to shield the quartz and hydrogen against the x-ray radiation from ablation plasma. The free surface of the rear-side quartz had an anti-reflective coating to minimize spurious reflections. In this target, the quartz was designed to be used not only as a window material but also as a reference standard for the impedance-matching measurement. The initial density of quartz and liquid hydrogen were 2.65 and 0.0760 g/cm3. At the probe laser wavelength 532 nm, the index of refraction of quartz and hydrogen were 1.547 and 1.121 Souers (1986). Small change in the optical properties of quartz at cryogenic temperature is ignorable Hicks et al. (2009).
III RESULTS: SHOCK VELOCITIES
Shock velocities in the laser-side quartz and hydrogen were measured using a line-imaging velocity interferometer system for any reflector (VISAR) Barker and Hollenbach (1972); Celliers et al. (2004). At the high pressure involved in these experiments, shock waves in the initially transparent quartz and hydrogen are reflecting. Then the VISAR can provide a direct time-resolved measurement of shock velocities in these media. The probe light for VISAR was a Q-switched yttrium-aluminum-garnet (YAG) laser operating at a wavelength of 532 nm. Two VISARs were run concurrently on each shot to resolve the 2 phase-shift ambiguities at shock breakout. The velocity sensitivities were 4.14 and 14.53 km/s/fringe for quartz, and 5.71 and 20.05 km/s/fringe for liquid hydrogen. Post processing of the VISAR images using Fourier transform methods determines the fringe position to % of a fringe. The resulting velocities were measured to % precision since shock velocities were high enough to cause multiple fringe shifts.
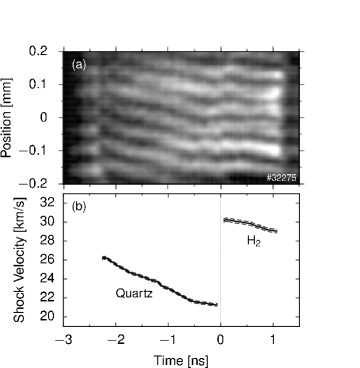
A sample VISAR trace is shown in Fig. 2(a) and the accompanying profile of shock velocities in Fig. 2(b). The time-resolved VISAR measurements allowed velocities to be tracked continuously during transit through both the standard and sample. The transit distance in the quartz determined from the time-integrated VISAR velocity agreed consistently with the thickness measured by interferometry before the shock experiment. Shock velocities immediately before and after the quartz-hydrogen interface were adopted for the impedance-matching analysis. To precisely determine the velocity at the breakout, a linear fit was taken of the velocities over 0.5 ns and extrapolated to forward or backward the impedance-matching time . The velocities were calculated by averaging the shock profile over 0.1 ns, which is equivalent to the temporal resolution of the streak camera.
As seen from Fig. 2(b), the shock velocity in quartz decreased with time more than 15% within ns. Decaying shock is a common feature of laser-driven shock waves. This means that the estimation of shock velocity by transit time requires corrections taking account of the deceleration rate, and thus it could bring a large uncertainty in . Therefore transparent standards have a great advantage for laser-shock experiments, and actually provide a significant improvement in the accuracy of the evaluation of the pressure and density along the Hugoniot Hicks et al. (2008); Ozaki et al. (2009). Shock planarity was observed to extend over 400 m which ensures more than 5 fringes to be available for the Fourier analysis. In this spatial range, the systematic variation in the shock arrival time was less than about 0.1 ns. Preheat in quartz and hydrogen can be neglected because preheat in the laser-side quartz was estimated to be less than 0.04 eV and no motion of the quartz-hydrogen interface was observed before shock breakout in 1D radiation hydrodynamic simulations with the MULTI code Ramis et al. (1988).
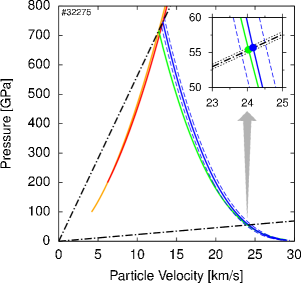
Figure 3 shows a impedance-match diagram in the - plane, where is the particle velocity. The quartz Hugoniot was previously established by the OMEGA-laser experiments to have a linear - relation given by , where , , and Hicks et al. (2005, 2008). This formula is valid at the pressure over 200 GPa and in good agreement with the Kerley-7360 EOS model Kerley (1999). Impedance-matching occurs at the intersection of the hydrogen Rayleigh line and the release isentrope of quartz. Because of the low shock impedance of hydrogen, quartz release curves from several hundreds of GPa down to more than one order of magnitude are needed. In this work, the quartz isentrope was calculated from the tabulated Kerley model.
Pre- and post-shock conditions are related by the Rankine-Hugoniot conservation equations:
| (1) |
| (2) |
| (3) |
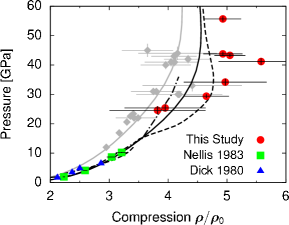
where is the specific internal energy and subscript 0 denotes initial conditions. The pressure and density of shocked hydrogen are derived from measured and using Eqs. (1) and (2). The results for the hydrogen Hugoniot are listed in Table I. Random errors shown in the table come from measurement uncertainties in . Random error propagation in the impedance-matching procedure is illustrated by Fig. 3. Systematic errors arising from uncertainties in the principal Hugoniot of quartz are also considered. Figure 4 depicts the principal Hugoniot of liquid hydrogen in the - plane, where is normalized by the initial hydrogen density . These results are shown along with the past experimental data Dick and Kerley (1980); Nellis et al. (1983) and theoretical models calculated for hydrogen with the initial density g/cm3 Kerley (2003); Holst et al. (2008); Ross .
The pressure range of shocked hydrogen obtained in this work was 25-55 GPa. The highest pressure is more than 5 times higher than the previous data. The compression of hydrogen ranges from 3.8 to 5.6, which is mostly comparable to the models but slightly softer at 30-50 GPa. Note that the slope change near 15 GPa in the Hugoniot curve predicted by the quantum molecular dynamics simulations is related to the dissociation of hydrogen molecules Bonev et al. (2004). The compression of deuterium, on the other hand, has been measured as 3.3-4.4 at the same pressure range Knudson et al. (2004); Hicks et al. (2009); Holmes et al. (1995), so that hydrogen exhibits systematically higher compression compared to deuterium (see Fig. 4). This trend is qualitatively consistent with theoretical predictions Kerley (2003) and can be seen in the earlier data below 10 GPa Nellis et al. (1983).
The uncertainties in the Hugoniot pressure and density are caused mostly by the random errors associated with velocity measurements, and , which are evaluated by
| (4) |
| (5) |
As seen from Fig. 4, the uncertainties in density are much larger than those in pressure. Since hydrogen is highly compressible at this pressure range, the factor in Eq. (5) becomes considerably large, 4. Then the errors in density are enhanced up to about 6%, even when the velocity errors are sufficiently small, %.
IV RESULTS: TEMPERATURE
Using a streaked optical pyrometer (SOP), the temperature of shocked hydrogen was measured simultaneously Ozaki et al. (2009); Miller et al. (2007). Despite temperature is fundamental to thermodynamics, is not a part of the Rankine-Hugoniot relations, and thus must be measured separately from shock pressure and density. We extracted the temperature by fitting the absolute spectral radiance to a gray body Plank spectrum,
| (6) |
with as a fit parameter, where is the speed of light, is Planck’s constant, and is Boltzmann’s constant.
The radiance was obtained in a single spectral band centered at 455 nm with a bandwidth 38 nm. The emissivity is related to the reflectivity of the shock front through . For the reflectivity at the SOP wavelength, we adopted the reflectivity measured at the VISAR wavelength assuming a weak dependence of on the wavelength (see Fig. 7). To relate the diagnostic system output to a source radiance, measurements were performed to determine the spectral response of the system. We used calibration signals recorded with a 3000-K tungsten quartz-halogen reflectorized lamp to find the radiance at our SOP wavelength. The radiance of this lamp was calibrated with a bolometric calibration traceable to the National Institute of Standards and Technology (NIST).
Absolute reflectivity is determined by comparing the shock reflectivity to that from the aluminum surface which has a known value, %. The obtained of shock front in hydrogen is listed in Table II. The reflectivity just after the shock breakout was calculated by the same algorithm as the shock velocity using VISAR signals. The reflectivity of shocked hydrogen increases from 8% to 23% as the pressure increases from 25 GPa to 41 GPa. The Fresnel formula for the reflectivity of the shock front is , where is the complex refractive index behind the shock front and is the refractive index in the undisturbed liquid. At low pressures, the refractive index of liquid hydrogen follows an empirical form, Souers (1986). Assuming the fluid remains mostly in its molecular form under shock compression, the refractive index at fivefold compression would be , and the reflectivity %. The much higher reflectivity we observed suggests that the fluid becomes conducting.
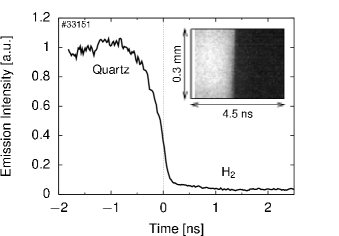
The Hugoniot temperature can be obtained using the reflectivity and SOP spectral intensities. An example of the intensity versus time data is shown in Fig. 5. The emission dropped dramatically when the shock front entered the hydrogen layer from quartz. Compared to the VISAR data, material boundary on SOP records is not clear due to the poorer temporal resolution ns. The self-emission profile of hydrogen just after the shock breakout is then determined from extrapolating a linear fit to measurements back to , in order to eliminate the contamination of the quartz emission. The time average of the fitted intensity over the temporal resolution is adopted for the derivation of the Hugoniot temperature of hydrogen. The results of the hydrogen temperature are listed in Table II. The size of the uncertainty in temperature is 6-19%, which stems from the system calibration, optical transmission, and measurements of self-emission and reflectivity.
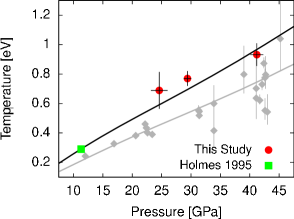
Figure 6 depicts the Hugoniot temperature of liquid hydrogen as a function of measured pressure. Theoretical models predicted that Hugoniot temperatures of liquid hydrogen are higher by a factor of than those of liquid deuterium at the same pressure Kerley (2003). Deuterium temperature measured by previous shock experiments Holmes et al. (1995); Bailey et al. (2008) are also shown in Fig. 6. Although the uncertainty in temperature measurements is still large, the hydrogen temperature obtained in this work is higher than the deuterium data. This is another experimental evidence of the isotope difference in the hydrogen Hugoniot. At this temperature, molecular hydrogen begins to dissociate and the fraction reaches to % (39%) at GPa (40 GPa) according to Kerley’s model Kerley (2003).
V DISCUSSION AND CONCLUSIONS
Drude-type models are often applied to parameterize the optical properties of liquid metal Hodgson (1972); Celliers et al. (2000). Within the Drude description, the complex index of refraction is given by where is the plasma frequency, is the carrier density, is the electron charge, is the electron mass, and is the optical frequency. Here the electron relaxation time is assumed to be where is the interparticle spacing and is the electron Fermi velocity. We adopt nm corresponding to a density g/cm3. Then the Drude reflectivity of liquid metallic hydrogen can be derived as a function of , which is depicted in Fig. 7.
High reflectivity is produced when the carrier density exceeds the critical density defined by . The critical density is cm-3 at nm. Taking %, for example, the carrier density is given by cm-3, which is about 31% of total hydrogen number density cm-3 and equivalent with . The Fermi energy estimated from this carrier density is 4.0 eV, which is higher than the shock temperature. This indicates that the observed highly reflective state would be characteristic of a degenerate liquid metal. Based on the Drude model, the reflectivity increases with the carrier density and saturates at %. This implies that the maximum reflectivity of hydrogen may be slightly lower than that of deuterium Celliers et al. (2000), although it depends on the assumed compression ratio. It will be interesting to confirm the saturated value of the reflectivity by future experiments.
The hydrogen Hugoniot obtained in this work is strongly dependent on the quartz EOS. Recently the quartz Hugoniot was reexamined by using magnetically driven flyer impact on the Z machine and a new fitting function was derived Knudson and Desjarlais (2009). For comparison, the hydrogen Hugoniots calculated by using the Z-fit and Kerley release (, , and ) are listed in Table I. The stiffer Hugoniot of quartz reduces the initial pressure of the release isentrope (see Fig. 2). At the initial shock state of quartz, the pressure and density inferred from the Z-fit Hugoniot, GPa and g/cm3, are lower than those of the OMEGA-fit case, GPa and g/cm3).
In our analysis, the quartz release cannot be approximated by a reflection of the Hugoniot in the - plane, and thus the off-Hugoniot EOS of Kerley’s model determines the shape of the curve. The particle velocity along the release isentrope can be calculated by using the Riemann integral:
| (7) |
where is the particle velocity at the initial shock state, and the sound speed is obtained from the pressure derivative of the density at constant entropy , . The second term of Eq. (7) is larger for the Z-fit case due to the lower density, and then the particle velocity increases faster with the decrease of density. Therefore, two release curves shown in Fig. 2 are gradually approaching at the lower pressure. The resulting differences in the Hugoniot pressure and density for hydrogen are 1% and 4% compared to those derived by the OMEGA-fit. Apparently, improvement of the quartz EOS is essential for the further development of Hugoniot measurements using quartz standards Boehly et al. (2007).
In summary, we have obtained the principal Hugoniot data -- for liquid hydrogen, not deuterium, in an unexplored range of pressure up to 55 GPa. The results demonstrate that the hydrogen Hugoniot cannot be scaled by density from the deuterium data in consequence of the initial density effects Hicks et al. (2009); Militzer (2006); Eggert et al. (2008). As for the study of planetary interiors, the hydrogen EOS data at much higher pressure are required since the transition to metallic hydrogen is anticipated to be at 200-400 GPa in Jupiter Saumon and Guillot (2004). However, the hydrogen temperature must be kept lower because the Hugoniot temperature at this pressure range is too high to reproduce Jupiter’s conditions. Therefore off-Hugoniot measurements of hydrogen by means of reflection shocks Boehly et al. (2004) and/or precompressed samples Eggert et al. (2008); Loubeyre et al. (2004); Kimura et al. (2010) will be a quite important next step.
Acknowledgements.
We thank G. Kerley, B. Holst, and M. Ross for providing us with their EOS data and W. Nellis for useful discussions. We also thank the anonymous referees whose comments and suggestions improved this paper. We are deeply grateful to the GEKKO technical crew for their exceptional support during these experiments and the Daico MFG Co. for their outstanding work on quartz targets. This work was performed under the joint research project of the Institute of Laser Engineering, Osaka University. This research was partially supported by grants for the Core-to-Core Program from the Japan Society for the Promotion of Science, the Global COE Program, “Center for Electronic Devices Innovation”, from the Ministry of Education, Culture, Sports, Science and Technology of Japan, and the Core Research for Evolutional Science and Technology (CREST) from the Japan Science and Technology Agency.

| Shot No. | [km/s] | [km/s] | [km/s] | [GPa] | [g/cm3] | [km/s] | [GPa] | [g/cm3] |
|---|---|---|---|---|---|---|---|---|
| 32275 | ||||||||
| 33159 | ||||||||
| 33144 | ||||||||
| 32270 | ||||||||
| 31912∗ | ||||||||
| 33151 | ||||||||
| 31917∗ | ||||||||
| 31922∗ |
| Shot No. | [%] | [eV] |
|---|---|---|
| 32270 | ||
| 33151 | ||
| 31922 |
References
- Saumon and Guillot (2004) D. Saumon and T. Guillot, Astrophys. J. 609, 1170 (2004).
- Nettelmann et al. (2008) N. Nettelmann, B. Holst, A. Kietzmann, M. French, R. Redmer, and D. Blaschke, Astrophys. J. 683, 1217 (2008).
- Militzer et al. (2008) B. Militzer, W. B. Hubbard, J. Vorberger, I. Tamblyn, and S. A. Bonev, Astrophys. J. 688, L45 (2008).
- Lindl (1995) J. Lindl, Phys. Plasmas 2, 3933 (1995).
- Ashcroft (1968) N. W. Ashcroft, Phys. Rev. Lett. 21, 1748 (1968).
- Saumon et al. (1995) D. Saumon, G. Chabrier, and H. M. van Horn, Astrophys. J. Suppl. 99, 713 (1995).
- Ross (1998) M. Ross, Phys. Rev. B 58, 669 (1998).
- Kerley (2003) G. I. Kerley, Sandia National Laboratories, Technical Rep. SAND2003-3613 (2003).
- Collins et al. (2001) L. A. Collins, S. R. Bickham, J. D. Kress, S. Mazevet, T. J. Lenosky, N. J. Troullier, and W. Windl, Phys. Rev. B 63, 184110 (2001).
- Holst et al. (2008) B. Holst, R. Redmer, and M. P. Desjarlais, Phys. Rev. B 77, 184201 (2008).
- Collins et al. (1998) G. W. Collins, L. B. Da Silva, P. Celliers, D. M. Gold, M. E. Foord, R. J. Wallace, A. Ng, S. V. Weber, K. S. Budil, and R. Cauble, Science 281, 1178 (1998).
- Mostovych et al. (2000) A. N. Mostovych, Y. Chan, T. Lehecha, A. Schmitt, and J. D. Sethian, Phys. Rev. Lett. 85, 3870 (2000).
- Boehly et al. (2004) T. R. Boehly, D. G. Hicks, P. M. Celliers, T. J. B. Collins, R. Earley, J. H. Eggert, D. Jacobs-Perkins, S. J. Moon, E. Vianello, D. D. Meyerhofer, et al., Phys. Plasmas 11, L49 (2004).
- Knudson et al. (2004) M. D. Knudson, D. L. Hanson, J. E. Bailey, C. A. Hall, J. R. Asay, and C. Deeney, Phys. Rev. B 69, 144209 (2004).
- Boriskov et al. (2005) G. V. Boriskov, A. I. Bykov, R. I. Il’kaev, V. D. Selemir, G. V. Simakov, R. F. Trunin, V. D. Urlin, A. N. Shuikin, and W. J. Nellis, Phys. Rev. B 71, 092104 (2005).
- Hicks et al. (2009) D. G. Hicks, T. R. Boehly, P. M. Celliers, J. H. Eggert, S. J. Moon, D. D. Meyerhofer, and G. W. Collins, Phys. Rev. B 79, 014112 (2009).
- Wiberg (1955) K. B. Wiberg, Chem. Rev. 55, 713 (1955).
- Dick and Kerley (1980) R. D. Dick and G. I. Kerley, J. Chem. Phys. 73, 5264 (1980).
- Nellis et al. (1983) W. J. Nellis, A. C. Mitchell, M. van Thiel, G. J. Devine, R. J. Trainor, and N. Brown, J. Chem. Phys. 79, 1480 (1983).
- Souers (1986) P. C. Souers, Hydrogen Properties for Fusion Power (University of California Press, Calfornia, 1986).
- Barker and Hollenbach (1972) L. M. Barker and R. E. Hollenbach, J. Appl. Phys. 43, 4669 (1972).
- Celliers et al. (2004) P. M. Celliers, D. K. Bradley, G. W. Collins, D. G. Hicks, T. R. Boehly, and W. J. Armstrong, Rev. Sci. Instrum. 75, 4916 (2004).
- Hicks et al. (2008) D. G. Hicks, T. R. Boehly, P. M. Celliers, D. K. Bradley, J. H. Eggert, R. S. McWilliams, R. Jeanloz, and G. W. Collins, Phys. Rev. B 78, 174102 (2008).
- Ozaki et al. (2009) N. Ozaki, T. Sano, M. Ikoma, K. Shigemori, T. Kimura, K. Miyanishi, T. Vinci, F. H. Ree, H. Azechi, T. Endo, et al., Phys. Plasmas 16, 062702 (2009).
- Ramis et al. (1988) R. Ramis, R. Schmalz, and J. Meyer-Ter-Vehn, Comp. Phys. Comm. 49, 475 (1988).
- Hicks et al. (2005) D. G. Hicks, T. R. Boehly, P. M. Celliers, J. H. Eggert, E. Vianello, D. D. Meyerhofer, and G. W. Collins, Phys. Plasma 12, 082702 (2005).
- Kerley (1999) G. I. Kerley, Kerley Publishing Services Rep. KPS99-4 (1999).
- (28) M. Ross, unpublished data.
- Bonev et al. (2004) S. A. Bonev, B. Militzer, and G. Galli, Phys. Rev. B 69, 014101 (2004).
- Holmes et al. (1995) N. C. Holmes, M. Ross, and W. J. Nellis, Phys. Rev. B 52, 15835 (1995).
- Miller et al. (2007) J. E. Miller, T. R. Boehly, A. Melchior, D. D. Meyerhofer, P. M. Celliers, J. H. Eggert, D. G. Hicks, C. M. Sorce, J. A. Oertel, and P. M. Emmel, Rev. Sci. Instrum. 78, 034903 (2007).
- Bailey et al. (2008) J. E. Bailey, M. D. Knudson, A. L. Carlson, G. S. Dunham, M. P. Desjarlais, D. L. Hanson, and J. R. Asay, Phys. Rev. B 78, 144107 (2008).
- Hodgson (1972) J. N. Hodgson, in Liquid Metals, Chemistry and Physics, edited by S. Z. Beer (Marcel Dekker, New York, 1972), p. 331.
- Celliers et al. (2000) P. M. Celliers, G. W. Collins, L. B. Da Silva, D. M. Gold, R. Cauble, R. J. Wallace, M. E. Foord, and B. A. Hammel, Phys. Rev. Lett. 84, 5564 (2000).
- Knudson and Desjarlais (2009) M. D. Knudson and M. P. Desjarlais, Phys. Rev. Lett. 103, 225501 (2009).
- Boehly et al. (2007) T. R. Boehly, J. E. Miller, D. D. Meyerhofer, J. H. Eggert, P. M. Celliers, D. G. Hicks, and G. W. Collins, in Shock Compression of Condensed Matter — 2007, edited by M. Elert, M. D. Furnish, R. Chau, N. Holmes, and J. Nguyen (AIP, New York, 2007), p. 19.
- Militzer (2006) B. Militzer, Phys. Rev. Lett. 97, 175501 (2006).
- Eggert et al. (2008) J. Eggert, S. Brygoo, P. Loubeyre, R. S. McWilliams, P. M. Celliers, D. G. Hicks, T. R. Boehly, R. Jeanloz, and G. W. Collins, Phys. Rev. Lett. 100, 124503 (2008).
- Loubeyre et al. (2004) P. Loubeyre, P. M. Celliers, D. G. Hicks, E. Henry, A. Dewaele, J. Pasley, J. H. Eggert, M. Koenig, F. Occelli, K. M. Lee, et al., High Pressure Res. 24, 25 (2004).
- Kimura et al. (2010) T. Kimura, N. Ozaki, T. Okuchi, T. Terai, T. Sano, K. Shimizu, T. Sano, M. Koenig, A. Hirose, T. Kakeshita, et al., Phys. Plasmas 17, 054502 (2010).