75As NMR of Ba(Fe0.93Co0.07)2As2 in High Magnetic Field
Abstract
The superconducting state of an optimally doped single crystal of Ba(Fe0.93Co0.07)2As2 was investigated by 75As NMR in high magnetic fields from 6.4 T to 28 T. It was found that the Knight shift is least affected by vortex supercurrents in high magnetic fields, T, revealing
slow, possibly higher order than linear, increase with temperature at , with . This is consistent with the extended -wave state with symmetry but the precise details of the gap structure are harder to resolve. Measurements of the NMR spin-spin relaxation time, , indicate a strong indirect exchange interaction at all temperatures. Below the superconducting transition temperature abrupt changes in vortex dynamics lead to an anomalous dip in consistent with vortex freezing from which we obtain the vortex phase diagram up to T.
pacs:
I Introduction
As a result of the discovery of pnictide superconductors by Kamihara et al., Kamihara et al. (2008) in 2008 there has been intense interest in this new family of materials. In the past two years their quality has greatly improved and large single crystals have become available. However, the nature of the superconducting state and the corresponding gap structure of the pnictide superconductors is not settled.
While the pairing mechanism, related to magnetic fluctuations, and basic structure of the extended -wave state are generally agreed upon, MazinSchmalian ; Mazin:2008splus ; Chubukov:2008rg ; Wang:2009frg details of possible gap anisotropy are currently actively investigated, often with opposite conclusions.
Experiments from angle resolved photoemission spectroscopy (ARPES), Ding et al. (2008); Kondo et al. (2008); Terashima et al. (2009) Andreev-reflection spectroscopy, Szabó et al. (2009) and specific heat Mu et al. (2009) measurements support the fully-gapped model. But penetration depth measurements, Gordon et al. (2009); Martin et al. (2009); Fletcher et al. (2009); Hicks et al. (2009) nuclear quadrupole resonance (NQR), and specific heat measurements Fukazawa et al. (2009) have been interpreted in terms of nodal gap structure. These measurements indicate that the superconducting order parameter might be fundamentally different in different classes of these materials, further complicating interpretation of the experiments.
Moreover, even in a single compound, but with different amount of doping, various gap signatures have been seen, from fully gapped, to nodal character. For example, calorimetric,Jang et al. (2010); Gofryk et al. (2010, 2010) transportTanatar:2010doping and optical conductivityFischer et al. (2010) measurements in overdoped Ba(Fe1-xCox)2As2 () show nodal character, and similarly in underdoped samples, Luan et al. (2010); Gofryk et al. (2010) whereas at optimal doping results are contradictorily interpreted either in terms of a more or less isotropic gapKim et al. (2010); Luan et al. (2010); Gofryk et al. (2010) or a strongly anisotropic gap. Mazin et al. (2010); Lobo et al. (2010)
The fact that the gap structure might be doping-dependent is a possibility. Theory predicts that in multi-band materials, such as pnictides, one may naturally find states with “accidental” nodes, even in the most symmetric configuration. In most cases the nodes appear on the outer electronic Fermi surface sheets, depending on the values of the interaction parameters, which are functions of doping. Kuroki:2008band5 ; Seo:2008splus ; Maier:2009 ; Chubukov:2009nodes ; Thomale:2009nodes The outstanding question now is what is the form and position of nodal lines on the electron Fermi surface. Vorontsov and Vekhter (2010); ChubukovEremin ; Mazin et al. (2010); graser:2010_3d122 Other nodal locations (e.g. on central hole pocket) have also been considered. Graser:2009degenr ; Goswami:2009degenr
In this work we report nuclear magnetic resonance (NMR) measurements on single crystals of Ba(Fe0.93Co0.07)2As2. NMR has advantages in that it can probe bulk characteristics, is sensitive to the electronic structure within a penetration depth of the surface of a single crystal, nm, and is less susceptible to surface conditions as might be the case in STM and ARPES experiments. In principle, Knight shift data from NMR can be an appropriate indicator of fully gapped or nodal gap structure. For the former, the Knight shift has the temperature dependence of the Yosida function Yosida (1958) or normal fluid density, and for a gap with line nodes the temperature dependence should be linear at low temperatures. Zheng et al. (2002) Our goal was to investigate the Knight shift at sufficiently high magnetic fields that vortex contributions to the temperature dependence of the local field are minimized, and at sufficiently low temperatures to identify the gap structure. It is also important to determine independently that the vortex structures have a static distribution, that is to say there is a solid vortex state. Then the vortex configuration is stable and cannot introduce temperature dependence to the lineshape, affecting the Knight shift analysis. Consequently we have measured the spin-spin relaxation time, , as a function of temperature and magnetic field and found it to be a good indicator for the onset of vortex dynamics. We focus on measurements of the Knight shift below the temperature where vortices become frozen.
II Experimental Methods
We have performed 75As NMR studies on a single crystal of Ba(Fe1-xCox)2As2 () with zero field K, varying temperatures from 2 K to 200 K with external magnetic field from T to T parallel to the -axis of the sample. The measurements were performed at Northwestern University and the National High Magnetic Field Laboratory in Tallahassee, Florida. The crystal was grown at Ames Laboratory by the self-flux method, Ni et al. (2008) having dimensions of 3.95.30.7 mm3 and mass of 49.3 mg. A Hahn echo sequence (echo) was used for spectra, Knight shift, linewidth, and some of our spin-spin relaxation time, , measurements, where is the delay time. A typical pulse length was 4 s, defined as that which gave maximum echo intensity. We used frequency sweeps when a single pulse did not cover a sufficiently wide frequency range. Delay times for acquisition of the spectra were varied from 70 to 200 s depending on temperature. The Knight shift and linewidth measurements were determined from gaussian fits to the line shape. The gyromagnetic ratio of the bare nucleus 75As, 7.2919 MHz/T, was used as the reference for the Knight shift. Linewidths were defined as full-width-at-half-maximum (FWHM) of the gaussian distribution. For measurements from the Hahn echo sequence, we varied from 100 s to 1.40 ms, and determined the rate from the initial portion of the recovery. In high magnetic fields, T in a resistive magnet, we used the Carr-Purcell-Meiboom-Gill (CPMG) sequence which is resistant to magnetic field fluctuations, Sigmund et al. (2001) (echo and indicate orthogonal RF phases). Typically, the refocusing time, , was chosen to be 250 s. In the course of these spin-spin relaxation measurements our comparison of CPMG and Hahn echo experiments revealed the existence of strong field fluctuations intrinsic to the sample. In all cases, the pulse sequence repetition time in the superconducting state was taken to be of order the spin-lattice relaxation time, Ning et al. (2009) , and was increased with decreasing temperature.
III NMR Spectrum and Knight Shift
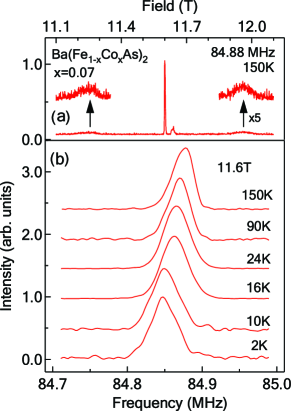
Our field swept spectra of 75As NMR and the shift of their peak frequencies with temperature are shown in Fig. 1. From the satellite transition we find the quadrupolar coupling, MHz (0.35 T), similar to the value reported by Ning et al. Ning et al. (2009) The quadrupolar satellite transitions are suppressed because of disorder in the electric field gradient (EFG) tensor, most likely from Co doping, from which the central transition is largely immune. In part a) of this figure there is a small component of the spectrum having a negligible Knight shift (0.003%). It is clear that these nuclei are from impurity or defect sites having a different orbital electronic shift. The spectra in the lower panel are obtained from the central transition. Similar observations were made by Ning et al. Ning et al. (2009)
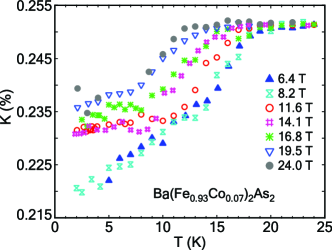
Our measurements of the temperature variation of the total Knight shift, , of the 75As central transition are presented in Fig. 2. Spin-singlet pairing is evident from the sharp decrease of at . The onset of this decrease at 18 K in 11.6 T coincides with the measured from the onset of the drop of the resistance reported by Ni et al. Ni et al. (2008) in the same magnetic field. This is in contrast to the cuprates, especially the underdoped cuprates, where the Knight shift starts to decrease well above , indicating the presence of a pseudogap. At low temperatures in the superconducting state, we observe that the Knight shift decreases, almost linearly with temperature.
We express the total Knight shift as . The spin part of the shift is , where is the spin susceptibility, and is the hyperfine field. Both the orbital, , and the quadrupolar shift, , are expected to be temperature independent. Additional magnetic shifts which we call could be associated with impurities, Mukhopadhyay et al. (2009) and in principle, could be temperature dependent, although this is not seen in cuprates, Alloul et al. (2009); Chen et al. (2008) nor do we find any evidence for this in the present work.
In the normal state of Ba(Fe0.93Co0.07)2As2 below 170 K, we find the Knight shift can be described by an activated process. However, there is a substantial range at low temperatures where the Knight shift is essentially temperature independent, Fig. 2. We use an Arrhenius form, , where we find K, , and with the fit shown by the (red) curve in the figure. At high temperatures, 90 – 170 K, the total Knight shift is proportional to the bulk susceptibility, Ni et al. (2008) giving a hyperfine field of kOe/, comparable to the value of 18.8 kOe/ reported by Kitagawa et al. Kitagawa et al. (2008) Therefore the thermally activated process modifies the local density of states and directly affects the spin susceptibility. However, neither the origin of this high-temperature behavior, nor its relation to superconductivity is known. The first observations of this effect, along with a similar analysis, was performed by Ning et al. Ning et al. (2009) giving K for their 8 % Co crystal of Ba(Fe0.92Co0.08)2As2.
In the superconducting state, we found that the total Knight shift gradually decreases on cooling from 12 K to 2 K in 11.6 T, figures 2 and 3. Similar behavior is consistently observed for higher magnetic fields up to 20 T, Fig. 4.
If one takes the view that this is a linear temperature dependence, then such behavior can be associated with gap nodes at the Fermi surface, similar to cuprate superconductors with -wave symmetry. Takigawa et al. (1991); Hardy et al. (1993); Zheng et al. (2002) The Knight shift is proportional to the susceptibility
| (1) |
where - normal state susceptibility, is the Fermi-Dirac distribution function, and is the density of states. For temperatures and for nodal quasiparticles , resulting in a linear temperature dependence . This is a much steeper rise than what we observe. Thus, we can exclude the possibility of nodes simultaneously present on both hole and electron sheets. However, nodes might be present on one of the pockets, presumably electronic, which in combination with the fully gapped hole pocket would give a slower -dependence. Another possibility is that the observed temperature dependence is higher power than linear, and the electronic superconducting gap in Ba(Fe0.93Co0.07)2As2 is either anisotropic with weak “accidental” nodes, or has only a minimum with typical energy scale , or even isotropically gapped, with strong pairbreaking due to impurities. Kim et al. (2010); Vorontsov and Vekhter (2010) In this regard, the existence of impurities affecting the local magnetic fields is evident in the temperature dependence of the NMR linewidth in the normal state, Fig. 5.
Comparison of our Knight shift measurements for T with the above model and different gap structures are shown in Fig. 3. The spin susceptibility is calculated according to Eq. 1, where the shift of the energy levels in magnetic field is given by parameter ( T), where is the Bohr magneton, and K is an estimate of the zero-field transition temperature in the absense of impurities. The density of states is computed in the two-band model used previously and described in references 30 and 46. The gap on the hole FS is isotropic, , while on the electron FS it is a function of the angle , with being the isotropic gap, and gives four equally spaced nodes. The impurity scattering is given by the concentration parameter , interband potential fraction (), and an intraband scattering phase shift (). The zero-temperature shift is not well-defined experimentally and is left as a free parameter. Below the temperature dependence is stronger and it is plausible that this can be associated with diamagnetic screening currents or vortex supercurrents which do not cancel as effectively in the intervortex region at low fields. At high temperature (), the discrepancy between our data and the model is likely due to thermal fluctuations of vortices that introduce a temperature dependence to the NMR lineshape in a region where vortices are being pinned. It is just in this region of temperature that slow field fluctuations from vortices are manifest in the linewidth, Fig. 5, and in spin-spin relaxation, discussed in the next section, Fig. 6. We observe a systematic trend in the data of increasing Knight shift, , with increasing field, Fig. 4, which might be accounted for by considering the vortex core contributions to the density of states.
From Fig. 3, in the temperature range where we can compare the Knight shift data with the theoretical model, we find that more or less all electronic gap structures that we have considered in the symmetry class can fit the data. One might say that the intermediate cases of anisotropic gaps with either minima or close nodes are less suitable, especially in the strong scattering case, leaving surprisingly a possibility of either an isotropically gapped electronic FS or one having a gap . A more reliable identification of the angular structure could be possible in lower magnetic fields ( inset in Fig.3(a)), but the analysis would be quite complicated due to the effects of vortices and diamagnetic screening currents. Different anisotropy parameters in this model give a reasonable coverage of the phase space of possibilities for the spectrum of quasiparticles. We checked that with a more realistic three dimensional Fermi surface and the gap suggested in Ref. Mazin et al., 2010 results do not change much (dashed line in the inset of Fig.3(a) that appear exactly between the isotropically gapped and purely nodal cases).
The linewidth of the central transition, Fig. 5, full-width-at-half-maximum (FWHM), was determined by fitting the spectra to a gaussian function. The fit deviates slightly near the wings but at low temperatures the lineshape appears to be symmetric. The linewidth increases with decreasing temperature in the normal state. Below , there is a decrease, followed by an upturn at 11 K in 11.6 T. These features closely parallel all of the aspects of the NMR linewidth previously reported by Chen et al. Chen et al. (2007, 2008) for 17O NMR on high quality single crystals of Bi2Sr2CaCu2O8+δ (BSCCO). For cuprate superconductorsAlloul et al. (2009); Chen et al. (2008) this similar behavior in the normal state was identified with impurities. Its classic signature is a Curie or Curie-Weiss temperature dependence to the linewidth and a constant Knight shift. The basic argument is that impurities introduce strong polarization of the nearby conduction electrons which produce a spatially oscillating spin density that couples through the hyperfine interaction to the nuclei (RKKY-interaction). Consequently, the average local field is not significantly perturbed, so the Knight shift is unaffected; but, a large distribution of Knight shifts gives a significant broadening of the NMR spectrum. The polarization of paramagnetic impurities is typically quite temperature dependent (Curie-like), and is the likely origin for the temperature dependence in the linewidth below K. At higher temperatures there is a possible additional temperature dependence from the activated process that is evident in the Knight shift shown in Fig. 2.
The success we have had with the above model in understanding the 17O NMR linewidth in BSCCO, Chen et al. (2008) serves as a guide for our interpretation of the impurity contributions to the 75As NMR linewidth in Ba(Fe0.93Co0.07)2As2. We focus on the range of temperature where the Knight shift is mainly temperature independent, K. We fit the linewidth to the following phenomenological relation,
| (2) |
Since there may also be a distribution of Knight shifts with a thermally-activated origin, we allow for this contribution with the additional term, , which goes beyond the impurity model used for BSCCO.Chen et al. (2008) Here, K, obtained from a fit to in the normal state with with parameters, , and . Overall, the fit is reasonable, capturing the essential characteristics of the normal state behavior of the linewidth with a reduction in the superconducting state as the impurity local field distribution becomes gapped following the temperature dependence of the Knight shift. Although impurity effects can account for the temperature dependent linewidth, we cannot comment on what type of impurity might be responsible.
The upturn of the linewidth at K in 11.6 T in the superconducting state is the mark of vortex freezing. It occurs at in T, and indicates that there is a substantial temperature range below where fluctuating vortices are in a liquid-like phase. We can compare this with YBa2Cu3O7-y (YBCO) Reyes et al. (1997) and overdoped BSCCO Chen et al. (2007) where vortex melting for the same magnetic field occurs at and respectively. Calculations of the melting transition in high magnetic fields for pnictide superconductors have been performed by Murray and Tesanovic Reid et al. (2010). However, a true, thermodynamic, vortex-liquid phase in Ba(Fe0.93Co0.07)2As2 would be surprising since both the mass anisotropyYamamoto et al. (2009) and are small ; for example, as compared to cuprate superconductors. It was argued by Yamamoto et al. Yamamoto et al. (2009) that a confluence of weak thermal fluctuations and a very broad distribution of pinning forces gives rise to an irreversibility field significantly less than the upper critical field in crystals of Ba(Fe0.9Co0.1)2As2. Generally the NMR spectrum is sensitive to field fluctuations on time scales slower than the Larmor precession period which is tens of nanoseconds in our case. Consequently, the sharp variation in the linewidth that we observe at suggests that vortex dynamics are slower than this for . To investigate this further, we have performed spin-spin relaxation experiments discussed in the next section.
Usually, the vortex contribution to the NMR or SR linewidthReyes et al. (1997); Sonier et al. (2000) is interpreted in terms of the penetration depth. In Ba(Fe0.93Co0.07)2As2 the linewidth broadening from the vortex solid state can be seen in Fig. 5 as a difference between data (represented by a black dashed line) and our model for the vortex free linewidth (solid blue curve) discussed above. The vortex component of our linewidth at the lowest temperatures, kHz ( gauss) is much less than predicted by Ginzburg-Landau theory Brandt (2003) which is 33 kHz for a penetration depth from SR of nm, Williams et al. (2010) or 15 kHz for the value, nm, from scanning SQUID and magnetic force measurements.Luan et al. (2010) The most likely reason for this discrepancy is c-axis vortex disorder discussed by Brandt. Brandt (1991) For example, at very low magnetic fields, T, this plane-to-plane disorder is well-established in BSCCO from SR and NMR measurements Inui and Harshman (1993); Chen et al. (2007); Mounce et al. (2010, 2010) and can be expected in Ba(Fe0.93Co0.07)2As2 since in-plane disorder and strong pinning has already been established by scanning probe measurements Luan et al. (2010); Yin et al. (2009) and small angle neutron scattering. Eskildsen et al. (2009)
IV Spin-spin Relaxation and Vortex Dynamics
To explore possible effects of vortex dynamics, already indicated in our NMR linewidth measurements, we have investigated spin-spin relaxation. There are two classes of spin relaxation experiments that we perform. The results measured by Hahn echo methods are presented in Fig. 6 and 7, and by the CPMG pulse sequence in Fig. 6 and 8. The nuclear spin dephasing times, and , from these experiments can be viewed semi-classically as a measure of field fluctuations along the direction of the applied magnetic field. The dephasing rate is a summation of contributions from spin-lattice relaxation (Redfield contribution), local fluctuations in the external magnetic field, and fluctuations in the internal fields such as those from the nuclear dipole-dipole interaction, or from vortex dynamics. The Hahn echo method is generally useful for homogeneous relaxation (all nuclei are equivalent) in a steady external field. However, if the local field fluctuates inhomogeneously, or there is nuclear spin diffusion in a spatially inhomogeneous steady field,Genack et al. (1975); yu80 then the CPMG method can be helpful in identifying the time scale of the fluctuations through variation of the spin refocusing time, (see the experimental methods section). Sigmund et al. (2001)
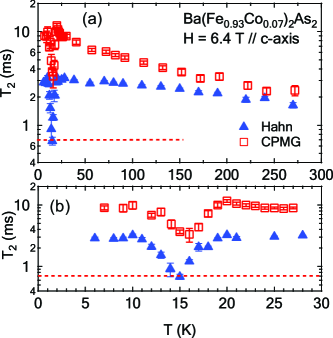
From our relaxation measurement data on Ba(Fe0.93Co0.07)2As2 shown in Fig. 6, it is immediately apparent that is significantly longer than and that in the normal state, both are much longer than the temperature independent dipolar contribution, ms, calculated from the rigid lattice limit, shown as a red dashed line. For all CPMG experiments shown here was set to be relatively short, s to s. We infer that significant dephasing takes place on time scales longer than s and, since this is in the normal state, the process responsible has nothing to do with vortices. Rather it is an indication of the presence of slow field fluctuations from an unidentified source. In fact, by varying the refocusing time, , we have determined that this dephasing is effectively eliminated in the CPMG results which we report here. We defer our discussion of the mechanism for the Hahn echo relaxation to later in this section.
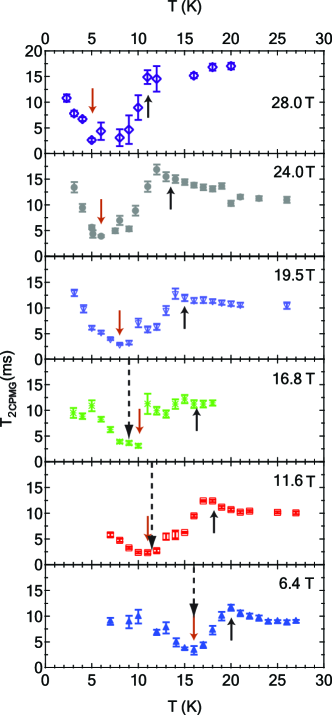
The temperature dependence of in the normal state can be understood from the temperature dependence of spin-lattice relaxation, through the Redfield contribution. Redfield (1967) This behavior can be expressed phenomenologically as, . Butterworth (1962) Taking from Ning et al. Ning et al. (2009) we find = 5.7 and ms, where is the spin-spin relaxation time after correction for this contribution. Since is long enough below ( 150 ms) we may take to be equal to in the superconducting state. Nonetheless, we find that there is a remarkable dip in both and in at , Fig. 6 to 8, which we identify with thermal fluctuations of vortices. This follows from the fact that the temperature of the minimum in coincides with the vortex freezing temperature apparent in the NMR linewidth, presented in Fig. 5 for 11.6 T and that this dip at appears just below the upper critical field, Fig. 9.
Vortex dynamics contribute similarly in these two types of spin-spin relaxation experiments although the contribution to the Hahn echo can be an order of magnitude larger than for the CPMG, especially at higher magnetic fields. This means that the principal fluctuation time scale must be of order , but longer than the refocusing time, s, in the CPMG measurement.
In previous work on 17O NMR in YBCO it was found that the spin-spin relaxation rate, , had a peak below . Bachman et al. (1998); Recchia et al. (1997); Suh et al. (1993); Curro et al. (2000); Krämer and Mehring (1999) Krämer et al. Krämer and Mehring (1999) proposed a dynamical charge-density-wave state in YBa2Cu3O7-δ coupled to the nucleus through the quadrupolar interaction. However, Bachman et al. Bachman et al. (1998) found that this peak was an artifice of vortex dynamics which become slow enough in the vortex solid to be observable in . They found a lorentzian component to the spectral density for field fluctuations that abruptly onsets at the irreversibility temperature. The fact that the onset temperature was magnetic field dependent indicated that the phenomenon was not related to a charge density wave. This argument holds equally well in the present case for Ba(Fe0.93Co0.07)2As2. Here, as for the cuprates, we associate the temperature of the maximum spin-spin relaxation rate (the dip in the relaxation time) with the temperature where the vortex dynamics rapidly slow down, i.e. the irreversibility temperature. For comparison, in Fig. 9 we plot, along with our data, the irreversibility curve from Prozorov et al. Prozorov et al. (2008) obtained at lower magnetic fields for similar crystals from the Ames Laboratory. Our data includes the temperatures of anomalies from the NMR linewidth (spectrum) and measurements we have discussed previously. The CPMG sequence was used to obtain at the higher magnetic fields, 20 T to 28 T because the Hahn echo experiment is adversely affected by magnetic field fluctuations endemic to high field resistive magnets. Sigmund et al. (2001) We also compare our measurements of the superconducting transition with those of Ni et al. Ni et al. (2008); Prozorov et al. (2008) providing a consistent vortex phase diagram for Ba(Fe0.93Co0.07)2As2.
Now we return to a discussion of the large we have observed, as compared with the expected temperature independent upper bound established by the nuclear dipole-dipole interaction, the red dashed line in Fig. 6. In order for to be longer than the dipole limit there must be some form of coherent averaging which in liquids is the well-known phenomenon of motional averaging. In metals there is a similar mechanism, a type of spin-motional averaging, which is attributable to a strong indirect interaction between adjacent nuclei, 75As in our case. Anderson and Weiss (1953); yu80 For this process to work the coupled nuclei must be resonant, that is to say they must have the same Larmor frequency to within the small band given by the bare nuclear dipole-dipole interaction. This requirement is imposed by the necessity to conserve energy in the spin ‘flip-flop’ process for spin-spin relaxation. The indirect interaction is a coupling between nuclei, mediated by the conduction electrons, involving an RKKY type polarization and the hyperfine interaction. For metallic elements with only one spin isotope this leads to averaging of the dipolar local fields, called exchange narrowing, and can substantially increase , a factor of 5.6 in the case of platinum. yu80 ; Alloul and Froidevaux (1968) For elements with more than one spin isotope the nuclei are non-resonant and the interaction leads to shorter than the dipolar limit, as is the case for thallium. From the theory of exchange narrowing Anderson and Weiss (1953) we have,
| (3) |
where is the frequency of the exchange interaction and is the bare dipolar interaction between nuclei. From this relation we find, kHz, which is larger than the 4 kHz, Alloul and Froidevaux (1968) observed for metallic platinum, but not unreasonably large given that 75As is 100 % naturally abundant as compared to 33.8 % for 195Pt. Although this explanation can account for the longer than expected from the dipolar interaction, it does not explain the shorter phase coherence time found from Hahn echo measurements as compared with the CPMG sequence.
There are two possibilities for the source of low frequency field fluctuations that could give rise to the difference between Hahn and CPMG results. In the first, we consider fluctuating magnetic fields, either from impurities or residual effects of the suppressed antiferromagnetism inherent to the BaFe2As2 system. However, it is hard to reconcile this explanation with our observation that is independent of magnetic field and temperature, as is evident in Fig. 7 after allowing for the vortex contribution. One might expect that thermally driven, magnetic field fluctuations would be both temperature and magnetic field dependent over the wide range we have covered. A second possibility is that the rather large indirect interaction leads to nuclear spin diffusion that produces dephasing in a locally inhomogeneous, static, magnetic field. We have estimated the diffusion coefficient from the indirect interactionRedfield et al. (1968); yu80 to be cm2/s which, in order to explain our Hahn echo results, would require an average magnetic field gradient of 1.5 107 G/cm. Associating a magnetic field inhomogeneity of this size with residual magnetism in the sample could provide the temperature independent mechanism that would be required to account for the Hahn echo results. The length scale for the distribution of such magnetism is constrained by the linewidth to be less than nm. Although it may seem that the latter explanation is the more likely, further work will be necessary to confirm or disprove either of these suggestions.
V Conclusion
We have studied 75As NMR spectra and spin-spin relaxation on a single
crystal of optimally doped Ba(Fe0.93Co0.07)2As2 from room
temperature to well below the superconducting transition temperature in
magnetic fields as high as 28 T. The temperature dependence of the Knight
shift is compatible with a general, two-band symmetry scenario for the superconducting
states. The details, nodes or full gap, cannot be determined from the present
work. Comparison with an elementary 2D model might indicate that the
order parameter in this compound has nodes but they have relatively
weak weight compared to the fully gapped portions of the Fermi surface.
We have identified a sharp signature of irreversibility in the temperature
dependence of our measured spin-spin relaxation from which we have established
a vortex phase diagram up to high magnetic fields. We have found that there
is a very strong indirect exchange interaction in this compound providing a
possible explanation for our observations of spin-spin relaxation attributed to
nuclear spin diffusion in static magnetic field gradients.
VI Acknowledgments
We thank C.A. Collett, W.J. Gannon, J. Li, and J. Pollanen for critical reading of the manuscript and acknowledge support from the Department of Energy, Basic Energy Sciences under Contracts No. DE-FG02-05ER46248 (Northwestern University) and No. DE-AC02-07CH11358 (Ames Laboratory). Work at high magnetic field was performed at the National High Magnetic Field Laboratory with support from the National Science Foundation and the State of Florida. A.B.V. acknowledges support from NSF grant DMR-0954342.
References
- Kamihara et al. (2008) Y. Kamihara, T. Watanabe, T. Hirano, and H. Hosono, J. Am. Chem. Soc. 130, 3296 (2008).
- (2) I. I. Mazin and J. Schmalian, Physica C 469, 614 (2009).
- (3) I. I. Mazin, D. J. Singh, M. D. Johannes, and M. H. Du, Phys. Rev. Lett. 101, 057003 (2008).
- (4) A. V. Chubukov, D. V. Efremov, and I. Eremin, Phys. Rev. B 78, 134512 (2008).
- (5) F. Wang, H. Zhai, Y. Ran, A. Vishwanath, and D.-H. Lee, Phys. Rev. Lett. 102, 047005 (2009).
- Ding et al. (2008) H. Ding, P. Richard, K. Nakayama, T. Arakane, Y. Sekiba, A. Takayama, S. Souma, T. Sato, T. Takahashi, Z. Wang, X. Dai, Z. Fang, G. F. Chen, J. L. Luo, and N. L. Wang, Europhys. Lett 83, 47001 (2008).
- Kondo et al. (2008) T. Kondo, A. F. Santander-Syro, O. Copie, C. Liu, M. E. Tillman, E. D. Mun, J. Schmalian, S. L. Bud’ko, M. A. Tanatar, P. C. Canfield,and A. Kaminski, Phys. Rev. Lett. 101, 147003 (2008).
- Terashima et al. (2009) K. Terashima, Y. Sekiba, J. H. Bowen, K. Nakayama, T. Kawahara, T. Sato, P. Richard, Y.-M. Xu, L. J. Li, G. H. Cao, Z.-A. Xu, H. Ding, and T. Takahashi, Proc. Natl. Acad. Sci. USA 106, 7330 (2009).
- Szabó et al. (2009) P. Szabó, Z. Pribulová, G. Pristás, S. L. Bud’ko, P. C. Canfield, and P. Samuely, Phys. Rev. B. 79, 012503 (2009).
- Mu et al. (2009) G. Mu, H. Luo, Z. Wang, L. Shan, C. Ren, and H. H. Wen, Phys. Rev. B. 79, 174501 (2009).
- Gordon et al. (2009) R. T. Gordon, N. Ni, C. Martin, M. A. Tanatar, M. D. Vannette, H. Kim, G. D. Samolyuk, J. Schmalian, S. Nandi, A. Kreyssig, A.I. Goldman, J. Q. Yan, S. L. Bud’ko, P. C. Canfield, and R. Prozorov, Phys. Rev. Lett 102, 127004 (2009).
- Martin et al. (2009) C. Martin, H. Kim, R.T. Gordon, N. Ni, V.G. Kogan, S.L. Bud’ko, P.C. Canfield, M.A. Tanatar, and R. Prozorov Phys. Rev. B 81, 060505 (2010).
- Fletcher et al. (2009) J. D. Fletcher, A. Serafin, L. Malone, J. G. Analytis, J.-H. Chu, A. S. Erickson, I. R. Fisher, and A. Carrington, Phys. Rev. Lett 102, 147001 (2009).
- Hicks et al. (2009) C. W. Hicks, T. M. Lippman, M. E. Huber, J. G. Analytis, J. H. Chu, A. S. Erickson, I. R. Fisher, and K. A. Moler, Phys. Rev. Lett 103, 127003 (2009).
- Fukazawa et al. (2009) H. Fukazawa, Y. Yamada, K. Kondo, T. Saito, Y. Kohori, K. Kuga, Y. Matsumoto, S. Nakatsuji, H. Kito, P. Shirage, K. Kihou, N. Takeshita, C. Lee, A. Iyo, and H. Eisaki, J. Phys. Soc. Jpn. 78, 083712 (2009).
- Jang et al. (2010) D. -J. Jang, A. B. Vorontsov, I. Vekhter, K. Gofryk, Z. Yang, S. Ju, J. B. Hong, J. H. Han, Y. S. Kwon, F. Ronning, J. D. Thompson, and Tuson Park (2010), URL arXiv.org:1011.4808v1.
- Gofryk et al. (2010) K. Gofryk, A. B. Vorontsov, I. Vekhter, A. S. Sefat, T. Imai, E. D. Bauer, J. D. Thompson, and F. Ronning, (2010), URL arXiv.org:1009.1091v1.
- Gofryk et al. (2010) K. Gofryk, A. S. Sefat, M. A. McGuire, B. C. Sales, D. Mandrus, J. D. Thompson, E. D. Bauer, and F. Ronning, Phys. Rev. B 81, 184518 (2010).
- (19) M. A. Tanatar, J.-P. Reid, H. Shakeripour, X. G. Luo, N. Doiron-Leyraud, N. Ni, S. L. Bud’ko, P. C. Canfield, R. Prozorov, and L. Taillefer, Phys. Rev. Lett. 104, 067002 (2010).
- Fischer et al. (2010) T. Fischer, A. V. Pronin, J. Wosnitza, K. Iida, F. Kurth, S. Haindl, L. Schultz, B. Holzapfel, and E. Schachinger, Phys. Rev. B 82, 224507 (2010).
- Luan et al. (2010) L. Luan, T. M. Lippman, C. W. Hicks, J. A. Bert, O. M. Auslaender, J. Chu, J. G. Analytis, I. R. Fisher, and K. A. Moler, (2010), URL arXiv.org:1012.3436v1.
- Kim et al. (2010) H. Kim, R. Gordon, M. Tanatar, J. Hua, U. Welp, W. Kwok, S. Bud’ko, P. Canfield, A. Vorontsov, and R. Prozorov (2010), URL arXiv.org:1003,2959v2.
- Mazin et al. (2010) I. I. Mazin, T. P. Devereaux, J. G. Analytis, J. H. Chu, I. R. Fisher, B. Muschler, and R. Hackl, Phys. Rev. B 82, 180502(R) (2010).
- Lobo et al. (2010) R. P. S. M. Lobo, Y. M. Dai, U. Nagel, T. Rõõm, J. P. Carbotte, T. Timusk, A. Forget, and D. Colson, Phys. Rev. B 82, 100506(R) (2010).
- (25) K. Kuroki, S. Onari, R. Arita, H. Usui, Y. Tanaka, H. Kontani, and H. Aoki, Phys. Rev. Lett. 101, 087004 (2008).
- (26) K. Seo, B. A. Bernevig, and J. Hu, Phys. Rev. Lett. 101, 206404 (2008).
- (27) T. A. Maier, S. Graser, D. J. Scalapino, and P. J. Hirschfeld, Phys. Rev. B 79, 224510 (2009).
- (28) A. V. Chubukov, M. G. Vavilov, and A. B. Vorontsov, Phys. Rev. B 80, 140515 (2009).
- (29) R. Thomale, C. Platt, J. Hu, C. Honerkamp, and B. A. Bernevig, Phys. Rev. B 80, 180505 (2009).
- Vorontsov and Vekhter (2010) A. B. Vorontsov and I. Vekhter Phys. Rev. Lett 105, 187004 (2010).
- (31) A.V. Chubukov and I. Eremin, Phys. Rev. B 82, 060504(R) (2010).
- (32) S. Graser, A. F. Kemper, T. A. Maier, H. P. Cheng, P. J. Hirschfeld, and D. J. Scalapino, Phys. Rev. B 81, 214503 (2010).
- (33) S. Graser, T. A. Maier, P. J. Hirschfeld, and D. J. Scalapino, New J Phys 11, 025016 (2009a).
- (34) P. Goswami, P. Nikolic, and Q. Si, Europhys. Lett. 91, 37006 (2010).
- Yosida (1958) K. Yosida, Phys. Rev. 110, 769 (1958).
- Zheng et al. (2002) G.-q. Zheng, H. Ozaki, Y. Kitaoka, P. Kuhns, and A.P. Reyes, and W.G. Moulton, Phys. Rev. Lett 88, 077003 (2002).
- Ni et al. (2008) N. Ni, M. E. Tillman, J.-Q. Yan, A. Kracher, S. T. Hannahs, S. L. Bud’ko, and P. C. Canfield, Phys. Rev. B 78, 214515 (2008).
- Sigmund et al. (2001) E. E. Sigmund, E. S. Calder, G. W. Thomas, V. F. Mitrovic, H. N. Bachman, W. P. Halperin, P. L. Kuhns, and A. P. Reyes, J. Mag. Res. 148, 309 (2001).
- Ning et al. (2009) F. Ning, K. Ahilan, T. Imai, A. Sefat, R. Jin, M. McGuire, B. Sales, and D. Mandrus, J. Phys. Soc. Jpn. 78, 013711 (2009).
- Mukhopadhyay et al. (2009) S. Mukhopadhyay, S. Oh, A. Mounce, M. Lee, W. Halperin, N. Ni, S. Bud’ko, P. Canfield, A. Reyes, and P. Kuhns, New J. Phys. 11, 055050 (2009).
- Alloul et al. (2009) H. Alloul, J. Bobroff, M. Gabay, and P. Hirschfeld, Rev. Mod. Phys. 81, 45 (2009).
- Chen et al. (2008) B. Chen, S. Mukhopadhyay, W. P. Halperin, P. Guptasarma, and D. G. Hinks, Phys. Rev. B 77, 052508 (2008).
- Kitagawa et al. (2008) K. Kitagawa, N. Katayama, K. Ohgushi, M. Yoshida, and M. Takigawa, J. Phys. Soc. Jpn. 77, 114709 (2008).
- Takigawa et al. (1991) M. Takigawa, A. P. Reyes, P. C. Hammel, J. D. Thompson, R. H. Heffner, Z. Fisk, and K. C. Ott, Phys. Rev. B 43, 247 (1991).
- Hardy et al. (1993) W. N. Hardy, D. A. Bonn, D. C. Morgan, R. Liang, and K. Zhang, Phys. Rev. Lett 70, 3999 (1993).
- (46) V. Mishra, A. Vorontsov, P. J. Hirschfeld, and I. Vekhter, Phys. Rev. B 80, 224525 (2009a).
- Chen et al. (2007) B. Chen, W. P. Halperin, P. Guptasarma, D. Hinks, V. Mitrovic, A. Reyes, and P. Kuhns, Nature Physics 3, 239 (2007).
- Reyes et al. (1997) A. P. Reyes, X. P. Tang, H. N. Bachman, W. P. Halperin, J. A. Martindale, and P. C. Hammel, Phys. Rev. B 55, 14737 (1997).
- Reid et al. (2010) J. M. Murray,and Z. Tesanovic, Phys. Rev. Lett. 105, 037006 (2010).
- Yamamoto et al. (2009) A. Yamamoto, J. Jaroszynski, C. Tarantini, L. Balicas, J. Jiang, A. Gurevich, D. C. Larbalestier, R. Jin, A. S. Sefat, M. A. McGuire, B. C. Sales, D. K Christen, and D. Mandrus, Appl. Phys. Lett. 94, 062511 (2009).
- Sonier et al. (2000) J. Sonier, J. Brewer, andf R. Kiefl, Rev. Mod. Phys. 72, 269 (2000).
- Brandt (2003) E. H. Brandt, Phys. Rev. B 68, 054506 (2003).
- Williams et al. (2010) T. J. Williams, A. A. Aczel, E. Baggio-Saitovitch, S. L. Bud’ko, P. C. Canfield, J. P. Carlo, T. Goko, H. Kageyama, A. Kitada, J. Munevar, N. Ni, S. R. Saha, K. Kirschenbaum, J. Paglione, D. R. Sanchez-Candela, Y. J. Uemura, and G. M. Luke, Phys. Rev. B 82, 094512 (2010).
- Luan et al. (2010) L. Luan, O. M. Auslaender, T. M. Lippman, C. W. Hicks, B. Kalisky, J. H. Chu, J. G. Analytis, I. R. Fisher, J. R. Kirtley, and K. A. Moler, Phys. Rev. B 81, 100501 (2010).
- Brandt (1991) E. H. Brandt, Phys. Rev. Lett. 66, 3213 (1991).
- Inui and Harshman (1993) M. Inui and D. R. Harshman, Phys. Rev. B. 47, 12205 (1993).
- Mounce et al. (2010) A. M. Mounce, S. Oh, S. Mukhopadhyay, W. P. Halperin, A. P. Reyes, P. Kuhns, K. Fujita, M. Ishikado, and S. Uchida, Nature Physics, DOI:10.1038/nphys1835.
- Mounce et al. (2010) A. M. Mounce, S. Oh, S. Mukhopadhyay, W. P. Halperin, A. P. Reyes, P. Kuhns, K. Fujita, M. Ishikado, and S. Uchida, (2010), URL arXiv.org:1011.1520v1.
- Yin et al. (2009) Y. Yin, M. Zech, T. L. Williams, X. F. Wang, G. Wu, X. H. Chen, and J. E. Hoffman, Phys. Rev. Lett. 102, 097002 (2009).
- Eskildsen et al. (2009) M. R. Eskildsen, L. Y. Vinnikov, T. D. Blasius, I. S. Veshchunov, T. M. Artemova, J. M. Densmore, C. D. Dewhurst, N. Ni, A. Kreyssig, S.L. Bud’ko, P. C. Canfield, and A. I. Goldman, Phys. Rev. B 79, 100501 (2009).
- Genack et al. (1975) A. Z. Genack, and A. G. Redfield, Phys. Rev. B 12, 78 (1975).
- (62) I. Yu, A.A.V. Gibson, E.R. Hunt, and W.P. Halperin, Phys. Rev. Lett. 44, 348 (1980); I. Yu and W.P. Halperin, Phys. Rev. B 47, 15830 (1993).
- Redfield (1967) A. G. Redfield, Phys. Rev. 162, 367 (1967).
- Butterworth (1962) J. Butterworth, Phys. Rev. Lett. 8, 423 (1962).
- Bachman et al. (1998) H. N. Bachman, A. P. Reyes, V. F. Mitrovic, W. P. Halperin, A. Kleinhammes, P. Kuhns, and W. G. Moulton, Phys. Rev. Lett. 80, 1726 (1998).
- Recchia et al. (1997) C. H. Recchia, J. A. Martindale, C. H. Pennington, W. L. Hults, and J. L. Smith, Phys. Rev. Lett 78, 3543 (1997).
- Suh et al. (1993) B. J. Suh, D. R. Torgeson, and F. Borsa, Phys. Rev. Lett 71, 3011 (1993).
- Curro et al. (2000) N. J. Curro, C. Milling, J. Haase, and C. P. Slichter, Phys. Rev. B. 62, 3473 (2000).
- Krämer and Mehring (1999) S. Krämer and M. Mehring, Phys. Rev. Lett 83, 396 (1999).
- Prozorov et al. (2008) R. Prozorov, N. Ni, M.A. Tanatar, V.G. Kogan, R.T. Gordon, C. Martin, E.C. Blomberg, P. Prommapan, J.Q. Yan, S.L. Bud’ko, P.C. Canfield, Phys. Rev. B 78, 224506 (2008).
- Anderson and Weiss (1953) P. W. Anderson and P. R. Weiss, Rev. Mod. Phys. 25, 269 (1953).
- Alloul and Froidevaux (1968) H. Alloul and C. Froidevaux, J. App. Phys. 39, 1322 (1968).
- Redfield et al. (1968) A. G. Redfield, and W. N. Yu, Phys. Rev. 169, 443 (1968).
VII Figure Captions