Chemical composition of evolved stars in the open cluster IC 4651††thanks: Based on observations collected at ESO telescopes under programmes 65.N-0286 and in part 169.D-0473
Abstract
We present an analysis of high-resolution spectra of three core-helium-burning ‘clump’ stars and two first ascent giants in the open cluster IC 4651. Atmospheric parameters (, log , , and [Fe/H]) were determined in our previous study by Carretta et al. (2004). In this study we present abundances of C, N, O and up to 24 other chemical elements. Abundances of carbon were derived using the Swan (0,1) band head at 5635.5 Å. The wavelength interval 7980–8130 Å, with strong CN features, was analysed in order to determine nitrogen abundances and isotope ratios. The oxygen abundances were determined from the [O i] line at 6300 Å. Compared with the Sun and other dwarf stars of the Galactic disk, mean abundances in the investigated clump stars suggest that carbon is depleted by about 0.3 dex, nitrogen is overabundant by about 0.2 dex and oxygen is close to solar. This has the effect of lowering the mean C/N ratio to . The mean ratios are lowered to . Other investigated chemical elements have abundance ratios close to the solar ones.
keywords:
stars: abundances – stars: atmospheres – stars: horizontal branch – open clusters and associations: individual: IC 4651.1 Introduction
This work is continuing our efforts in studying evolutionary abundance alterations in evolved stars of open clusters (Tautvaišienė et al. 2000, 2005; Mikolaitis et al. 2010). Our main aim is to determine detailed elemental abundances of carbon, nitrogen and oxygen, and carbon isotope ratios in stars of open clusters in order to better understand reasons of abundance alterations caused by stellar evolution. Information on abundances of heavier chemical elements will be used for deriving the time evolution of abundances in the Galactic disk under the Bologna Open Cluster Chemical Evolution (BOCCE) study (Bragaglia & Tosi 2006, Carretta et al. 2007, and references therein). In this work, our target of investigations is the open cluster IC 4651.
The open cluster IC 4651 is an intermediate-age (1.7 Gyr) open cluster located 140 pc below the Galactic plane and 7.1 kpc form the Galactic centre (Meibom et al. 2002; Pasquini et al. 2004). Meibom et al. (2002) provided calculations of the space motion and the Galactic orbit of the cluster. The orbital eccentricity is and the mean radius of galactocentric orbit is 8.6 kpc, its maximum distance from the Galactic plane is 190 pc ().
Results of extensive photometric studies were published first by Eggen (1971) and Lindoff (1972) and later on by Anthony-Twarog & Twarog (1987, 2000), Anthony-Tworag et al. (1988). However, the most recent photometric study was performed by Meibom (2000) and Meibom et al. (2002). They combined photometric observations and radial velocity measurements for the 44 single member stars down to mag and determined mag, the distance kpc, and the mean radial velocity equal to km s-1. It was found that 37% of giant members are spectroscopic binaries with periods up to 5000 days, and 52% of the main-sequence and turn-off members are binaries with periods less than 1000 days. The estimated total mass of IC 4651 is (Meibom et al. 2002). The turn-off mass of the IC 4651 stars was obtained by Carretta et al. (2004) reading the turn-off values on the Girardi et al. (2000) isochrones for solar metallicity at the age of the cluster of 1.7 Gyr as determined by Meibom et al. (2002).
There were several photometric studies that evaluated the metallicity of IC 4651. Based on photometry, was found by Anthony-Twarog & Twarog (1987), by Nissen (1988), and by Anthony-Twarog & Twarog (2000).
High resolution spectroscopic data started to appear in the beginning of the millennium. Bragaglia et al. (2001) determined the mean metallicity of five evolved stars . Pasquini et al. (2004) provided the cluster metallicity from the analysis of 22 faint main sequence stars of the cluster. Abundances of the iron peak, -elements and lithium were investigated in their study as well. Carretta et al. (2004) found the average for 5 evolved stars of the cluster, which we analyse further in this our work. Pace at al. (2008) provided the abundance measurements of Fe, Ca, Na, Ni, Ti, Al, Cr, Si for 20 solar-type stars belonging to IC 4651 and found . And finally, Santos et al. (2009) derived the mean metallicity for IC 4651 from five dwarf stars.
In our work for the open cluster IC 4651, the detailed abundance analysis of almost 30 chemical elements is done. Abundances of such key chemical elements as , , N, O as well as representatives of s- and r-processes are determined.
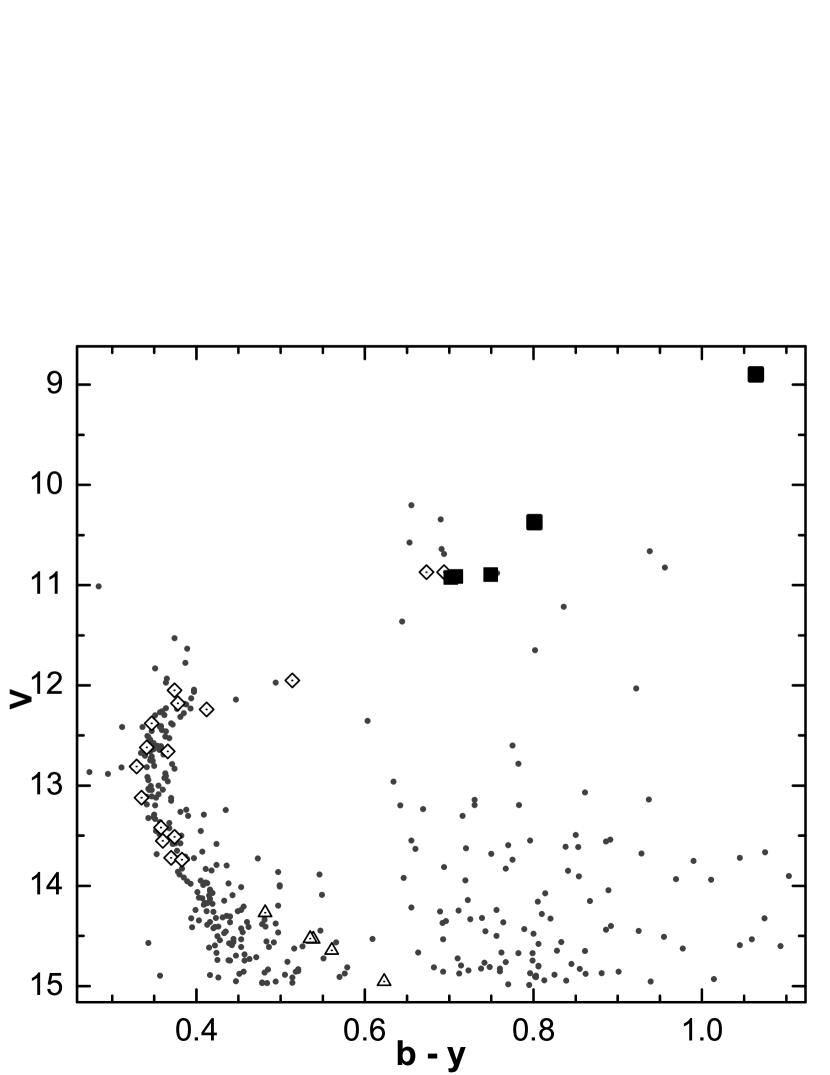
The colour-magnitude diagramme of IC 4651 with the stars analysed in three most comprehensive chemical abundance studies (Pasquini et al. 2004; Pace et al. 2008 and this work) indicated is presented in Fig. 1.
2 Observations and method of analysis
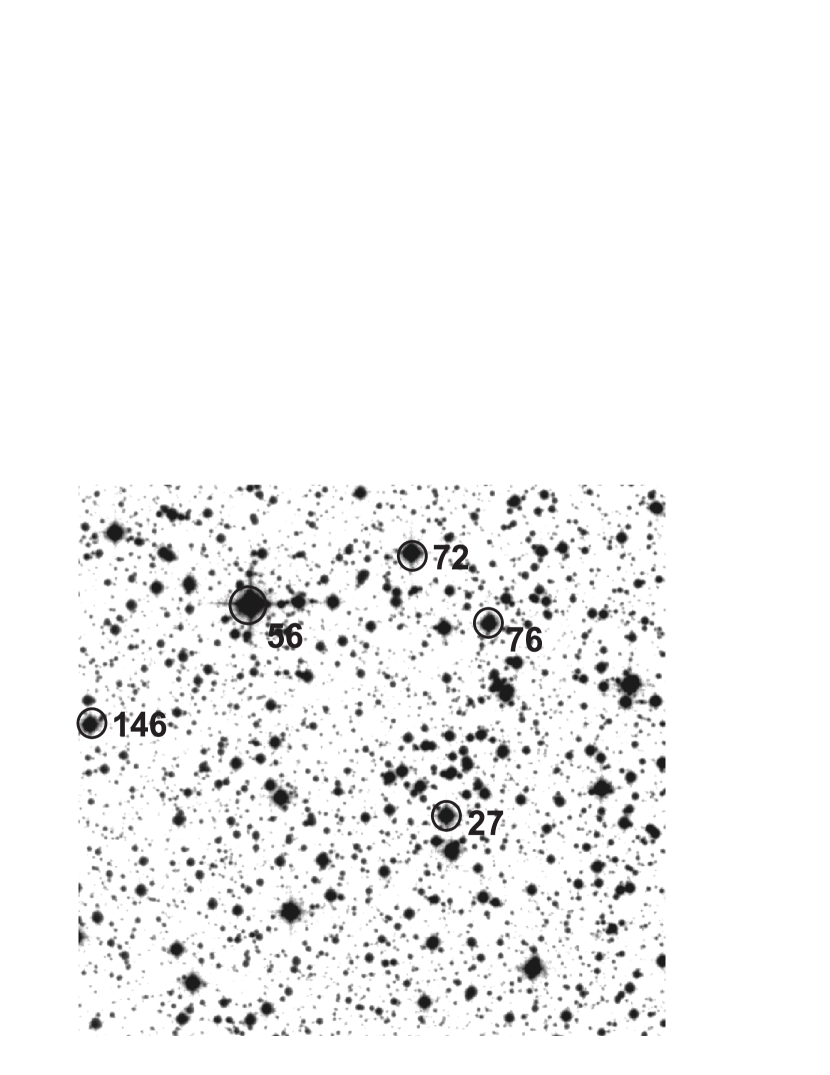
The spectra of five cluster stars (IC 4651 27, 56, 72, 76 and 146) were obtained with the spectrograph FEROS (Fiber-fed Extended Range Optical Spectrograph) mounted at the 1.5 m telescope in La Silla (Chile). The resolving power is and the wavelength range is 3700–8600 Å. Three stars (27, 76, 146) belong to the red clump of the cluster, the IC 4651 72 star is a first-ascent giant, and the star 56 is an RGB-tip giant (see Fig. 1). The finding chart of the investigated stars is shown in Fig. 2. The log of observations and S/N are presented in the paper by Carretta at al. (2004).
In the same paper by Carretta et al. (2004), all the main atmospheric parameters for the observed stars were determined. For the convenience we present them in this paper as well (Table 1). The effective temperatures were derived by minimizing the slope of the abundances from neutral Fe i lines with respect to the excitation potential. Using the line-depth ratios (LDR) technique, Biazzo et al. (2007) have determined higher effective temperatures for other clump stars in NGC 4651 and have raised doubts that the temperature determinations by Carretta et al. were likely too low. We have checked dependences of the other chemical element lines with respect to the excitation potential and did not find slopes. Thus, we do not doubt in the correctness of effective temperature determinations for IC 4651 giants by Carretta et al.
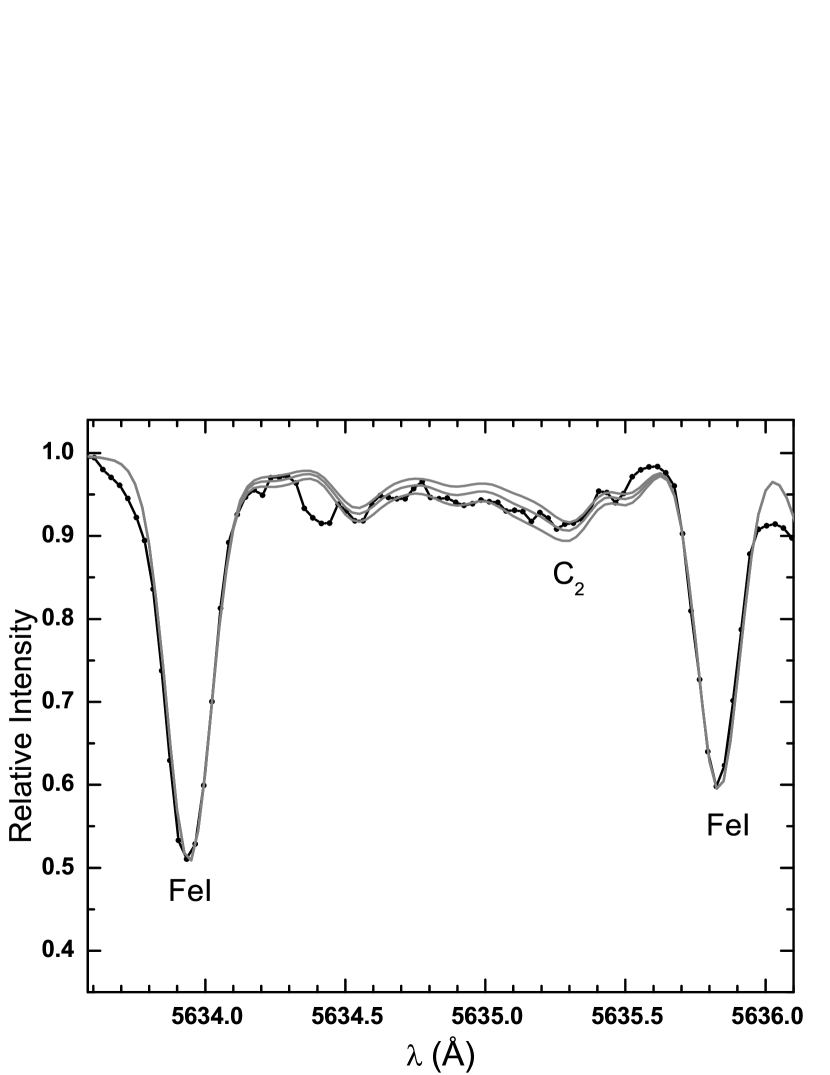
The gravities (log ) were derived by Carretta et al. from the iron ionization equilibrium. In our study we found a very good agreement between neutral and singly ionised species of Cr and Ti, which strongly support the reliability of the atmospheric parameters, in particular the gravity values derived from the ionization equilibrium of Fe. The microturbulent velocities were determined assuming a relation between log and . The ATLAS models with overshooting were used for the analysis. The Fe i lines were restricted to the spectral range 5500–7000 Å in order to minimize problems of line crowding and difficulties in the continuum tracing blue-ward. Two examples of spectra are presented in Fig. 3. For more details and error estimates, see Carretta et al.

|
∗ Star numbers, and from Lindoff (1972)
In this work we used the same method of analysis as in Mikolaitis et al. (2010, Paper I). Here we will remind only some details.
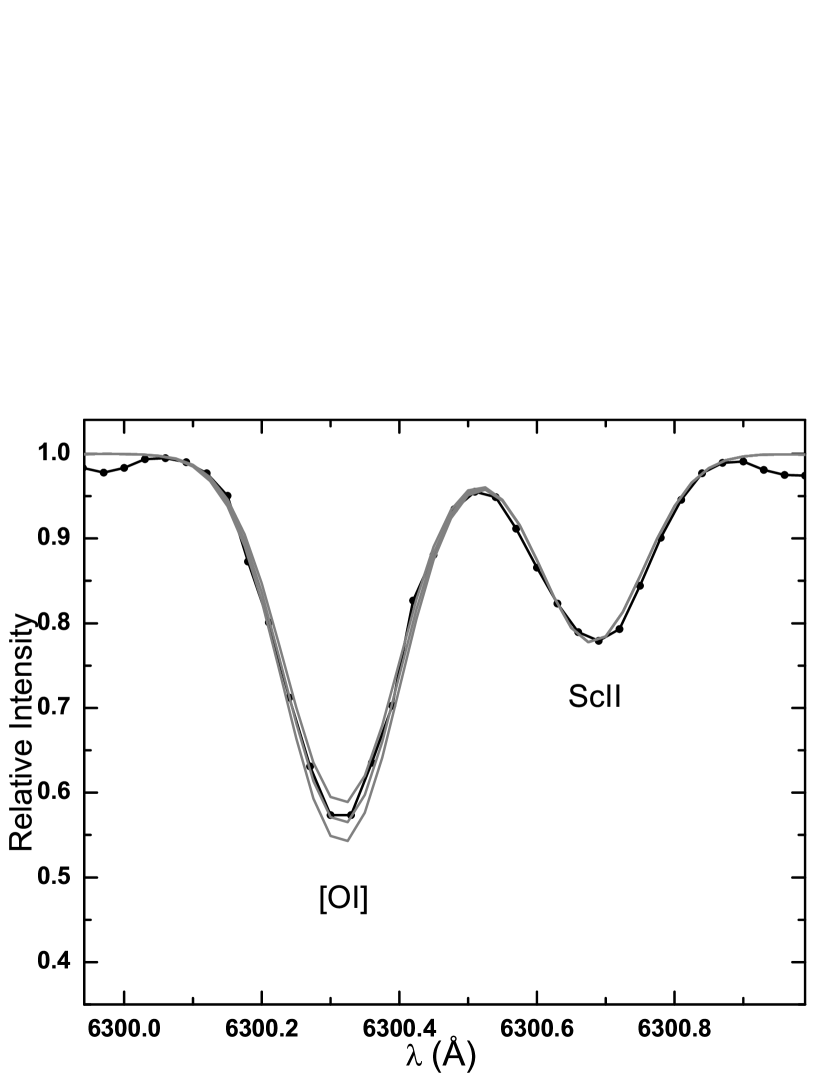
For the determination we calculated the 5632 – 5636 Å interval to compare with observations of Swan 0 – 1 band head at 5630.5 Å. The interval 7980 – 8130 Å contains strong and features, so it was used for the nitrogen abundance and ratio analysis. We derived the oxygen abundance from synthesis of the forbidden [O i] line at 6300 Å. The values for and isotopic line components, which blend the oxygen line, were taken from Johansson et al. (2003). In the spectra of IC 4651 stars the [O i] line was not contaminated by telluric lines.
|
The abundances of Na and Mg were determined with NLTE taken into account as described by Gratton et al. (1999). Abundances of sodium were determined from equivalent widths of the Na i lines at 5688.22 Å, 6154.23 Å and 6160.75 Å; magnesium from the Mg i lines at 4730.04 Å, 5711.09 Å, 6318.71 Å, 6319.24 Å; and aluminum from the Al i lines at 6696.03 Å, 6698.67 Å, 7835.30 Å and 7836.13 Å.
The determination of zirconium, yttrium, barium, lanthanum, cerium, neodymium and europium abundances were performed by spectral synthesis method. The zirconium abundances were derived using the Zr i lines at 4687 Å and 6127 Å. We adopted the barium hyperfine structure and isotopic composition for the Ba ii lines at 5853 Å and 6141 Å from McWilliam (1998) and for the line at 6496 Å from Mashonkina & Gehren (2000). The lanthanum abundances were determined from La ii lines at 6320 Å and 6390 Å, cerium from the Ce ii lines at 5274 Å and 6043 Å. The neodymium abundance was determined using atomic parameters presented by Den Hartog & Lawler (2003). Due to line crowding in the region of neodymium lines, only three Nd ii lines were chosen: 5092 Å, 5249 Å and 5319 Å. The europium abundances were determined using the Eu ii line at 6645 Å. A hyperfine structure for the Eu ii line was also used for the line synthesis.
| 27 | 56 | 72 | 76 | 146 | Mean | |||||||||||||||||
|---|---|---|---|---|---|---|---|---|---|---|---|---|---|---|---|---|---|---|---|---|---|---|
| Species | [El/H] | [El/H] | [El/H] | [El/H] | [El/H] | [El/Fe] | ||||||||||||||||
| C (C2) | –0.15 | 1 | –0.64 | 1 | –0.12 | 2 | –0.17 | 1 | –0.15 | 1 | –0.26 | 0.02 | ||||||||||
| N (CN) | 0.36 | 0.07 | 24 | –0.09 | 0.11 | 18 | 0.35 | 0.07 | 24 | 0.30 | 0.06 | 24 | 0.27 | 0.09 | 23 | 0.21 | 0.04 | |||||
| O ([O I]) | 0.05 | 1 | –0.27 | 1 | 0.09 | 1 | 0.16 | 1 | 0.18 | 1 | 0.01 | 0.06 | ||||||||||
| Na i | 0.09 | 0.05 | 3 | –0.25 | 0.02 | 3 | 0.10 | 0.04 | 3 | 0.10 | 0.05 | 3 | 0.07 | 0.04 | 3 | –0.02 | 0.01 | |||||
| Mg i | 0.05 | 0.07 | 4 | –0.40 | 0.08 | 4 | 0.05 | 0.09 | 4 | 0.09 | 0.05 | 4 | 0.08 | 0.09 | 4 | –0.04 | 0.03 | |||||
| Al i | 0.11 | 0.05 | 4 | –0.22 | 0.07 | 4 | 0.13 | 0.02 | 4 | 0.17 | 0.04 | 4 | 0.09 | 0.03 | 4 | 0.02 | 0.03 | |||||
| Si i | 0.25 | 0.08 | 9 | –0.35 | 0.09 | 6 | 0.25 | 0.10 | 8 | 0.20 | 0.07 | 9 | 0.21 | 0.09 | 9 | 0.12 | 0.03 | |||||
| Ca i | 0.17 | 0.05 | 9 | –0.28 | 0.08 | 6 | 0.13 | 0.09 | 10 | 0.17 | 0.09 | 8 | 0.17 | 0.10 | 8 | 0.05 | 0.04 | |||||
| Sc ii | 0.17 | 0.02 | 9 | –0.50 | 0.05 | 9 | 0.14 | 0.06 | 8 | 0.15 | 0.06 | 9 | 0.18 | 0.05 | 9 | 0.05 | 0.03 | |||||
| Ti i | 0.25 | 0.08 | 24 | –0.20 | 0.07 | 9 | 0.23 | 0.09 | 24 | 0.18 | 0.08 | 26 | 0.21 | 0.10 | 28 | 0.11 | 0.03 | |||||
| Ti ii | 0.21 | 0.09 | 6 | –0.30 | 0.09 | 8 | 0.19 | 0.07 | 7 | 0.23 | 0.09 | 11 | 0.14 | 0.09 | 11 | 0.08 | 0.04 | |||||
| V i | 0.20 | 0.07 | 9 | –0.58 | 0.02 | 9 | 0.17 | 0.09 | 5 | 0.25 | 0.05 | 9 | 0.27 | 0.04 | 9 | 0.11 | 0.05 | |||||
| Cr i | 0.10 | 0.05 | 19 | –0.51 | 0.06 | 11 | 0.08 | 0.09 | 25 | 0.10 | 0.09 | 24 | 0.10 | 0.09 | 24 | –0.01 | 0.02 | |||||
| Cr ii | 0.05 | 0.04 | 6 | –0.50 | 0.05 | 6 | 0.00 | 0.09 | 9 | 0.08 | 0.09 | 6 | 0.07 | 0.04 | 6 | –0.06 | 0.05 | |||||
| Mn i | 0.20 | 0.04 | 6 | –0.47 | 0.01 | 6 | 0.21 | 0.05 | 5 | 0.15 | 0.01 | 6 | 0.18 | 0.06 | 6 | 0.07 | 0.03 | |||||
| Co i | 0.25 | 0.07 | 8 | –0.18 | 0.09 | 5 | 0.20 | 0.07 | 9 | 0.24 | 0.08 | 8 | 0.27 | 0.08 | 8 | 0.13 | 0.04 | |||||
| Ni i | 0.17 | 0.08 | 34 | –0.25 | 0.10 | 30 | 0.20 | 0.09 | 34 | 0.17 | 0.07 | 36 | 0.17 | 0.08 | 36 | 0.07 | 0.01 | |||||
| Cu i | 0.05 | 0.06 | 3 | –0.33 | 0.07 | 3 | 0.08 | 0.02 | 3 | 0.16 | 0.01 | 3 | 0.10 | 0.02 | 3 | –0.01 | 0.05 | |||||
| Zn i | 0.00 | 0.06 | 2 | –0.28 | 0.02 | 2 | 0.10 | 0.09 | 2 | 0.07 | 0.07 | 2 | 0.07 | 0.08 | 2 | –0.05 | 0.03 | |||||
| Y ii | 0.07 | 0.05 | 6 | –0.25 | 0.03 | 6 | 0.10 | 0.04 | 6 | 0.04 | 0.01 | 6 | 0.14 | 0.04 | 6 | –0.02 | 0.05 | |||||
| Zr i | 0.03 | 0.08 | 2 | –0.34 | 0.01 | 2 | 0.00 | 0.05 | 2 | 0.04 | 0.02 | 2 | 0.00 | 0.05 | 2 | –0.09 | 0.03 | |||||
| Ba ii | 0.03 | 0.03 | 3 | –0.29 | 0.04 | 2 | 0.08 | 0.07 | 3 | 0.05 | 0.05 | 3 | 0.05 | 0.05 | 3 | –0.06 | 0.01 | |||||
| La ii | 0.18 | 0.02 | 2 | –0.33 | 0.02 | 2 | 0.10 | 0.05 | 2 | 0.15 | 0.03 | 2 | 0.15 | 0.05 | 2 | 0.03 | 0.05 | |||||
| Ce ii | 0.22 | 0.08 | 2 | –0.30 | 0.02 | 2 | 0.20 | 0.07 | 2 | 0.24 | 0.01 | 2 | 0.20 | 0.07 | 2 | 0.11 | 0.03 | |||||
| Nd ii | 0.27 | 0.08 | 3 | –0.18 | 0.04 | 2 | 0.28 | 0.06 | 3 | 0.15 | 0.05 | 3 | 0.18 | 0.03 | 3 | 0.11 | 0.06 | |||||
| Eu ii | 0.14 | 1 | –0.25 | 1 | 0.10 | 1 | 0.13 | 1 | 0.10 | 1 | 0.01 | 0.03 | ||||||||||
| C/N | 1.23 | 1.12 | 1.34 | 1.35 | 1.5 | 1.36 | 0.11 | |||||||||||||||
| 12C/13C | 17 | 14 | 15 | 14 | 18 | 16 | 2 | |||||||||||||||
2.1 Estimation of uncertainties
The sources of uncertainty were described in detail in our Paper I.
The sensitivity of the abundance estimates to changes in the atmospheric parameters by the assumed errors ( K for , dex for log and for ) is illustrated for the star IC 4651 72 (Table 2). It is seen that possible parameter errors do not affect the abundances seriously; the element-to-iron ratios, which we use in our discussion, are even less sensitive. The sensitivity of iron abundances to stellar atmospheric parameters were described in Carretta et al. (2004).
The scatter of the deduced line abundances , presented in Table 3, gives an estimate of the uncertainty due to the random errors, e.g. in continuum placement and the line parameters (the mean value of is ). Thus the uncertainties in the derived abundances that are the result of random errors amount to approximately this value.
Since abundances of C, N and O are bound together by the molecular equilibrium in the stellar atmosphere, we have also investigated how an error in one of them typically affects the abundance determination of another. causes and , causes and , has no effect on either the carbon or the oxygen abundances.
3 Results and discussion
The abundances relative to hydrogen [El/H]111In this paper we use the customary spectroscopic notation [X/Y] and (the line-to-line scatter) derived for up to 27 neutral and ionized species (including 13C) for the programme stars are listed in Table 3. The average cluster abundances [El/Fe] and dispersions about the mean values for IC 4651 are presented in Table 3 as well. They are calculated from the results determined for the stars 27, 72, 76 and 146. Due to the different [Fe/H], which is by 0.4 dex lower than of other cluster stars, the star 56 was not used in the average calculations even though its values do not change the average abundances much. For the majority of the chemical elements the changes are just dex, only for Si i and Sc ii the difference is 0.04 dex, and for V i – 0.07 dex. From its element to iron ratios, C/N and ratios, this star within errors of uncertainties is indistinguishable from other evolved stars of this cluster. However, we think that with more adequate model atmospheres this star can be investigated more accurately. In Fig. 4 we show an example of spectrum syntheses for the [O i] line in IC 4651 56. In Fig. 3 a sample of its spectrum is shown as well.
In IC 4651, the majority of investigated chemical elements have abundance ratios close to the solar ones. The mean cluster [ (s.d.), which is close to the solar value.
Abundances of Na i, Al i, Si i, Ca i, Ti i and Ni i were determined for the main-sequence stars of IC 4651 by Pace et al. (2008). The mean [El/Fe] ratios in these stars are very close to solar as well.
Pasquini et al. (2004) investigated spectra of both giants and main-sequence stars in IC 4651. The authors expressed their strong believe that [Na/Fe] ratio is comprehensively higher in the giants in comparison to the main-sequence stars and that this is due to internal nucleosynthesis and mixing. However, neither Pace et al. (2008), neither our study may confirm this statement. In Table 3, we present the mean [El/Fe] for giant and main-sequence stars of IC 4651 investigated in our work, Pasquini et al. (2004) and Pace et al. (2008). In our work, the abundances of Na and Mg were determined with NLTE taken into account, and we do not find an overabundance of these chemical elements.
In Fig. 4 of Paper I, we presented the radial distribution of some elemental abundances for BOCCE clusters analysed so far, and for others in recent studies. IC 4651 agrees well with results of other open clusters at the same of 7.1 kpc.
| This work | Pasquini | Pace | ||||
|---|---|---|---|---|---|---|
| Species | [El/Fe] | [El/Fe] | [El/Fe] | [El/Fe] | ||
| G | G | MS | MS | |||
| Na i | 0.00 | 0.19 | –0.09 | –0.03 | ||
| Mg i | –0.05 | 0.09 | 0.13 | |||
| Al i | 0.03 | 0.07 | –0.07 | –0.10 | ||
| Si i | 0.09 | 0.08 | 0.07 | –0.02 | ||
| Ca i | 0.05 | 0.00 | 0.04 | 0.04 | ||
| Sc ii | 0.01 | 0.11 | –0.11 | |||
| Ti i | 0.11 | 0.12 | 0.08 | –0.02 | ||
| Ti ii | 0.07 | 0.18 | 0.00 | |||
| Cr i | –0.05 | –0.02 | 0.11 | |||
| Ni i | 0.07 | 0.10 | 0.01 | –0.02 | ||
In the following sections we will discuss in more detail the results of carbon and nitrogen abundance determinations.
3.1 Carbon and nitrogen abundances
The average value of carbon to iron ratio in IC 4651 is . In Fig. 5, a fit to the IC 4651 27 spectrum at 5635.5 Å is shown.
We compared the carbon abundance in IC 4651 with carbon abundances determined for dwarf stars in the Galactic disk. Shi et al. (2002) performed an abundance analysis of carbon for a sample of 90 F and G type main-sequence disk stars using C i and [C i] lines and found [C/Fe] to be about solar at the solar metallicity. Roughly solar carbon abundances were found by Gustafsson et al. (1999) who analysed a sample of 80 late F and early G type dwarfs using the forbidden [C i] line. The ratios of [C/Fe] in our stars lie about 0.3 dex below the values obtained for dwarf stars of the Galactic disk.
The mean nitrogen to iron abundance ratio in IC 4651 is . This shows that nitrogen is overabundant in these evolved stars of IC 4651, since [N/Fe] values in the Galactic main-sequence stars are about solar at the solar metallicity (c.f. Shi et al. 2002). Unfortunately, neither carbon, neither nitrogen abundances were investigated in the main sequence stars of IC 4651 by Pace et al. (2008) and Pasquini et al. (2004).
The mean C/N ratios in IC 4651 is equal to . The smallest value of was obtained for the star IC 4651 56.
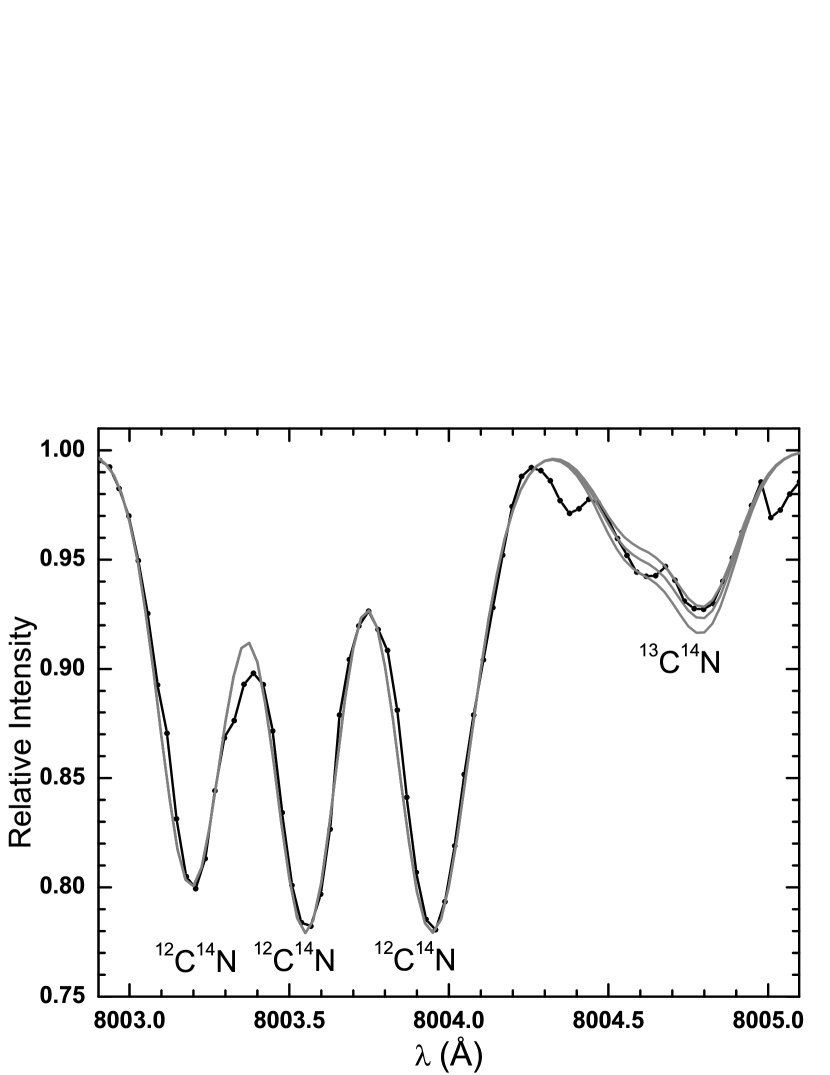
The ratios were determined for all programme stars from the (2,0) feature at 8004.728 Å. In Fig. 6 we show a small region of IC 4651 72 spectrum together with spectral syntheses obtained with three different values of the carbon isotopic ratio. We find that the mean ratios are about in the evolved stars investigated.
The solar carbon and nitrogen abundances used in our work are log and log (Grevesse & Sauval 2000), so the solar . The ratio in the solar photosphere is equal to 89 (Coplen et al. 2002).
3.2 Comparison of and C/N ratios with theoretical models
| Cluster | Star | () | Age(Gyr) | (kpc) | Teff(K) | [A/H] | C/N | Ref.∗ | ||
|---|---|---|---|---|---|---|---|---|---|---|
| NGC 752 | 1 | 1.60 | 2.0 | 8.75 | 5000 | 2.85 | 0.1 | 16 | – | 1 |
| 75 | 4900 | 2.85 | 0.1 | 13 | – | 1 | ||||
| 77 | 4900 | 2.85 | 0.2 | 16 | – | 1 | ||||
| 213 | 5000 | 2.90 | 0.1 | 14 | – | 1 | ||||
| 295 | 5000 | 2.90 | 0.2 | 15 | – | 1 | ||||
| NGC 2360 | 50 | 2.02 | 1.15 | 6.32 | 5015 | 2.90 | –0.03 | – | 1.04 | 5 |
| 62 | 5105 | 3.15 | 0.12 | – | 1.38 | 5 | ||||
| 86 | 4960 | 2.65 | –0.06 | – | 0.93 | 5 | ||||
| 12 | 4800 | 2.70 | 0.2 | 14.5 | – | 1 | ||||
| NGC 2447 | 28 | 1.90 | 0.45 | 6.51 | 5060 | 2.70 | –0.01 | – | 0.69 | 5 |
| 34 | 5120 | 2.90 | –0.01 | – | 0.87 | 5 | ||||
| NGC 2682 | F84 | 1.20 | 5.0 | 9.05 | 4750 | 2.4 | –0.02 | 20 | 1.15 | 3 |
| F141 | 4730 | 2.4 | –0.01 | 16 | 1.32 | 3 | ||||
| F151 | 4760 | 2.4 | –0.03 | 17 | 1.32 | 3 | ||||
| F164 | 4700 | 2.5 | 0.00 | 18 | 1.62 | 3 | ||||
| F224 | 4710 | 2.4 | –0.11 | 8 | 1.58 | 3 | ||||
| F226 | 4730 | 2.4 | –0.02 | 15 | 1.62 | 3 | ||||
| F84 | 4800 | 2.70 | 0.0 | 11.5 | – | 1 | ||||
| F141 | 4800 | 2.70 | 0.0 | 10.5 | – | 1 | ||||
| F164 | 4800 | 2.70 | 0.0 | 10.5 | – | 1 | ||||
| NGC 2714 | 5 | 2.91 | 0.40 | 8.34 | 5070 | 2.70 | 0.12 | – | 0.83 | 5 |
| NGC 3532 | 19 | 3.03 | 0.35 | 7.87 | 4995 | 2.65 | 0.11 | 12 | 1.02 | 5 |
| 122 | 5045 | 2.60 | –0.02 | – | 0.93 | 5 | ||||
| 596 | 5020 | 2.50 | 0.04 | – | 0.95 | 5 | ||||
| HD95879 | 5000 | 2.25 | 0.08 | 10 | 1.10 | 2 | ||||
| HD96174 | 5000 | 2.17 | 0.00 | 15 | 0.59 | 2 | ||||
| HD96175 | 5100 | 2.25 | 0.12 | 15 | 0.44 | 2 | ||||
| HD96445 | 5000 | 2.36 | 0.13 | 10 | 1.51 | 2 | ||||
| NGC 5822 | 201 | 2.19 | 0.9 | 8.10 | 5035 | 2.85 | 0.05 | 13 | 0.87 | 5 |
| 316 | 5110 | 3.05 | 0.16 | – | 1.00 | 5 | ||||
| NGC 6134 | 39 | 2.34 | 0.7 | 7.6 | 4980 | 2.52 | 0.24 | 9 | 1.48 | 6 |
| 69 | 4950 | 2.83 | 0.11 | 12 | 1.38 | 6 | ||||
| 75 | 5000 | 3.10 | 0.22 | 7 | 1.41 | 6 | ||||
| 114 | 4940 | 2.74 | 0.11 | 6 | 1.05 | 6 | ||||
| 129 | 5000 | 2.98 | 0.05 | 8 | 0.98 | 6 | ||||
| 157 | 5050 | 2.92 | 0.16 | 12 | 1.10 | 6 | ||||
| 30 | 4980 | 2.95 | 0.21 | 12 | 0.93 | 5 | ||||
| NGC 6281 | 3 | 3.18 | 0.3 | 8.47 | 4915 | 2.30 | 0.01 | 12 | 0.64 | 5 |
| 4 | 5015 | 2.50 | 0.09 | 12 | 0.95 | 5 | ||||
| NGC 6633 | 100 | 2.79 | 0.45 | 8.42 | 5015 | 2.85 | 0.11 | 21 | 0.91 | 5 |
| NGC 7789 | K605 | 1.60 | 1.4 | 9.43 | 4860 | 2.4 | –0.02 | 10 | 1.05 | 4 |
| K665 | 4970 | 2.4 | 0.00 | 9 | 1.45 | 4 | ||||
| K732 | 4900 | 2.3 | 0.02 | 7 | 1.51 | 4 | ||||
| IC 2714 | 5 | 2.85 | 0.40 | 8.34 | 5070 | 2.70 | 0.12 | – | 0.83 | 5 |
| IC 4651 | 27 | 1.69 | 1.7 | 7.1 | 4610 | 2.52 | 0.10 | 17 | 1.23 | 7 |
| 76 | 4620 | 2.26 | 0.11 | 14 | 1.35 | 7 | ||||
| 146 | 4730 | 2.14 | 0.10 | 18 | 1.50 | 7 | ||||
| IC 4756 | 12 | 2.37 | 0.7 | 7.23 | 5030 | 2.75 | –0.01 | 11 | 0.91 | 5 |
| 14 | 4720 | 2.47 | 0.03 | 17 | 1.02 | 5 | ||||
| 38 | 5075 | 3.00 | 0.05 | 10 | 1.20 | 5 | ||||
| 69 | 5130 | 3.00 | 0.08 | 5 | 1.15 | 5 | ||||
| 144 | 5200 | 3.20 | 0.0 | 18 | – | 1 | ||||
| 176 | 5200 | 3.00 | 0.0 | 12 | – | 1 | ||||
| 228 | 5000 | 2.90 | 0.0 | 21 | – | 1 | ||||
| 296 | 5000 | 2.90 | 0.0 | 18 | – | 1 |
∗ 1 – Gilroy (1989); 2 – Luck(1994); 3 – Tautvaišienė et al. (2000); 4 – Tautvaišienė et al. (2005);
5 – Smiljanic et al. (2009);
6 – Mikolaitis et al. (2010); 7 – This work.
The carbon and nitrogen abundances, C/N and especially the carbon isotope ratios are key tools for stellar evolution studies. Investigations of abundances of these chemical elements in atmospheres of clump stars of open clusters may provide a comprehensive information on chemical composition changes. The clump stars have accumulated all chemical composition changes that have happened during their evolution along the giant branch and during the helium flash.
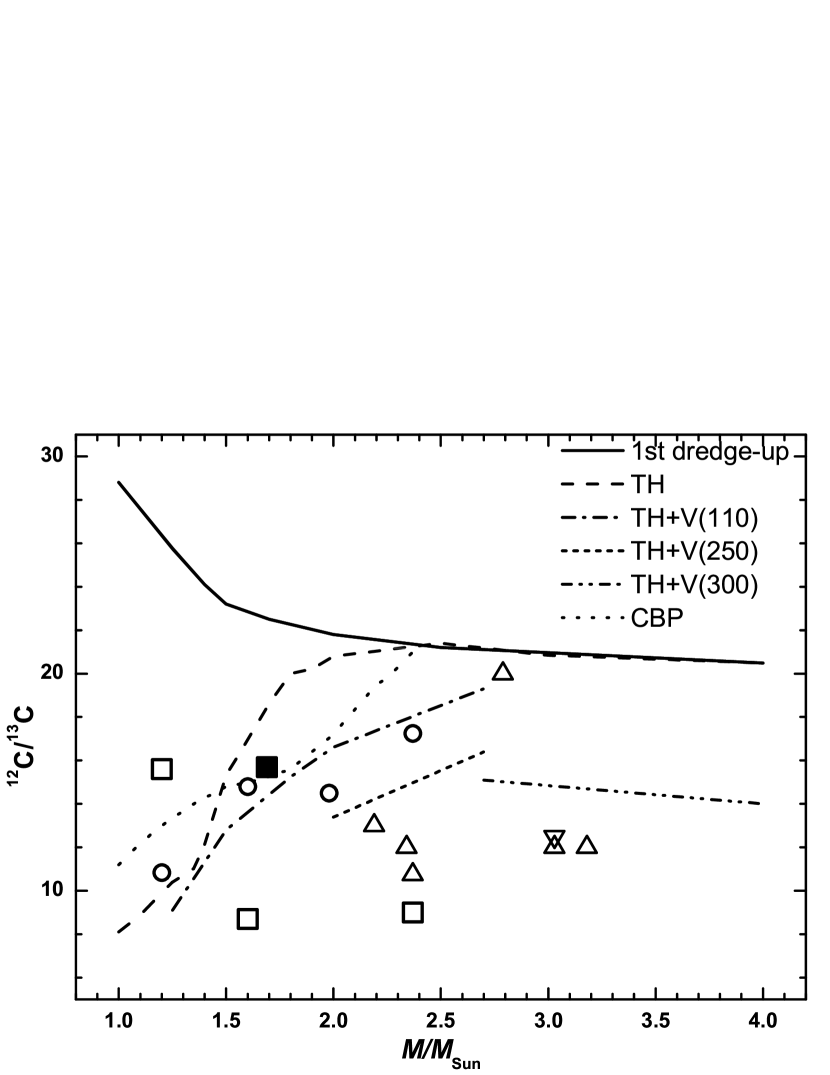
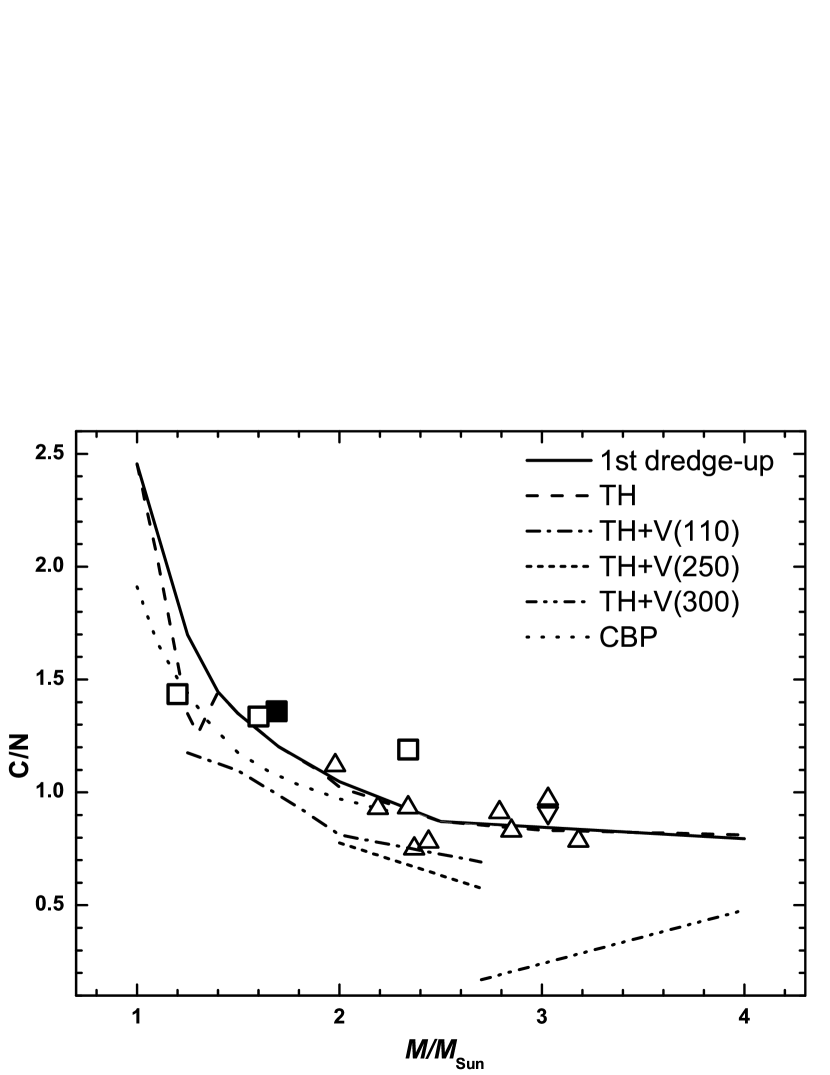
In Fig. 7 and 8, we compare the mean carbon isotope and C/N ratios of clump stars in different open clusters as a function of turn-off mass with the theoretical models of the dredge-up, thermohaline mixing (TH), thermohaline mixing together with rotation-induced mixing for stars at the zero age main sequence (ZAMS) having rotational velocities of 110 km s-1, 250 km s-1 and 300 km s-1 computed by Charbonnel & Lagarde (2010); and Cool Bottom Processing model (CBP) by Boothroyd & Sackman (1999).
The most resent modelling of extra-mixing processes was done by Charbonnel & Lagarde (2010). They are based on ideas of Eggleton et al. (2006) and Charbonnel & Zahn (2007). Eggleton et al. (2006) found a mean molecular weight () inversion in their stellar evolution model, occurring after the so-called luminosity bump on the red giant branch, when the H-burning shell source enters the chemically homogeneous part of the envelope. The -inversion is produced by the reaction , as predicted by Ulrich (1972). It does not occur earlier, because the magnitude of the -inversion is small and negligible compared to a stabilizing -stratification. Following Eggleton et al. (2006), Charbonnel & Zahn (2007) have computed stellar models including the prescription by Ulrich (1972) and extended them to the case of a non-perfect gas for the turbulent diffusivity produced by that instability in a stellar radiative zone. They found that a double diffusive instability referred to as thermohaline convection, which has been discussed long ago in the literature (Stern 1960), is important in evolution of red giants. This mixing connects the convective envelope with the external wing of hydrogen burning shell and induces surface abundance modifications in red giant stars.
Charbonnel & Lagarde (2010) also computed the models of rotation-induced mixing for stars at the zero age main sequence having rotational velocities of 110 km s-1, 250 km s-1 and 300 km s-1. Typical initial ZAMS rotation velocities were chosen depending on the stellar mass based on observed rotation distributions in young open clusters (Gaigé 1993). The convective envelpoe was supposed to rotate as a solid body through the evolution. The transport coefficients for chemicals associated to thermohaline and rotation-induced mixings were simply added in the diffusion equation and the possible interactions between the two mechanisms were not considered. The rotation-induced mixing modifies the internal chemical structure of main sequence stars, although its signatures are revealed only later in the stellar evolution.
The models by Boothroyd & Sackmann (1999) include the deep circulation mixing below the base of the standard convective envelope, and the consequent ”cool bottom processing” (CBP) of CNO isotopes.
The theoretical models were compared to the observational data of and C/N listed in Table 5, which we collected for clump stars of open clusters investigated by Mikolaitis et al. (2010), Smiljanic et al. (2009), Tautvaišienė et al. (2000, 2005), Luck (1994) and Gilroy (1989). From Gilroy (1989) we selected 4 clusters with well defined red clump stars. Luck (1994) derived carbon isotope ratios for 8 open clusters, however only one cluster was included to our comparison since for other clusters it was very difficult to identify stars of red clump. The turn-off masses, ages and galactocentric distances were choosen from the most recent studies and used for displaying of other and C/N investigations for the same cluster, if available.
In Fig. 7 and 8 we can see that for clusters with stars of smaller turn-off masses the and C/N values are in a good agreement with both models of extra-mixing used for the comparison. However, values in the clump stars with turn-off masses of 2–3 in most of the investigated clusters are lower than predicted by the available models and need modelling of larger extra-mixing.
3.3 Final remarks
Carbon and nitrogen are important products of nucleosynthesis processes in stellar interiors, and the evidence of their abundance variation during stellar evolution is a signature of physical mixing processes between the atmosphere and deeper layers of a star. Such abundance alterations may be well traced in open clusters. They provide a unique possibility for investigation of a number of stars of nearly the same age, distance and origin, as open cluster stars are claimed to be formed in the same protocloud of gas and dust. Open clusters have a high reliability of mass, distance, evolutionary phase and abundance determinations.
Extra-mixing processes may become efficient on the red giant branch when stars reach the so-called RGB bump, and may modify the surface abundances. It is known that alterations of and ratios depend on stellar evolutionary stage, mass and metallicity (see Charbonnel et al. 1998, Gratton et al. 2000, Chanamé et al. 2005, Cantiello & Langer 2010; Charbonnel & Lagarde 2010 for more discussion).
The comparison of the observational data with theoretical models of stellar evolution shows that processes of extra-mixing in stars of open clusters with turn-off masses of 2–3 are larger than predicted.
Acknowledgments
This research has made use of Simbad, VALD and NASA ADS databases. Bertrand Plez (University of Montpellier II) and Guillermo Gonzalez (Washington State University) were particularly generous in providing us with atomic data for CN and C2 molecules, respectively. Š. M. and G. T. were supported by the Ministry of Education and Science of Lithuania via LitGrid programme and by the European Commission via FP7 Baltic Grid II project.
References
- Anthony-Twarog & Twarog (1987) Anthony-Twarog B. J. & Twarog B. A., 1987, AJ, 94, 1222
- Anthony-Twarog & Twarog (2000) Anthony-Twarog B. J. & Twarog B. A., 2000, AJ, 119, 2282
- Anthony-Twarog et al. (1988) Anthony-Twarog B. J., Mukherjee K., Twarog B. A., Caldwell N., 1988, AJ, 95, 1453
- Anthony-Twarog & Twarog (2000) Anthony-Twarog B. J., Twarog B. A., 2000, AJ, 119, 2282
- Boothroyd et al. (1999) Boothroyd A. I., Sackmann I. J., 1999, ApJ, 510, 232
- Biazzo et al. (2007) Biazzo K., Pasquini L., Girardi L., Frasca A., da Silva L., Setiawan, J., Marilli, E., Hatzes, A. P., Catalano, S.
- Bragaglia et al. (2006) Bragaglia A., Tosi M. 2006, AJ, 131, 1544
- Bragaglia et al. (2001) Bragaglia A., et al. 2001, AJ, 121, 327
- Cantiello & Langer (2010) Cantiello M. & Langer N., 2010, A&A, 521, 9
- Carretta et al. (Carretta2007) Carretta E., Bragaglia A., Gratton R. 2007, A&A, 473, 129
- Carretta et al. (2004) Carretta E., Bragaglia A., Gratton R., Tosi M., 2004, A&A, 422, 951
- Chanamé et al. (2005) Chanamé J., Pinsonneault M., Terndrup D. M., 2005, ApJ, 631, 540
- Charbonnel et al. (1998) Charbonnel C., Brown J. A., Wallerstein G., 1998, A&A 332, 204
- Charbonnel & Zahn (2007) Charbonnel, C. & Zahn, J.-P. 2007, A&A, 467, 15
- Charbonnel & Lagarde (2010) Charbonnel C. & Lagarde N., 2010, A&A, 522, 10
- Coplen et al. (2002) Coplen T. et al. 2002, Pure & Appl. Chem. 74:1987-2017
- Den Hartog et al. (2003) Den Hartog E. A., Lawler J. E., Sneden C., Cowan J. J., 2003, ApJS, 148, 543
- Eggen (1971) Eggen, O. J., 1971, ApJ, 166, 87
- Eggleton (2006) Eggleton P. P., Dearborn D. S. P., Lattanzio J. C., 2006, Sci, 314, 1580
- Gaigé (1993) Gaigé Y., 1993, A&A, 269, 267
- Gilroy et al. (1989) Gilroy K. K., 1989, ApJ, 347, 835
- Girardi et al. (2000) Girardi L., Bressan A., Bertelli G., Chiosi C., 2000, A&AS, 141, 371
- Gratton et al. (1999) Gratton R.G., Carretta, E., Eriksson, K., Gustafsson, B., 1999, A&A, 350, 955
- Gratton et al. (2000) Gratton R.G., Sneden C., Carretta E., Bragaglia A. 2000, A&A, 345, 169
- Grevesse et al. (2000) Grevesse N., Sauval A.J., 2000, “Origin of Elements in the Solar System, Implications of Post-1957 Observations, O. Manuel (ed.), Kluwer, 261
- Gustafsson et al. (1999) Gustafsson B., Karlsson T., Olsson E., Edvardsson B., Ryde N., 1999, A&A, 342, 426
- Johansson et al. (2003) Johansson S., Litzén U., Lundberg H., Zhang Z., 2003, ApJ, 584, 107
- Lindoff et al. (1972) Lindoff U., 1972, A&AS, 7, 231
- Luck et al. (1994) Luck R. E., 1994, ApJS, 91, 309
- Mashonkina & Gehren (2000) Mashonkina L. & Gehren T, 2000, A&A, 364, 249
- McWilliam (1998) McWilliam A. 1998, AJ, 115, 1640
- Meibom (2000) Meibom S., 2000, A&A, 361, 929
- Meibom et al. (2002) Meibom S., Andersen J., Nordström B., 2002, A&A, 386, 187
- Mikolaitis et al. (2010) Mikolaitis Š., Tautvaišienė G., Gratton R., Bragaglia A., Carretta E., 2010, MNRAS, 407, 1866
- Nissen et al. (1988) Nissen P. E., 1988, A&A, 199, 146
- Pasquini et al. (2004) Pasquini L., Randich S., Zoccali M., Hill V., Charbonnel C., Nordström B., 2004, A&A, 424, 951
- Pace et al. (2008) Pace G., Pasquini L., François P., 2008, A&A, 489, 403
- (38) Santos N.C., Lovis C., Pace G., Melendez J., Naef D., 2009, A&A, 493, 309
- Shi et al. (2002) Shi J. R., Zhao G., Chen Y. Q., 2002, A&A, 381, 982
- Smiljanic et al. (2009) Smiljanic R., Gauderon R., North P., Barbuy, B., Charbonnel C., Mowlavi N., 2009, A&A, 502, 267
- Stern (1960) Stern, M. E. 1960, Tellus, 12, 172
- Tautvaišienė et al. (2000) Tautvaišienė G. Edvardsson B., Tuominen I., Ilyin I., 2000, A&A, 360, 499
- Tautvaišienė et al. (2005) Tautvaišienė G. Edvardsson B., Puzeras E., Ilyin I., 2005, A&A, 431, 933
- Ulrich (1972) Ulrich, R. K. 1972, ApJ, 172, 165