Simone Stracka111On behalf of the BABAR Collaboration.
Dipartimento di Fisica, Università degli Studi di Milano
and INFN Sezione di Milano - I-20133 Milano, ITALY
We present the measurement, performed by the BABAR Collaboration, of the weak phase
from the time dependent asymmetries in decays.
The model error induced by penguin contributions to the channel is estimated from an SU(3) analysis of the branching fractions of , , and decays.
PRESENTED AT
6th International Workshop on the CKM Unitarity Triangle
University of Warwick, United Kingdom, September 6-10, 2010
1 Introduction
The measurement of the CKM angle at present-day -factories relies on the
analysis of time-dependent violating asymmetries in tree-dominated transitions, such as
, , , (charge-conjugated reactions are implied throughout the text).
The extraction of is limited by the penguin contributions
to the decay amplitude, which shift the value of the phase measured from the time distribution of decays by an amount that has to be determined from the experiment.
One of the strengths of the -factories lies in their ability to use multiple approaches
to the measurement of , allowing for a better control on model-dependent
estimates of the penguin contributions by comparison with data in many channels.
Independent measurements of this angle in different channels also help
to resolve discrete ambiguities that emerge in the extraction of .
The angle can be measured from violating asymmetries in decays of neutral mesons to non- eigenstates [1], such as and . For the final state, can be extracted without discrete ambiguities by looking at the time-dependent asymmetries in different regions of the Dalitz plot.
At the present level of statistics, this approach cannot be applied to the four-particle final state resulting from
decays. Nevertheless, the analysis of the time-dependent
asymmetries allows to derive an effective value , which can be related to under
the SU(3) approximate symmetry by measuring the branching fractions of a set of auxiliary decay channels: , , and [2].
In the following, we report the determination of
in the decays, with the data collected by the BABAR detector at SLAC.
2 Branching fraction of decays
The channel was observed
by BABAR in 2006 [3],
by reconstructing the decay of the axial vector meson (henceforth denoted as ) into the dominant channel.
The signal contribution is separated from background by means of an unbinned
maximum-likelihood (ML) fit to a set of five discriminating variables.
Two kinematic variables, the energy substituted mass
and the energy difference , where the
four-momentum is defined in the center-of-mass (CM) frame,
allow to discriminate between correctly reconstructed candidates
and fake candidates resulting from random
combination of particles.
Topological variables, combined into a Fisher discriminant , provide
further distinction between the jet-like shape of
continuum events (), which is the most abundant
source of background, and the more isotropic decays.
The two remaining variables characterize the resonant behavior of the reconstructed
three-particle system in the final state: the invariant mass
and the cosine of the angle between the momentum of the bachelor pion and
the normal to the plane described by the resonant three-pion system, in the rest frame.
The distribution allows to discriminate between different hypotheses for the
three-pion resonance.
The lineshape parameters for the meson are left free in the fit, to minimize systematic uncertainties.
A signal yield of events is extracted from the fit to the BABAR data ( pairs), which corresponds to a branching fraction , assuming a 50% branching fraction for
the decay [3].
These results are in good agreement with the branching fraction extracted by Belle,
[4].
3 Time-dependence of decays
With a sample of pairs,
BABAR performed a ML fit to 29300 selected events, resulting in a signal yield of ( events with their flavor identified),
and measured the time distribution of the decays
where is the mixing frequency, and () if the other in the event decays as a ().
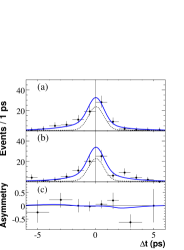
The observed time-dependent rates and asymmetry are shown in Fig. 1 (a-c),
and take into account the resolution function and the dilution from incorrect flavor assignment. They correspond to
, , ,
, and [5], where the first error is statistical and the second systematic
(dominated by
the modeling of the signal distributions and by violation in the background). Linear correlations are at the level.
Figure 1:
(a-c): Projections onto of data (points) for (a) , (b) tags, and (c) the asymmetry between and tags [5].
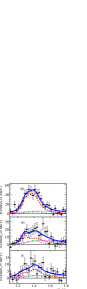
(d-f): Continuum-background subtracted projections of the data (points) on
for
(d,e) and (f) events:
(d,f) events with and (e) events not included in (d,f) with . The
solid line is the sum of the fit functions for the decay modes (dashed), (dash-dotted),
(dotted) [9].
The dashed curve is normalized to (d) , (e) , and (f) events.
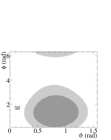
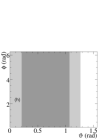
(g,h): 68% (light) and 90% CL (dark) regions in (g) and (h) decays to [9].
These parameters can be related to the effective value , by the relation
(1)
where is the strong phase between the tree amplitudes of decays to and
. The strong phase can be averaged out to yield with an eightfold ambiguity in the range , which can be reduced by assuming , as suggested by factorization [2].
The selected solutions are and , where the error is
statistical and systematic combined.
4 SU(3) analysis and ,
The effect of penguin pollution can be evaluated from
auxiliary measurements by introducing flavor-symmetry arguments. Since an isospin analysis is not feasible [6],
our approach is based on a set of SU(3) relations [2], that allow to estimate
the size of penguin amplitudes from the branching fractions of the partners of the
decays: and , where the
state belongs to the same SU(3) octet as the meson.
This approach is effective because
in these channels the penguin amplitudes are enhanced by a CKM factor
() with respect to the transitions .
Bounds on can be derived from the following ratios of -averaged rates:
(2)
(3)
where the ratios of the decay constants parameterize factorizable SU(3) corrections. Nonfactorizable contributions
to and transitions from exchange and weak annihilation diagrams, respectively, are
neglected [2].
In the above expressions, and are obtained from the study of decays [7].
With an analysis similar to the one for the channel, BABAR measured, from a sample of pairs, the branching fractions of and decays:
and
[8].
The is a mixture of the
and axial vector mesons, with a mixing angle : .
Both resonances decay to through similar intermediate resonances
and are characterized by overlapping mass distributions, and sizeable interference effects
are thus expected.
The contribution of the state can be isolated by extracting from data the combined branching fraction of decays to and , and the relative magnitude () and phase () of
and amplitudes.
In the analysis recently performed by BABAR with the final data sample of pairs [9], the combined and signal
is parameterized in terms of a two-resonance, six-channel -matrix model [10] in the -vector approach [11]: the -matrix describes the propagation and decay of the resonances, while the -vector effectively parameterizes the production of the system, along with a recoiling bachelor pion, in decays.
The decay couplings and the mass poles are determined from the results of the partial wave analysis, performed by the ACCMOR Collaboration,
of the diffractively produced system [10]. The production parameters are extracted from BABAR data by means of a ML fit to , , ,
, and the invariant mass of the resonant system (), which
provides sensitivity to the individual contributions of the resonances.
The continuum-background subtracted distribution in data is shown in Fig. 1 (d-f).
Including systematic uncertainties, dominated by the effect of interference between the and the non-resonant components, the combined signal branching fractions are and
. The information about the fraction and phase of the two resonances (Fig. 1 (g,h)) is used to calculate and , where the latter upper limit is evaluated at the 90% confidence level (CL) [9].
5 Bounds on
The bounds on are derived by inverting the relations [2]
(4)
(5)
A Monte Carlo method is used to derive the 68% and 90% CL upper limits for the bounds: replicas
of the input quantities are generated from the experimental distributions, and for each simulated set
of values the above system of inequalities is solved. This study yields the bound at the 68% (90%) CL, and
the final result for the solution compatible with the CKM global fits,
where the first error is statistical and systematic combined and the second is due to penguin pollution.
The presence of non-factorizable SU(3) breaking effects can be tested, e.g., at LHCb or at a Super -factory,
by studying auxiliary decay channels such as . The impact of such corrections can be estimated by writing , where () is the penguin amplitude in () transitions, and the departure of from quantifies the amount of non-factorizable SU(3) breaking. For , the bounds are expected to increase by about .
Finally, a full SU(3) fit may provide an experimental test of .
6 Conclusions
BABAR has measured the CKM angle from the channel,
and has obtained a value .
This independent determination of is
consistent with the world average of the , , and channels and with CKM global fits.
References
[1]
R. Aleksan et al., Phys. Lett. B 356, 95 (1995).
[2]
M. Gronau and J. Zupan, Phys. Rev. D 73, 057502 (2006); Phys. Rev. D 70, 074031 (2004).
[3]
B. Aubert et al. (BABAR Collaboration), Phys. Rev. Lett. 97, 051802 (2006).
[4]
K. Abe et al. (Belle Collaboration), arXiv:0706.3279 (2007).
[5]
B. Aubert et al. (BABAR Collaboration), Phys. Rev. Lett. 98, 181803 (2007).
[6]
M. Gronau, Phys. Lett. B 265, 389 (1991).
[7]
J. C. R. Bloch et al., Phys. Rev. D 60, 111502(R) (1999); H.-Y. Cheng and K.-C. Yang, Phys. Rev. D 76, 114020 (2007).
[8]
B. Aubert et al. (BABAR Collaboration), Phys. Rev. Lett. 100, 051803 (2008).
[9]
B. Aubert et al. (BABAR Collaboration), Phys. Rev. D 81, 052009 (2010).
[10]
C. Daum et al. (ACCMOR Collaboration), Nucl. Phys. B187, 1 (1981).
[11]
I. J. R. Aitchison, Nucl. Phys. A 189, 417 (1972).