Color and Stellar Population Gradients in Passively Evolving Galaxies at from HST/WFC3 Deep Imaging in the Hubble Ultra Deep Field
Abstract
We report the detection of color gradients in six massive (stellar mass M⊙) and passively evolving (specific star formation rate (SSFR) ) galaxies at redshift identified in the Hubble Ultra Deep Field (HUDF) using ultra–deep HST ACS and WFC3/IR images. After carefully matching the different PSFs, we obtain color maps and multi–band optical/near–IR photometry (BVizYJH) in concentric annuli, from the smallest resolved radial distance ( kpc) up to several times the H–band effective radius. We find that the inner regions of these galaxies have redder rest-frame UV–optical colors (U-V, U-B and B-V) than the outer parts. The slopes of the color gradient have no obvious dependence on the redshift and on the stellar mass of the galaxies. They do mildly depend, however, on the overall dust obscuration (E(B-V)) and rest–frame (U-V) color, with more obscured or redder galaxies having steeper color gradients. The color gradients are also steeper than those of local early–type ones. The gradient of a single parameter (age, extinction or metallicity) cannot fully explain the observed color gradients. Fitting the spatially resolved HST seven–band photometry to stellar population synthesis models, we find that, regardless of assumptions on the metallicity gradient, the redder inner regions of the galaxies have slightly higher dust obscuration than the bluer outer regions, implying that dust partly contributes to the observed color gradients, although the magnitude depends on the assumed extinction law. Due to the age–metallicity degeneracy, the derived age gradient depends on the assumptions for the metallicity gradient. We discuss the implications of a number of assumptions for metallicity gradients on the formation and evolution of these galaxies. We find that the evolution of the mass–size relationship from to the present cannot be driven by in–situ extended star formation, which implies that accretion or merger is mostly responsible for the growth of their stellar mass and size. The lack of a correlation between the strength of the color gradient and the stellar mass argues against the metallicity gradient predicted by the monolithic collapse scenario, which would require significant major mergers to evolve into the one observed at the present.
1 Introduction
The stellar mass () of “spheroids”, namely elliptical galaxies and bulges of spiral galaxies, mostly consists of old stars that formed at high redshift, e.g. (Renzini 2006). The spheroids segregate % of all the stars in the local universe (Hogg et al., 2002; Bell et al., 2003; Driver et al., 2006), and thus the mechanisms that led to their assembly are key to the evolution of galaxies in general. But while there is agreement on the age of the stars of the spheroids, how these stars got together and formed the body of ellipticals and bulges remains an open issue.
During the past several years, galaxies at with and SED similar to those of local early-type galaxies have been identified and studied in relatively large numbers thanks to the increased availability of deep optical and near–IR photometry from large–area surveys (e.g., Thompson et al., 1999; Franx et al., 2003; Daddi et al., 2004) as well as spectral data (e.g., Kriek et al., 2006a, b; Cimatti et al., 2008; Onodera et al., 2010). More recently, an increasing number of studies seem to show that the number density of massive galaxies with very low specific star formation rate (SSFR) undergoes rapid evolution between and (e.g., Fontana et al., 2006; Arnouts et al., 2007; Ilbert et al., 2010, Cassata in preparation). The physical mechanisms responsible for this apparently rapid assembly of passively evolving massive galaxies remain unknown. Equally unknown is if this is just the assembly of the stellar bodies of the massive galaxies, or if the fraction of stars locked in passively evolving systems is also evolving accordingly. Various formation mechanisms, for example, merger (e.g., Brinchmann & Ellis, 2000; Le Fèvre et al., 2000; De Lucia et al., 2006; Naab et al., 2007; Naab & Ostriker, 2009) and feedback (e.g., Benson et al., 2003; Croton et al., 2006) have been proposed to explain the rapid emergence of massive passively evolving galaxies (PEGs) during this redshift range, which is also the cosmic epoch when star formation in the universe is at its peak. Such mechanisms would leave distinguishable imprints on the color and stellar population gradients of massive PEGs. For example, a major merger (i.e. mass ratio approximately unitary) of gas–rich galaxies would form a spheroid and trigger a bursts of central star-formation, which would leave a blue core to the spheroid (Menanteau et al., 2001a, 2004; Daddi et al., 2005). Or, if massive PEGs mostly assemble their masses through dry mergers or mergers that do not induce central star-formation, they would generally not have blue cores. Thus, studying color gradients and their implications on the stellar population gradients of massive PEGs is expected to provide important clues on the formation of massive PEGs at .
Related to the formation mechanisms is the issue of the subsequent evolution of the massive PEGs. Recent work (e.g., Daddi et al., 2005; Trujillo et al., 2006, 2007; van Dokkum et al., 2008; Cassata et al., 2010) shows that many massive PEGs at are, on average, 5 times smaller and times denser than their local counterparts with similar mass. The physical mechanisms proposed to explain this apparently dramatic evolution of size include major merger (e.g., Hopkins et al., 2009c; van der Wel et al., 2009), minor merger (e.g., Naab et al., 2009), adiabatic expansion (e.g., Fan et al., 2008), and mass-to-light gradients (e.g., Hopkins et al., 2010). Others (e.g., Hopkins et al., 2009b; Mancini et al., 2010) have suggested that the small size of some PEGs at high redshift may be due to an observational bias such that the low surface-brightness halos surrounding these PEGs are not detected by current near-IR observations; if these missing halos were detected, the derived size of high-z massive PEGs would be similar to that of their local counterparts. In order to answer the question whether the observed strong size evolution of massive PEGs from to is physical or not, near-IR observations with high sensitivity are required to measure the color and stellar population distributions of massive PEGs to large radius.
Color gradients in early type galaxies have been known for about thirty years (Faber, 1972) and widely studied in local galaxies (e.g., Peletier et al., 1990a; Tamura et al., 2000; La Barbera et al., 2005; La Barbera & de Carvalho, 2009; Gonzalez-Perez et al., 2011), but no information is currently available on color gradients in PEGs at high redshift (), because of instrumental limitations on sensitivity and angular resolution, given the compact size of such sources, and the lack of spectral coverage of the rest–frame optical SED. Ground-based observations suffer from poor resolution and/or wavelength–dependent and unstable Strehl ratio. Sensitivity to low–surface brightness regions is also limited due to the high and variable sky background. For example, the typical full-width half-maximum (FWHM) of the point spread function (PSF) of VLT ISAAC Ks–band images is about 0.5′′, corresponding to 4 kpc for a galaxy at . This size is almost 4 times of the average effective radius of a PEGs with = at (Cassata et al., 2010, and reference therein). Even if upcoming adaptive optics systems reach near–HST resolution in the K band, performance degrade rapidly at shorter wavelength so that making robust color maps is not yet feasible. To sample the color and stellar population gradients of PEGs at at the kpc scale, a minimum angular resolution of about ′′ is required at both optical and near–IR wavelength. Although HST NICMOS-1 and NICMOS-2 have such required resolution, their small fields of view and low throughput make them inconvenient for surveying large sky area and observing distant and faint galaxies. The detailed study on color gradients of a large sample of high-redshift early-type galaxies is only now available thanks to the WFC3/IR imager on-board of HST.
In this work we use the HUDF HST/ACS images in combination with recent WFC3 near–IR deep images in the same field to measure the color gradients of a sample of massive PEGs at to about 10 times their effective radius and inferred corresponding gradients of physical properties of the stellar populations. We measure color gradients for these galaxies in a series of concentric annuli from the ACS and WFC3 images and fit the spatially resolved SED to stellar population synthesis models to derive the corresponding gradients of stellar population parameters (SSFR, age and extinction), looking for trends between the color gradient characteristics and the stellar population properties in an attempt to derive clues on their origins.
Throughout we adopt a flat cosmology with , and use the Hubble constant in terms of . All magnitudes in the paper are in AB scale (Oke, 1974) unless otherwise noted.
2 The Data
In addition to the HST /ACS and WFC3/IR images in the HUDF, the data used in this paper also include panchromatic multi–wavelength photometry obtained as part of the GOODS program, as the HUDF field is embedded in the GOODS south field. The long wavelength baseline of the GOODS photometry enables us to reliably select PEGs based on photometrically–derived stellar mass and SSFR, while the deep HST optical and NIR images allow us to obtain color maps of the galaxies with a resolution of kpc.
The GOODS south field has been observed with various telescopes and instrument combinations, from the X–ray to the sub–millimeter and radio. Relevant to our analysis here is the VLT/VIMOS ultra–deep U–band imaging (Nonino et al., 2009), as well as HST/ACS BViz (Giavalisco et al., 2004)), VLT/ISAAC JHK, Spitzer/IRAC 3.6, 4.5, 5.7, 8.0 m, and Spitzer/MIPS 24 m imaging. Since the resolution of images significantly changes from optical- to IR-band, we use an object template-fitting software dubbed TFIT (Laidler et al., 2007) to obtain matched multi–band photometry. TFIT requires position priors and light profile templates drawn from a high-resolution image (the ACS z-band image in our work) and accurate measures of the PSF for all images with various resolutions. It fits the template of an object, whose resolution is now downgraded to that of low-resolution images, to the images of the object in low-resolution bands, with the flux in each band left as a free parameter. The best-fit flux in each band is used as the flux of the object in the band. TFIT can simultaneously fit several objects that are close enough in the sky so that the deblendding effect of these objects on the flux measurement would be minimized. Experiments on both simulated and real images show that TFIT is able to measure accurate isophotal photometry of objects to the limiting sensitivity of images. The TFIT measured fluxes of bands with resolution lower than the z-band resolution, together with the SExtractor measured AUTO flux of BViz bands, are merged to build the GUTFIT catalog (Grogin et al. in prep.).
The ultra–deep ACS images in the HUDF (Beckwith et al., 2006) cover an area roughly equal to the footprint of the ACS/WFC FOV in the same four filters as the GOODS ACS program, namely F435W (B), F606W (V), F775W (i), and F850LP (z) down to a depth of 29.4, 29.8, 29.7, and 29.0 mag (5, 0.35′′-diameter aperture), respectively. We use the publicly available images, which have been rebinned to the same pixels scale as the GOODS/ACS mosaic, namely 0.03′′ /pixel ( the original ACS pixel scale).
The WFC3/IR data are from the HST Cycle 17 program GO-11563 (PI: G. Illingworth), which aims at complementing the HUDF and the two HUDF05 parallel fields (Oesch et al., 2007) with WFC3/IR images in Y (F105W), J (F125W), and H (F160W) of matching sensitivity, 29 mag (Bouwens et al., 2010; Oesch et al., 2010). Here we use only the first epoch of the images, released in September 2009, which includes 18 orbits in Y, 16 orbits in J, and 28 orbits in H. We have carried out our independent reduction of the raw data, and after rejecting images affected by persistence in the J band, our final stacks reach 1 surface brightness fluctuations of 27.2, 26.6 and 26.3 AB/′′ 2 in the three bands, respectively, over an area roughly equal to the footprint of the WFC3/IR camera (2.1 ′′ 2.1 ′′). We have drizzled the WFC3 images from their original pixel size of 0.121′′ 0.135′′ to 0.03′′ per pixel to match the scale of the GOODS and HUDF ACS images.
3 Passively Evolving Galaxies at in HUDF
We select passively evolving galaxies based on their SSFRs estimated by fitting the GOODS GUTFIT 12–band photometry to stellar population synthesis models. During the fit, the value of the redshift parameter is set to either the spectroscopic redshift, when available, or the photometric redshift, which we have separately measured using the PEGASE 2.0 (Fioc & Rocca-Volmerange, 1997) templates. Another set of photometric redshifts is also available in the GOODS–S field(Dahlen et al., 2010), and we find that results from both sets are in excellent agreement; both sets achieve in the redshift range considered here. For the SED fitting we use the stellar population synthesis models of Charlot & Burzual 2009 (CB09), with Salpeter IMF and lower and upper mass limits of 0.1 and 100 , respectively. We also use the –model (–model) to parametrize the star formation history of the galaxies. The free parameters that are found by the fitting procedure are the stellar mass , the dust reddening E(B-V), the parameter and the age of the stellar populations. We use the Calzetti Law (Calzetti et al., 1994, 2000) to model the obscuration by dust and the prescription of Madau (1995) to account for the cosmic opacity by HI. Finally, we average the best–fit model star–formation history over the last 100 Myr to derive the current SFR of the galaxy. We estimate the error bars of the parameters of the best–fit model from Monte–Carlo simulations, where we perturb the photometric measures using Gaussian variates with variance set equal to the photometric errors and re–run the fitting procedure 200 times.
We define passively evolving galaxies in the redshift range as those whose specific star–formation rate satisfies the relation
| (1) |
and restrict our samples to only include massive systems, namely those with M⊙. Among 53 galaxies with M⊙ and in the HUDF, 11 galaxies have SSFR. We exclude two of them from our sample, because we are interested in studying color gradients of early–type galaxies, while these systems have irregular morphology and not well-defined centers, possibly implying ongoing merging events. We exclude another two galaxies, because they have extremely faint NIR fluxes, in fact they have negative J, H and IRAC fluxes, which result in large uncertainties in their photometrically-derived physical properties. Finally, an additional galaxy with an obvious spiral morphology has also been eliminated from the sample. Although the best–fit SSFR of this galaxy is yr-1, the probability distribution function (PDF) of this SSFR measure has two peaks with similar probability density, one around yr-1 and the other yr-1, implying a substantial probability for this source to be a star-forming galaxy.
After these exclusions, the final sample includes 6 galaxies, whose GOODS ID, coordinates, redshift, SED–fitting parameters and H–band effective radius, measured by Cassata et al. (2010), are shown in Table 1. Five out of the six galaxies in the sample satisfy pBzK color–color criterion for passively evolving galaxies at (Daddi et al., 2004) or the analog VJL criterion for redshift (VJL, Guo et al. in preparation). The last galaxy, 24626, resides just below the pBzK selection window in the (B-z) vs.(z-K) color–color plane, most likely because its spectroscopic redshift, , is outside of the targeted range of the pBzK criterion. Four galaxies have spectroscopic redshift, 22704 and 23555 from Cimatti et al. (2008), 24279 from Daddi et al. (2005) and 24626 from Vanzella et al. (2008).
Galaxy 23495 has a counterpart in the Chandra Deep Field South 2–Megasecond catalog (Luo et al., 2008). It has X-ray luminosity and in the soft and hard band, respectively. It is not, however, detected in the VLA map by Kellermann et al. (2008) and Miller et al. (2008). Galaxy 24626 also has a counterpart in the catalog of Luo et al. (2008), but it only has a marginal (S/N 1.3) detection in the soft band with X-ray luminosity and none in the hard band. We re-investigate the two sources with the newly released Chandra Deep Field South 4–Megasecond image111http://cxc.harvard.edu/cda/Contrib/CDFS.html and find similar results. Other four galaxies have no detection in both bands, either individually or stacked, in the 4–Megasecond image. Finally, all our sample galaxies have no detection at 24 m down to a 1 limit of 5 Jy, consistent with predictions for passively evolving galaxies at z 2 (Fontana et al., 2009).
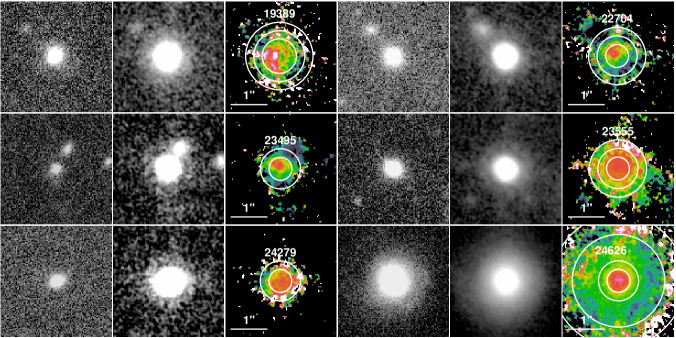
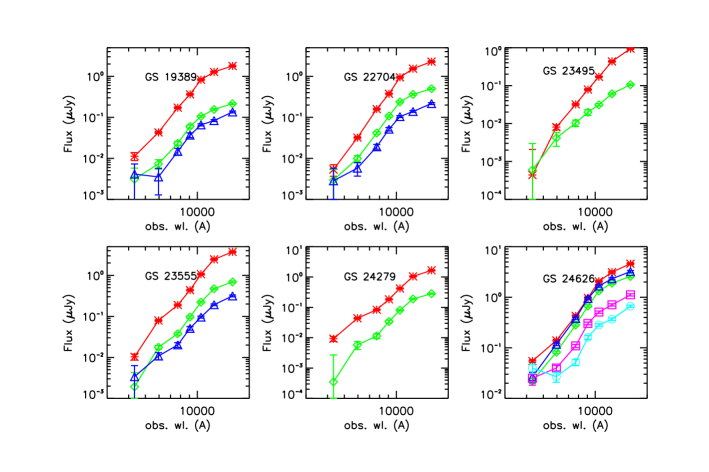
Figure 1 shows the images of the sample galaxies in the z– and H–bands, as well as their (z-H) color composites. The z–band images have their original resolution (0.12 ′′ ), while the resolution of the (z-H) color images is that of the H–band images, after PSF matching (see later). Both the z–band and H–band images show that all the sample galaxies have spheroidal, early–type morphology, while (z-H) color maps reveal both analogies and differences among them. All galaxies have a red center and blue outskirts. Galaxy 24626 has the most well-defined red center and the clearest color gradient. Galaxy 23555 and 24279 also have well–defined red centers, but their outskirts are observed at relatively lower S/Ns and the resulting color gradient is not as clear as that of Galaxy 24626. In the remaining three galaxies, the location of the red stellar populations is slightly off–center, with the distance between the centroid and the red center comparable to the H–band half–light radius of the galaxy. After re–sampling both z–band and H–band images to smaller pixel scale (0.01′′ /pixel) and re–registering images, we still find such off–center red cores. Therefore, we rule out the sub-pixel image registration issue as the reason of the off–center cores. Instead, we suspect the asymmetry in the cores of our empirical PSFs could be the reason. However, the use of annuli photometry with size of a few FWHM largely reduces the influence of the asymmetry of PSFs so that it would not impact our results, as our later test in §4.1 shows. Since we aim at measuring the color gradients up to 10 times of the H–band half–light radius, it is still reasonable to consider that these galaxies, too, have red centers.
| GOODS ID | RA | DEC | redshift111The number in brackets indicate the quality of redshifts: p stands for photometric redshift, s for spectroscopic redshift | E(B-V) | Z | |||
|---|---|---|---|---|---|---|---|---|
| (J2000) | (J2000) | kpc | ||||||
| 19389 | 53.1357303 | -27.7849320 | 1.345(p) | 1.02 | ||||
| 22704 | 53.1537988 | -27.7745867 | 1.384(s) | 0.50 | ||||
| 23495 | 53.1584550 | -27.7739817 | 2.422(p) | 0.38 | ||||
| 23555 | 53.1588102 | -27.7971545 | 1.921(s) | 0.44 | ||||
| 24279 | 53.1630047 | -27.7976545 | 1.980(s) | 0.37 | ||||
| 24626 | 53.1651596 | -27.7858696 | 1.317(s) | 3.69 |
4 Annular Photometry of Massive Passively Evolving Galaxies
We measure azimuthally–averaged color gradients for the six galaxies by carrying out aperture–matched, multi–band annular photometry. A problem we face when implementing this procedure was how to properly define the set of concentric apertures for each galaxy in such a way that it optimally samples the color gradient. After some experimentation with automated procedures to determine the annuli based on the effective radius (typically in the H–band), however, we resort to set them manually based on a visual inspection of the (z-H) color images. We test the robustness of our result against the choice of the apertures by perturbing them around the visually determined positions and also by choosing equally–spaced annuli simply based on the (visually established) extent of the color gradient. While variations at the level of 10–15% were observed, in no case these would change our results and conclusions. The chosen annular apertures for each galaxy are shown as white circles in Figure 1. Obviously, while with a sample of six galaxies it is relatively simple to manually set the concentric apertures, dealing with large samples will require an automated procedure to be developed. We plan to come back to this problem in a future paper.
Before carrying out the multi–band photometry an additional step was necessary, namely matching the angular resolution of the images in all the filters to that of the H band PSF to eliminate any artificial color gradients introduced by differences in image quality. This varies from 0.12′′ in the BViz bands to 0.18′′ in the YJH bands. We will discuss this procedure in the next section.
4.1 PSF Matched Images
We measure the PSF in each band from seven well exposed and non–saturated stars whose SExtractor stellarity index in the i-band is larger than 0.98. These stars are used as input to the IRAF DAOPHOT package to generate an average PSF image in each band. DAOPHOT fits an analytical profile to the central region within FWHM and adds the averaged outskirts of the stars to the best-fit profile. Once we build the PSF for each of the BVizYJ bands, we use the package IRAF PSFMATCH to calculate a smoothing kernel and convolve each image to match its resolution to that of the H-band.
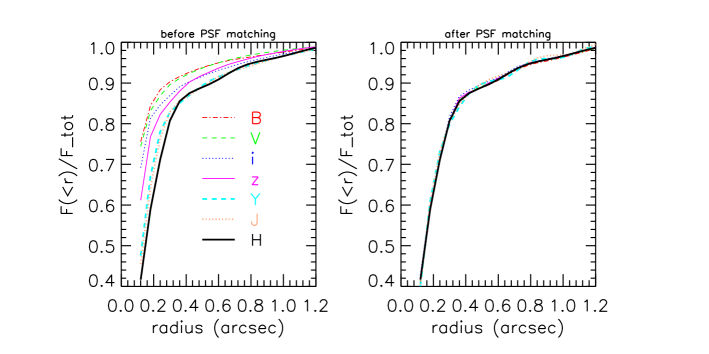
We test the effectiveness of PSF matching by comparing the fractional encircled energy of each PSF before and after the procedure. Figure 2 shows that after matching, the PSF in all bands have identical profile, especially within the central region (roughly 0.4′′ ), where the gradient is steepest. There are some very small fluctuations in the wing (0.4′′ to 1.0′′ ) of the Y and J band PSFs, due to differences in the airy rings of the original PSF. These, however, are smaller than 2% and thus we neglect them, since they will not cause any detectable bias in our analysis.

In addition to testing the homogeneity of the matched PSF, we also verify the effectiveness of the PSF matching procedure in measuring realistic color gradients by means of simulations that, at the same time, also give us information on the effects of the PSF variations across the field. We generate a model galaxy with given colors and then inserted it into the images in seven different positions In practice, we use each of the seven stars that went into building the average PSF as position–dependent PSF themselves, after appropriate normalization. For the model galaxy we use a Sérsic spheroid with index and effective radius kpc in the H–band, and assigned (X-H) color, where X is one of BVizYJ. We convolve the model image with the seven PSFs in each band and inserted the result in the corresponding image in proximity to the star. Then, we apply the PSF–matching procedures to the images and measured the color gradient of the galaxy at its seven different potions as if these were real measures. Figure 3 shows the difference between the “observed” color gradient and the input one in each band at each of the seven positions. As the figure shows, there is no evidence of significant systematic bias introduced by the PSF–matching procedure, with all the deviations consistent with having random nature. The case of the B band is the one with the largest deviations, but while the scatter of is comparatively large, the mean difference between the output and the input colors at radius less than 0.6′′ does not significantly deviate from zero. In the annulus between 0.6′′ and 0.9′′, the simulations suggest that we underestimate the (B-H) color by magnitude, although the B–band flux of PEGs in our targeted redshift range is so faint that the background fluctuation, rather than the mismatching of PSFs, likely dominates the uncertainty of the color measurement. In practice, however, this has no direct consequence in our analysis, since we do not use B–band derived color gradients. In conclusion, our test shows that the PSF–matching procedures is effective in recovering the color gradient and introduces no significant bias to our measurements.
4.2 The Reliability of the Annular Photometry: the Probability Distribution of Photometric Redshift
We also conduct a further test of the robustness of results derived from the multi–band annular–aperture photometry by comparing the photometric redshift derived from each annulus to that measured from the integrated photometry. In principle, the redshift of an annulus should be the same as that of the whole galaxy. If large deviations are encountered this flags potential bias in results derived from the annular photometry, especially for the most outer annulus, where the S/N in the bluer bands is significantly lower than the redder ones and, as we have seen for the B band, other systematics can affect the measures.
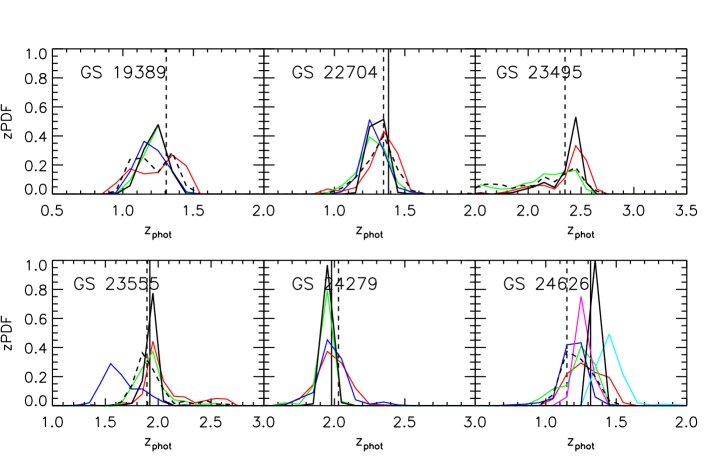
Figure 4 shows the probability distribution function of the photometric redshift measured with the HST BVizJH photometry for the annuli and for the whole galaxy for each of our sources. The figure also plots the photometric redshift of the galaxies derived from the integrated GUTFIT photometry, as well as the spectroscopic redshift if available. Generally, there is good agreement between the photometric redshift of the annuli and that of the whole galaxy, with the differences between the peaks of the distribution function of the annuli and the whole galaxy photometric or spectroscopic redshift being typically . Exceptions are two of the annuli of galaxy 24626, which deviate from the spectroscopic redshift by , and the outermost annulus of galaxy 23555, which differs from both the spectroscopic and photometric redshifts (which agree very well with each other) by .
Overall, the agreement between the annuli’s photometric redshift and the spectroscopic or photometric redshift of the whole galaxies is typical of this types of measures, with no indication that fitting of the observed SED of the annuli to stellar population synthesis models to derive the properties of the stellar populations might be affected by systematics or other problems.
Finally, we wish to point out that the availability of resolved multi–band photometry of sub–structures with more homogeneous color distribution than the whole galaxy provides a powerful means to improve the photometric redshift measurements, as well as to investigate the reason behind catastrophic failures. Although the redshift probability distribution of the individual sub–structure does, in general, deviate from the true redshift due to random errors, the combined probability distribution, i.e. their product, is generally closer to the true redshift and more sharply distributed than that of the whole galaxy, because the simpler case of the homogeneous colors of the sub–structures is better described by the stellar population synthesis models than the more complex case of the generally much larger color dispersion inside the whole galaxy. This is illustrated in Figure 4, which shows that the peak of the combined redshift probability distribution of each galaxy is closer than the individual ones to the spectroscopic or the (12–band) photometric redshift, with typical deviations . For example, although the annuli redshift probability distribution of galaxy 24626 show relatively large deviations from the spectroscopic redshift, the combined distribution deviates only by , a more accurate estimate than that of the 12–band photometric redshift, which has . We plan to return on this technique using data from the HST CANDELS (Cosmic Assembly Near Infra–red Deep Extragalactic Legacy Survey) program (co-PIs: Sandra Faber and Henry Ferguson), which in portions of the survey area will include photometry in two additional filters, F814W and F998W, in addition to those discussed here. This will provide even more accurate estimates of photometric redshift and stellar population parameters.
5 Color Gradients in Massive Passively Evolving Galaxies
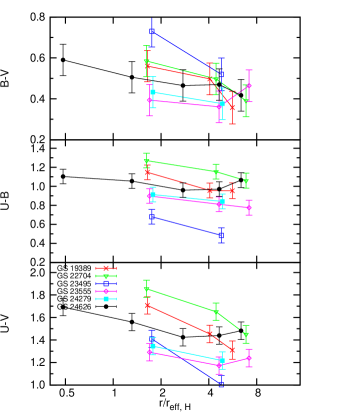
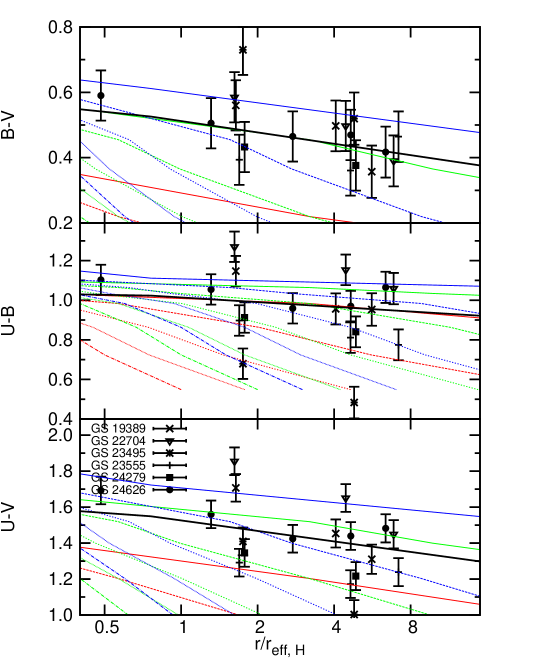
To investigate possible dependence of the color gradients of the PEGs with other integrated physical properties of the galaxies and also to compare them to those of local early–type galaxies, we interpolate the observed photometry in the annuli to the rest–frame U, B and V band and then obtain the corresponding (U-B), (U-V) and (B-V) colors (e.g. see Dahlen et al. (2005)). Figure 5 shows the color gradients of the six massive PEGs, where the rest–frame colors of the annuli are plotted against the annulus radius expressed in unit of the H–band half–light radius (). For five galaxies the available angular resolution and sensitivity allow us to measure the color gradients from to . For galaxy 24626, due to its much larger size (in the H band we measure kpc), we are able to follow the color gradients down to a much smaller radius, .
To the extent that our sample is representative of early–type galaxies at , it appears that these systems have negative color gradients in all the three colors that we consider, in the sense that stellar population in these galaxies becomes bluer with increasing separation from the center. This property can already be inferred from a visual inspection of the (z-H) color images shown in Figure 1, where all galaxies exhibit red cores and blue outskirts.
The colors of two of the galaxies appear invert the blueing trend at large radii, i.e. their color gradient shows an upturn to the red at –4. Galaxy 23555 exhibits the red upturn in both the (B-V) and (U-V) color gradients. The photometric redshift probability distribution of the outermost annulus of this galaxy (see §4.2) shows a relatively large deviation from its spectroscopic redshift, suggesting that the photometry of this area of the galaxy is subject to some systematics. A visual inspection of the the H–band image reveals that this galaxy resides in a relatively dense environment, with a luminous, large companion and a bright star located nearby. Low–surface brightness H–band light from these sources is very likely contaminating the outermost annulus of the galaxy. Galaxy 24626 has upturns in the (U-B) and (U-V) color gradients. Although there are no large or bright sources nearby, a few faint ones are located close to its outermost annulus. These sources are also more extended in the near–IR bands than at the optical ones, and may significantly contribute red light to the outskirts of the galaxy.
Our findings of red cores and blue outskirts in massive PEGs at are in apparent contradiction of what reported by Menanteau et al. (2001a, 2004), who also find that a large fraction (30%) of spheroidal galaxies at have strong internal color variations, but in most of their cases the cores appear bluer than the surrounding areas, suggesting that blue cores are common in elliptical galaxies. Menanteau et al. (2001b) even concluded that most (60%) of their spheroids formed at . Regardless of the difference of targeted cosmic epochs between their and our works, different sample selection criteria could be the main reason of the apparent discrepancy. Our galaxies are selected with both early–type morphology and very low SSFR determined by SED–fitting, while Menanteau et al. (2001a, 2004) only selected galaxies with E/S0 morphology in HST I F814W images, independent of their potential star–formation activity. We also note the a recent work by Gargiulo et al. (2011) also reported that 50% of their sample of 20 early–type galaxies at z1.5 has significant radial color variation, with five with red cores and five with blue cores. Their sample was also selected through morphology, mainly based on the visual inspection of HST/ACS F850LP images and further cleaned by removing sources with Sérsic index n2 or clear irregular residuals resulting from light profile fitting Saracco et al. (2010). It is likely that the slope of color gradient (negative or positive) has relation with the star–formation activity of galaxies, even they all have early–type morphology. Besides, both Menanteau et al. (2001a, 2004) and Gargiulo et al. (2011) also found a significant fraction (40%50%) of their galaxies to have red cores as ours. However, our sample only contains six galaxies and cannot allow to carry out a good statistical analysis to compare with them. The upcoming CANDELS will provide much larger samples to evaluate the fraction of red cores in early–type galaxies at z2.
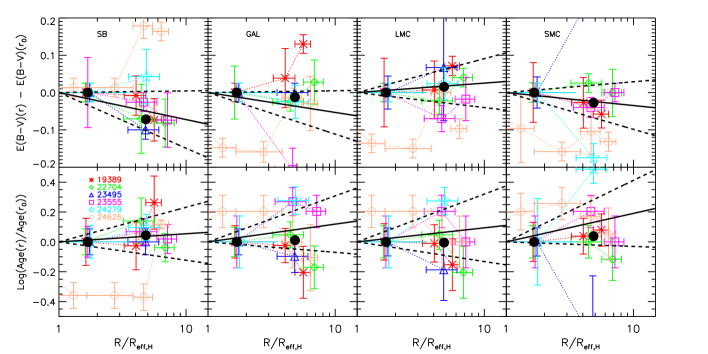
We investigate the dependence of the color gradients on the integrated properties of the stellar populations of the galaxies. Figure 6 shows the slope (C and R are the color and the radius) of the color gradients as a function of redshift, stellar mass , color excess E(B-V) as a proxy of dust obscuration, and the global rest–frame (U-V) color of the galaxies. The properties of the stellar populations have been measured from fitting the 12–band GUTFIT photometry of the whole galaxies to spectral population synthesis models, as described in §3. We find that the slopes have a mild dependence on the the dust extinction E(B-V), in the sense that galaxies with higher dust obscuration tend to have steeper color gradient (larger slopes). At face value this seems to suggest that the origin of color gradients is somehow related to the dust content of the galaxies. We also find that slopes have a weak dependence on the global rest-frame (U-V) colors of galaxies, with redder (U-V) colors corresponding to steeper color gradients. No dependence of the slopes on redshift and is could be observed.

We also compare the slopes of the color gradients of the galaxies with that of local ellipticals (dashed lines). The local slopes were measured by Wu et al. (2005), who studied the color gradients of a sample of 36 nearby early–type galaxies from the Early Data Release of the Sloan Digital Sky Survey and from the Two Micron All Sky Survey. The slopes of the galaxies that have little or no dust extinction are similar to those of the local galaxies, while the galaxies with more pronounced obscuration have steeper color gradients. The color gradients of local elliptical galaxies are generally interpreted as evidence of metallicity gradients (e.g., Tamura et al., 2000; Wu et al., 2005; La Barbera & de Carvalho, 2009). We will investigate the origins of the color gradients in the galaxies in next two sections.
6 Variation of Single Parameter as the Origin of Color Gradients
In view of the analysis of the color gradients with SED fitting to spectral population synthesis models to understand their physical origin, in this section we investigate whether it is plausible that the radial variation of one single parameter can be primarily responsible for them. In other words, the observed color gradients can, in general, be explained to the radial variation of age, dust obscuration and metallicity of the stellar populations, either individually or in combination. Here we constrain the radial gradient of any one of these parameters needs to be, while keeping the others constant, for it to be solely responsible for the observed color gradients and discuss the implications. We assume simple parametrization for the dependence of the selected parameter with the radius, and, for simplicity, we only use a single stellar population (SSP) model from CB09 as representative of the SED of our passively evolving galaxies.
First, we study the possibility that an age gradient is responsible for the
observed color gradients, while keeping metallicity and dust obscuration
constant with radius. We model the age gradient as
,
where is the age at the center,
and thus a model is fully described by a set of four values of the parameters
, , Z, E(B-V). Rather than finding best–fit models we let the
parameters vary within a four dimensional (4–D) grid chosen so that the results
model predictions for the color gradients bracketed the observed ones. The 4–D
grid is defined by , and , E(B-V) = 0.0, 0.05, 0.10 and 0.15, = 1, 2 and 3 Gyr,
= -0.2, -0.4, -0.6, -0.8 and -1.0. Given a point in the grid,
i.e. the vector (, , Z, E(B-V)), we compute the color gradients
of (U-B), (U-V) and (B-V) as a function of radius. We also
calculate the as a metric to characterize the goodness of a model in
describing the observations, defined as:
| (2) |
where and are the observed color and its uncertainty at a given radius, the predicted color at the radius, and the total number of observed colors at all radii.
Figure 7 shows the model color gradients for (B-V), (U-B) and (U-V) compared them with the data. For simplicity, we only show the case of Z= and E(B-V)=0 in the plot. Blue, green and red lines correspond to = 3, 2 and 1 Gyrs, while the different line patterns show the cases of : -0.2 (solid), -0.4 (long dashed), -0.6 (short dashed), -0.8 (dotted) and -1.0 (dashed-dotted).
The top panel shows that the (B-V) color gradient is best approximated by the solid green line, i.e. Gyr and =-0.2 (). But the middle and bottom panel show that this set of parameters overestimates the (U-B) () and (U-V) () color gradients. The (U-B) color gradient is actually best approximated by the green long-dashed line ( Gyr and =-0.4, ), while the (U-V) one by the long–dashed blue line ( Gyr and =-0.4, ).
Even when we change value of the Z and E(B-V) within the preassigned range we still cannot find a combination of and that can simultaneously provide a good description for all the three color gradients. The parameter set that best reproduces the (U-B) color gradient is (, , Z, E(B-V)) = (3.0, -0.6, 0.2, 0.15) with , that of (U-V) by (3.0, -0.4, , 0.0) with , and that of (B-V) by (1.0, -0.2, 2.5, 0.15) with . We also determine which model minimizes the combined , namely . This model, shown by the black lines in the figure correspond to (, , Z, E(B-V)) = (3.0, -0.2, 0.2, 0.0), with , and .
Since there always is a different combination of the model parameters in our chosen 4–D grid that brackets different set of observed colors, we conclude that no combination of and with constant Z and E(B-V), i.e. age alone, can simultaneously explain the three observed gradients.
We also repeat the same analysis for the case of a metallicity gradient and obscuration gradient to see if either one of these could be responsible for the color gradients, finding similar negative conclusions.
For the case of the metallicity gradient, the parameter sets that best fit the (U-B), (U-V) and (B-V) color gradients are (, , t, E(B-V)) = (2.5, -0.4, 1.0, 0.0) with , (, -0.6, 1.0, 0.15) with and (2.5, -0.8, 1.0, 0.15) with . The corresponding parameter set that results in the minimum combine is (, -0.6, 1.0, 0.15) with . For the case of the obscuration gradient, the parameter sets that best reproduce the (U-B), (U-V) and (B-V) color gradients are (, , t, Z) = (0.15, -0.08, 1.0, 0.2) with , (0.15, -0.04, 1.0, 0.2) with and (0.15, -0.08, 1.0, ) with . The one that minimizes the combined is (0.15, -0.06, 1.0, 0.2) with .
In conclusion, unless the assumption of SSP is grossly inadequate for describing the rest–frame UV/Optical SED of our passively–evolving massive galaxies at , it seems unlikely that the radial dependence of only one parameter among age, metallicity or dust obscuration (with the other two being constant) can be responsible for the observed color gradients. These must originate from the interplay of the gradients of age, extinction and metallicity.
7 Stellar Population Gradients in Massive Passively Evolving Galaxies
We investigate the nature of the observed color gradients by fitting the HST 7–band photometry (ACS BViz and WFC3/IR YJH) in the annular apertures defined before (see Figure 8) to the CB09 spectral population synthesis models to derive the radial dependence of stellar mass, specific star–formation rate, age and dust obscuration of the stellar populations in the annuli. We approximate the star formation history with an exponentially declining model (), where the age of the stellar populations is the time from the beginning of the star formation to the time of observation. During the fitting, the redshift of each annulus is kept fixed to the spectroscopic redshift or to the photometric redshift of the whole galaxy measured from the GUTFIT 12–band photometry.
While this procedure yields robust estimates of the stellar mass, dust obscuration, age and metallicity suffer from larger uncertainties and degeneracies (e.g., Papovich et al., 2001; Shapley et al., 2001; Lee et al., 2010; Maraston et al., 2010). The degeneracy between age, metallicity and dust obscuration is partially broken if rest–frame infrared photometry is available, as shown by several authors (de Jong, 1996; Cardiel et al., 2003; MacArthur et al., 2004; Wu et al., 2005). Unfortunately, high–angular resolution photometry for our galaxies is limited to rest–frame UV and optical wavelengths, and thus we cannot effectively separate the role that each parameter plays in the observed color gradients. To gain some insight, however, we can make some simplifications and reduce the number of free parameters. Instead of letting the metallicity free to vary in each annulus during the fit, we set it according to one of the following three assumed power–law metallicity gradients: (1) flat, with logarithmic slope ; (2) the metallicity gradient of local early–type galaxies, with (Wu et al., 2005); (3) the gradient predicted by the monolithic collapse model, with (Carlberg, 1984). The latter model is meant to represent the case where the galaxies have formed “in situ” at some epoch prior that of observation through some relatively rapid process.
In the local universe, elliptical galaxies have very little dust obscuration and their stellar populations are essentially coeval in the sense that their age spread is small compared to the mean age (e.g., Tamura & Ohta, 2004; Wu et al., 2005; La Barbera & de Carvalho, 2009). The situation can be very different at . The universe is only Gyr old at this time, and thus the approximation of coevality is almost certainly no longer valid, since this time is comparable to that required to make a galaxy develop an early–type SED following the cessation of star formation. Furthermore, we do not understand the mechanisms of dust destruction well enough to make robust predictions on the dust content of early–type galaxies at . Dust is expected to disappear on a time–scale of years after the end of star formation, but this is not observed (e.g., Draine, 2009, and reference therein). Thus, we study the more general case where both dust obscuration and age are left as free parameters. We will discuss the case of no dust in our analysis later.
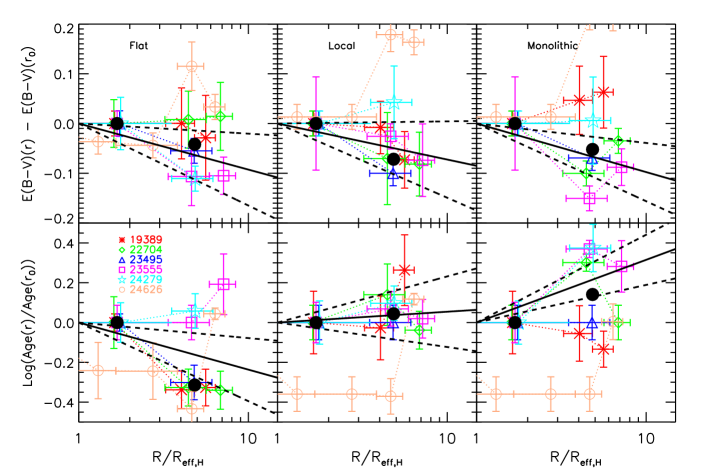
Figure 9 plots, for each galaxy, the gradients of E(B-V) and age from the fits expressed as the ratio between the value at center and that in each annulus for each of the three assumptions on the metallicity gradient. The error bar for each annulus is the standard deviation of the best–fit values from 200 realizations from Monte Carlo bootstrap simulations. The figure also shows the average gradient of each parameter and its best–fit slope , where is either E(B-V) or log(age), is the radius, and the average includes all sample galaxies but 24626. The best–fit slope and its 1 uncertainty are plotted in the figure as black solid and dashed lines, respectively.
Galaxy 24626 is excluded from the average, because, as Figure 9 shows, its gradients of dust obscuration and age are very different from those of the other galaxies. Its half–light radius and Sérsic index, kpc and Sérsic index (see Cassata et al., 2010), the largest size and most concentrated light profile in the sample, as well as its stellar mass, , are typical of the bright elliptical galaxies in the local universe often observed in groups with estimated total (dark matter) mass (Guo et al., 2009). Thus, it is likely that the star–formation and/or stellar–mass assembly history of this galaxy considerably differ from those of the other five samples galaxies, a fact that might reflect in the radial gradients of its stellar population properties. We also note that although the zYJH band images show a regular spheroidal morphology out to ′′, the B–band image reveals that the galaxy has a close companion at about 1′′ corresponding to 8.4 kpc or , from its center.
Figure 9 also shows that, regardless of the assumptions on the metallicity gradient, the implied average E(B-V)s always has a mild gradient in the sense that the centers () of the galaxies have slightly higher dust extinction () than the outer regions (). Both the slope and the amplitude of the dust gradient do not depend on the assumed metallicity gradient, implying that a mild negative gradient of dust obscuration is very likely a real feature of massive PEGs at , contributing at least in part, to the observed color gradients. This is consistent with the finding, discussed in §5, that the slope of color gradient of the individual galaxies correlate with the global E(B-V) value, i.e. the one from the best–fit of each galaxies’ GUTFIT 12–band photometry to spectral population synthesis models.
Due to the age–metallicity degeneracy, however, the contribution of an age gradient to the observed color gradient is much harder to determine, since it strongly depends on the assumed gradient of metallicity. As Figure 9 shows, a flat metallicity gradient results in the outer regions of the galaxies being 60% younger than the center, while if the local metallicity gradient were assumed then the galaxies would have a flat age gradient. Finally, in the case of the metallicity gradient predicted be the monolithic collapse model, the stellar populations in the outer regions would by 2 times older than those in the center.
Color gradients and internal color dispersion of intermediate–redshift early–type galaxies have been extensively studied in the past (e.g. Abraham et al., 1999; Menanteau et al., 2001a, 2004). Abraham et al. (1999) studied eleven 11 early-type galaxies at in the Hubble Deep Field (HDF), finding that most (7/11) have internal color dispersion consistent with being old and coeval, and implying a small age gradient in the early–type galaxies at higher redshift. Similar properties remain valid at as well (Wu et al., 2005). While this is qualitatively consistent with the null age gradient of our galaxies under the assumption of local metallicity gradient, in practice a quantitative comparison requires an accuracy in measuring the age that we do not have. At the age of the universe is about 3.2 Gyr, while it is 8.4 Gyr at , and our finding of Gyr age gradient with flat metallicity gradient means that the fractional age differential is %. This, however, becomes % (or % at ) just because the universe has become older. In the next section we will discuss the implications of the assumptions on the metallicity gradients for the evolution of the galaxies from to the present.
8 Discussion
8.1 Dust Gradient
8.1.1 Necessity and Robustness
The mild gradient of dust obscuration, together with its apparent robustness against assumptions on the metallicity gradient, that seems to characterize massive early–type galaxies at is in general agreement with the fact that dust obscuration in early–type galaxies in the local universe is not a dominant effect in determining their rest–frame UV/Optical color and color gradient. Thus, it appears that the lack of a significant presence of dust, or at least of its effects in the UV/Optical rest–frame SED, is a common feature of passively–evolving galaxies, regardless of the cosmic epoch when they are observed. Evidently, whatever physical mechanism is responsible for the destruction of dust in the aftermath of the cessation of star formation in these systems, must act on a significantly shorter time scale than that required to make the galaxy’s SED become typical of a “red and dead” system.
Both the inferred dust gradient and the absolute value of dust obscuration are comparatively small, and , and, as we have seen, robust against the assumptions on the metallicity gradient. An important question is whether or not the opposite is also true, namely that dust can be neglected when studying the effects of the age and metallicity gradients in the observed color gradients and their implications on the evolution of the galaxies, both prior and subsequent to the epoch of the observations. To answer this question we re–run the fitting procedure in each annulus under the two assumptions: (1) zero dust extinction; (2) dust extinction in each annulus fixed to the integrated value for the whole galaxy from the best–fit of the 12–band GUTFIT photometry to the models, i.e. no E(B-V) gradient. For simplicity, we only consider the case of the local metallicity gradient.
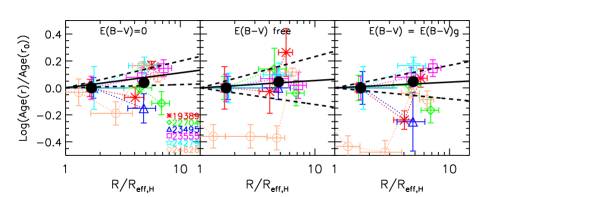
The results are shown in Figure 10, where the new derived age gradients (left and right panels) are compared with the age gradient derived by letting dust as a free parameter in the fitting (middle). While the individual points vary, albeit within their error bars, the average age gradient remains unchanged in all three cases, regardless of the assumption on dust obscuration.
When the dust obscuration is fixed to zero or to the global 12–band value, the fit yields systematically larger reduced than in the case of free dust. This is not just the effect of an extra free parameter in the fit: when we compare the best–fit SED models with the observed photometry, the free dust case obviously yields better agreement, especially in the B band, the most affected by dust obscuration. So, dust does play a role in determining the colors of the galaxies (the dust gradient slope means that the rest–frame B-V color becomes on average bluer by 0.07 mag from to ). The absolute value of dust obscuration and its spatial gradient are small enough, however, that uncertainties on both these quantities can be neglected when setting constraints to the age and metallicity gradient from the observed color gradient, which are important to infer the evolutionary history of the galaxies as we are going to discuss in the next section.
Throughout this study we have used the starburst obscuration law (Calzetti et al., 1994, 2000) to model the effects of dust. While this is appropriate in the case of starburst galaxies, it is now known if it remains a good description in the case of the low SSFR, massive galaxies observed at , such as our sample. Regardless, however, this choice appears to actually be a conservative one for the implied effects of dust in the color gradients, as we directly verify by repeating our analysis using the Galactic (Cardelli et al., 1989), LMC (Fitzpatrick, 1986) and SMC (Prevot et al., 1984) obscuration laws. For simplicity, we only consider the case of local metallicity gradient. As Figure 11 shows, the slope of the dust obscuration gradient is reduced to when the Galactic and SMC laws are used, and it is close to zero in the LMC case.
The color gradient of local early–type galaxies is explained in terms of a metallicity gradient (e.g., Wu et al., 2005). As discussed by Wise & Silva (1996), however, a dust gradient can also reproduce the observed broadband color gradients in many ellipticals. Using HST images, van Dokkum & Franx (1995) found that 48% of 64 early-type galaxies show highly concentrated dust absorption at the centers of the galaxies. The sizes of the dust absorption regions are generally smaller than 1 kpc. Rest et al. (2001) and Tran et al. (2001) found dust features in 29 out of 67 galaxies (43%), including 12 with small nuclear dusty disks, while Lauer et al. (2005) found central dust in about half of the 77 galaxies that they observed with the HST/WFPC2.
Both an external and internal origin of the dust in the local galaxies have been proposed. The strongest evidence for the external origin, in which galaxies obtain their dust from mergers or accretions, is that the distribution and motions of ionized gas and dust in some locale early-type galaxies seem unrelated to the motions of stars (e.g., Goudfrooij & de Jong, 1995; van Dokkum & Franx, 1995; Caon et al., 2000). However, Mathews & Brighenti (2003) and Temi et al. (2007) argued that the dynamical infall time from the edge of a local early-type galaxy (several yrs) is compatible to the time scale of dust destruction due to the sputtering by hot X-ray gas ( yrs). Therefore, in the external origin, cold gas and dust should be regularly supplied to galaxies in a time scale of yrs. But observations of local early-type galaxies do not find such evidence. In fact, mergers between early-type galaxies and dusty galaxies are rarely observed in local universe. The lack of effective dust resupplies strongly points to the internal origin, in which dust is produced inside the galaxies by either the mass loss from evolving red giant stars (e.g., Temi et al., 2007) or M-star winds, as discussed in Lauer et al. (2005).
Understanding the origin of dust in massive PEGs at requires spatially resolved stellar and gas kinematics, which are not available. If they have undergone merger or accretions to some extent in their past, dust obtained during these events should settle to the center with dynamical infall time, a few yrs. If this dust is responsible for the observed obscuration gradients, then this would argue against the existence of hot X–ray emitting gas, which would otherwise sputter the dust in a shorter time scale ( yrs). If such gas does exist, then a more plausible mechanism to form dust gradients is the episodic settling model proposed by Lauer et al. (2005) to explain the existence and frequency of nuclear dust in local early-type galaxies. The model predicts that dust appears several time throughout the galaxy and then is destroyed as it falls into the center. Therefore, the existence of hot gas in the massive PEGs at is a key to judge the possible formation mechanisms. Unfortunately, although hot gas is commonly observed in many (or most) local massive elliptical galaxies (see the review of Mathews & Brighenti, 2003), no study on hot gas has been done for galaxies at , limited by the sensitivity of our current X-ray detectors.
8.2 Metallicity Gradient
In the previous sections we have seen that, because of the age–metallicity degeneracy, different assumptions for the metallicity gradient result in different age gradients, given the observed color gradients. We have also seen that uncertainties on the dust obscuration (both the total amount and its gradient) do not affect the quantitative details of the relationship between age and metallicity, given the current uncertainty. Thus, an interesting question to ask is: given a realistic assumption for the metallicity gradient at , namely one that is consistent with the metallicity gradient seen in early–type galaxies and with our current ideas on how metallicity gradients evolve, what is the implied gradient of stellar population age? What would such an age gradient tell us about the way PEGs assembled and their subsequent evolution, if they really are the progenitors of the local early–type galaxies?
8.2.1 Flat Metallicity Gradient
Under the assumption of a flat metallicity gradient, i.e. metallicity is constant as a function of radius, the observed color gradients of the galaxies imply a negative age gradient, namely the age of the stellar populations is younger as the radial distance from the center increases, with average gradient . Stars located at from those in the center are, on average, Gyr younger. The SSFR is also higher in the outer regions. For example, the external rings in three of the galaxies, 19389, 22704 and 24626 have SSFR, larger than the global value we use to classify the galaxies as passive. The younger stellar populations and larger specific star formation rate in the outskirts of the galaxies could mean a later cessation of star formation relative to the center, newer episodes of star formation or accretion of younger stellar populations.
It is interesting, at this purpose, to explore whether the residual star formation in the outskirts can explain the apparent size evolution of massive passively–evolving galaxies from to , as discussed by recent studies (e.g., Daddi et al., 2005; Trujillo et al., 2006, 2007; van Dokkum et al., 2008; Cassata et al., 2010). To do so, we simulate a galaxy with Sérsic index and effective radius kpc (typical values for massive PEGs at , see by Cassata et al. (2010)), central SSFR and the same SSFR gradient as the one in Figure 9. If this galaxy evolves from to only through in-situ star formation, i.e. with no significant accretion of external stars, our calculation shows that it cannot evolve into today’s typical massive early–type galaxies, which have and , since that would require the SSFR in the outskirts to be dex higher than the central one SSFR, a much steeper gradient than our observations seem to find. This implies that external mechanisms, such as merger and accretion, are necessary to build the extended halos of massive PEGs from to . We also note that the assumption of flat metallicity results in the steepest positive SSFR gradient compared to the local metallicity gradient and the monolithic–collapse gradient that we will discuss next. Thus, these two cases, too, would imply external mechanisms if the massive PEG are to evolve into the local early types.
If merger and accretion do drive the evolution, they must be able to do so in a way that makes the flat metallicity gradient evolve into the one observed in local early–type galaxies, , while at the same time cancel the negative age gradient, since the age the stellar populations in local galaxies has very little but positive radial dependence (e.g., Tamura & Ohta, 2004; Wu et al., 2005; La Barbera & de Carvalho, 2009). While secular orbit mixing could help explain today’s flat age gradient, it seems hard to understand how a flat metallicity gradient at can evolve into the local one if major merger drives the evolution, since major merger is believed to flatten, not steepen the metallicity gradient (Kobayashi, 2004).
8.2.2 Local Metallicity Gradient
If we assume that the PEGs have the same metallicity gradient as their local counterparts, the observed color gradients imply no age gradient, as shown in the middle panel of Figure 9. In other words, the radial dependence of metallicity and age of the the stellar populations of the galaxies is already similar to that of their local counterparts. Furthermore, the implied gradient of SSFR is also flat. Thus, if merger or accretion drive the evolution to , this must happen in a way that maintains the gradients of metallicity and age roughly constant in time. Since major merger appears to flatten the metallicity gradient (Kobayashi, 2004), the assumption of the local metallicity gradient would also imply a more gradual accretion process as the one responsible for the apparent growth in size of PEG from to the present (e.g. van Dokkum et al., 2010).
8.2.3 Monolithic metallicity gradient
The monolithic collapse is an idealized model in which a whole worth of stars of a massive galaxy form during dynamical time scale. Although a recent monolithic collapse model by Pipino et al. (2010) that allows certain scatter for the star formation efficiency would produce the metallicity gradient that agrees with the observation of local elliptical galaxies, earlier models by Larson (1974) and Carlberg (1984) define a maximum steepness boundary in the metallicity gradient slope–mass plane. We discuss models by Larson (1974) and Carlberg (1984) here simply as the limiting case of a class of assembly mechanisms capable to produce the steepest metallicity gradient across the galaxy.
During the monolithic collapse, stars begin to form everywhere in the collapsing cloud and, once formed, remain in their orbits with little net inward motion, while the gas keeps sinking to the center of the galaxy due to dissipation. While getting closer to the center, the gas become more and more enriched by the rapidly evolving massive stars. Consequently, stars formed in the central regions are more metal rich than those formed in the outskirts. Stellar feedback tends to reduce the inflow of gas and hence reduce the metallicity gradient. But gas outflows occur earlier and more effectively at large galactocentric distance than in the center due to lower escape velocity, lowering the star–formation rate at larger distance and contribute to create a strong negative metallicity gradient and a positive age one.
Under the assumption of the monolithic collapse metallicity gradient, the observed color gradients of our sample galaxies indeed imply a positive age gradient such that the stars at in are Gyr older than those in the central regions. We could directly test this prediction of the monolithic collapse (or equivalent scenarios), if we were able to independently measure the age gradient, something that is not possible with the present data. The monolithic collapse metallicity gradient also implies a weak SSFR gradient for our galaxies such that the outer regions at have SSFR dex lower than in the center. This is qualitative consistent with the general feature of the model that stellar feedback is more effective at larger radii than at the center at reducing the star formation activity222We note that according to Martinelli et al. (1998) constant star formation efficiency with galactocentric distance can also explain the observed metallicity gradient and the correlation between colors/metallicity and escape velocity in early–type galaxies.
If the PEGs observed at formed through mechanisms similar to monolithic collapse, their subsequent evolution must be such to significantly reduce the magnitude of their metallicity gradient and to a minor extent the age gradient, since the monolithic–collapse gradient is much steeper (Larson, 1974; Carlberg, 1984) than that observed in local ellipticals (e.g., Peletier et al., 1990b; Idiart et al., 2003; Tamura & Ohta, 2003). Major merger provides such a mechanism Kobayashi (2004), although the effectiveness of minor merger or gas accretion and subsequent star formation in diminishing the steep metallicity gradient is not known.
The monolithic collapse model also predicts that the slope of the metallicity gradient, and hence the color gradient, depends on the mass of the galaxies, because a deeper potential well is more effective at retaining metals in the center than a shallower one and thus make more metal–rich stars (e.g., Tortora et al., 2010). As shown in Figure 5, the color gradient of our galaxies does not show any obvious dependence on the stellar mass, to the extent that this quantity is a good proxy for the galaxies’ total mass. The relative high scatter in our small sample and the limited stellar mass dynamic range that it probes, however, might hide such signal. We will return to the correlation of the color gradient with the galaxies’ properties using a much larger and significantly deeper sample extracted from the new WFC3 CANDELS survey.
Independent measures of the age gradient of the stellar populations would also test if mechanisms similar to the monolithic collapse play a role in assembling the PEG, since in this case the stars in the central regions would be younger than those in the outskirts. In fact, such an inverted age gradient is requested by our data in order to reproduce the observed color gradients if the metallicity gradient of the monolithic collapse is assumed, since this would result in significantly steeper color gradients, as we have directly verified.
8.3 Formation of Passively Evolving Galaxies at z2
It is more likely, however, that massive PEGs at z2 are formed through gas–rich major mergers rather than a single collapse process. Recently, Wuyts et al. (2010) analyzed SPH simulations of gas–rich mergers and their remnants that are treated with radiative transfer. They predicted that quiescent compact galaxies at z2 should typically show red cores and their color gradients should be a superposition of age, dust, and metallicity gradients. They found that in the gas–rich merger scenario, stars in the galactic center are formed during final coalescence out of more obscured and enriched gas. The dust and metallicity gradients compensate the positive age gradient (young center and old outskirts) so that their cores are typical when these galaxies are classified as passive systems. They also predicted that the strength of the color gradient to be correlated with galaxy’s integrated color. All these predictions agree well with our observations and serve as important evidence of the validity of gas–rich major mergers.
Even if gas–rich major merger is considered as the formation mechanism of massive PEGs at z2, their subsequent evolution is still ambiguous. Kobayashi (2004) predicts that gas–rich merger can effectively flatten the metallicity gradient to the one of local early–types. Therefore, mechanisms that can significantly flatten the metallicity gradient, such as major merger, are not required in the subsequent evolution. Wuyts et al. (2010), however, find that the typical metallicity gradient in the simulated z 2 gas-rich merger remnants is steeper than the typical metallicity gradient of local early–types. This requires major mergers in the subsequent evolution to flatten the metallicity gradient, unless other mechanisms (accretion and minor merger) are proved to be capable to flatten the metallicity gradient too.
Overall, with the current data it is not possible to conclusively rule out or validate any of the three cases of metallicity gradients and possible formation mechanisms of massive PEGs at z2 that we have discussed. Passively evolving galaxies appear to undergo substantial structural evolution from to that reduces their compactness and stellar density (e.g., Daddi et al., 2005; Trujillo et al., 2006, 2007; van Dokkum et al., 2008; Cassata et al., 2010) If major merging events are the driver of this evolution, to the extent that we understand how merger rearranges gradients of metallicity and age, it seems unlikely that the PEG have flat metallicity gradients, since subsequent merger can only keep it flatter, not steepen it to an extent required to match the observed one in local ellipticals. Of course, the size evolution can be driven by less dramatic minor merging events or continuous accretion, as some have suggested (van Dokkum et al., 2010). We do not know what these mechanisms would imply for the evolution of the metallicity and age gradients compatible with the color gradients observed at if they have to evolve into those observed at . Finally, we remind that our discussion is based on resolved photometry that only covers the UV/Optical rest frame. Future high–resolution observations with JWST extending the wavelength baseline to the near and mid–IR will allow us to considerably reduce the extent of the age–metallicity degeneracy, and help us constraint a self–consistent evolutionary scenario for the assembly of the PEG, as well as their subsequent evolution.
9 Summary
We have discussed the implications of the detection of color gradients in early–type galaxies at from deep high–angular resolution images at optical and near–IR wavelengths obtained with HST and the ACS and WFC3 cameras.
In particular, we have measured resolved rest–frame UV-optical colors of a sample of six massive () and passively evolving (SSFR) galaxies at . After defining for each galaxy a set of concentric apertures that optimally sample the observed gradient of colors, we have carried out fits to spectral population synthesis models using the available seven–band (BVizYJH) photometry to derive how dust obscuration (E(B-V)), mean age, specific star formation rate (SSFR), and stellar mass () vary with the galactocentric distance. We have then used this information to discuss possible evolutionary scenarios for these galaxies in light of recent results on the apparent evolution of their morphological evolution and on theoretical expectations on how merger modifies existing gradients of metallicity and stellar age. This paper can be summarized as follows:
-
1.
Color gradients could be measured over scales that typically go up to , where is the effective radius of the Sérsic profile. The HST images show that the inner regions of these galaxies have redder rest-frame UV–optical colors (U-V, U-B and B-V) than their outer parts.
-
2.
The slopes of the color gradients have no dependence on the redshift and stellar mass of the galaxies. However, they have a mild dependence on the global dust extinction and rest-frame U-V color of the galaxies. Galaxies with larger E(B-V) or redder U-V color tend to have steeper color gradients.
-
3.
The slopes of the color gradients of these galaxies are generally steeper than that of local early-type galaxies.
-
4.
We investigate whether the variation of a single parameter (age, extinction, or metallicity) along radius can be used to explain the observed color gradients. Using the single stellar population model, we find that the variation of any single parameter cannot simultaneously fit the three observed color gradients (U-B, U-V and B-V) with the maximum likelihood. We conclude that the observed color gradients of massive PEGs at cannot be explained by a single gradient of age, extinction or metallicity and should be originated from an interplay of gradients of the three parameters.
-
5.
The fits of spatially resolved stellar populations to the spectral population synthesis models are run under three assumptions of metallicity gradients: (1) a flat metallicity gradient (), (2) the metallicity gradient of local early-type galaxies (), and (3) the gradient predicted by the monolithic collapse ().
-
6.
Regardless of the assumptions on metallicity, a modest gradient of dust obscuration is always implied from the fits in the sense that the central regions of the galaxies have slightly higher dust obscuration than the outer parts, with an average gradient of , if the starburst obscuration law by Calzetti et al. (1994, 2000) is used. Other extinction laws that we have tested (MW, SMC, LMC) result in smaller obscuration gradients. Overall, both the absolute value of dust obscuration and its gradient are small, however, consistently with the present–day early–type galaxies, where dust generally has small, if any effects on the observed colors. It appears that once a galaxy has become passive, for whatever physical mechanisms, dust obscuration ceases to play a significant role in the determining the UV/Optical SED.
-
7.
While dust obscuration contributes in small measure to the observed color gradients of the galaxies, its presence does not seem to affect the general age–metallicity degeneracy in the sense that the implied gradient of age derived from a given assumption for the gradient of metallicity does not depend on how dust is treated, i.e. if forced to a fixed value or left as a free parameter in each annulus, or on the adopted extinction law. Whatever inference on the age or on the metallicity gradient is made, after assuming one or the other parameter, does not seem to appreciably depend on the assumption on dust obscuration.
-
8.
Due to the age–metallicity degeneracy, the derived age gradients are strongly coupled with the assumed metallicity gradients: (1) assuming a flat metallicity gradient, the outer regions of the galaxies are younger than the inner regions with a age gradient of ; (2) assuming the metallicity gradient observed in local early–type galaxies, the stellar populations in the outer regions have same age as those in the inner regions; and (3) for the metallicity gradients predicted by the monolithic collapse, the outer regions are older than the inner regions, with the average age gradient . Their specific star–formation rate is also 0.5 dex lower than that in the inner regions.
-
9.
The mass–size (or equivalently mass–stellar density) relationship of the galaxies cannot evolve into the local one only through in–situ star formation driven by the small observed star–formation activity (SSFR yr-1 or less). This implies the accretion of stellar mass from outside (van Dokkum et al., 2010).
-
10.
Overall, with the current data it is not possible to conclusively rule out or validate any of the three cases of metallicity gradients that we have considered. A major source of uncertainty is the fact that major merger rearranges the gradients of metallicity and age on a short time scale, while less dramatic events such as minor merger or a more continuous accretion might induce a more “secular” evolution of these properties. Passively evolving galaxies appear to undergo substantial structural evolution from to that reduces their compactness by a factor of 3–5 and their stellar density by orders of magnitude (e.g., Daddi et al., 2005; Trujillo et al., 2006, 2007; van Dokkum et al., 2008; Cassata et al., 2010) If major merging events are the driver of this evolution, then, to the extent that we understand how merer rearranges gradients of metallicity and age, it seems unlikely that the PEG have flat metallicity gradients, since subsequent merger can only keep it flatter, not steepen it to an extent required to match the observed one in local ellipticals. Of course, the size evolution can be driven by minor merger/accretion, as some have suggested (van Dokkum et al., 2010). In this case, we have much less guidance in inferring which metallicity and age gradients are compatible with the color gradients observed at if they have to evolve into those observed at .
-
11.
While it is possible that the subsequent evolution reconciles the metallicity and age gradient emerging from the monolithic collapse to those observed at , the observations do not seem to show any correlation between the strength of the color gradient and the stellar mass, which is predicted if the PEG formed through such a mechanism. The inherent statistical noise in a sample as small as ours, and the fact that the sample itself only covers a small dynamic range in mass, can very well hide any such correlation. We do observe, however, a correlation between the color gradient and the dust obscuration (E(B-V)), even if such parameter is generally much less accurately estimated with broad–band SED fitting than the stellar mass, which is the most accurate one. This seems to support the lack of a correlation between the color gradient and the stellar mass, and thus argue against the monolithic collapse, or any formation mechanism capable to produce an equally steep metallicity gradient, as responsible for the formation of the PEG. We will return on this subject using substantially large samples of such sources from the CANDELS project.
-
12.
The metallicity gradient of the galaxies could be either close to that of the local early–type galaxies or flat. In the first case, the subsequent evolution must be such to preserve the metallicity gradient, which would seem to rule out major merger. In the second case, the evolution must create the gradient. This also seems to rule out major merger, since it can only flatten, not steepen, the gradient.
We thank Houjun Mo, Eric Gawiser and Massimo Stiavelli for useful comments and discussions. YG, MG, PC and SS acknowledge support from NASA grants HST-GO-9425.36-A, HST-GO-9822.45-A, and HST-GO-10189.15-A, awarded by the Space Telescope Science Institute, which is operated by the Association of Universities for Research in Astronomy, Inc. (AURA) under NASA contract NAS 5-26555.
References
- Abraham et al. (1999) Abraham, R. G., Ellis, R. S., Fabian, A. C., Tanvir, N. R., & Glazebrook, K. 1999, MNRAS, 303, 641
- Arnouts et al. (2007) Arnouts, S., Walcher, C. J., Le Fèvre, O., Zamorani, G., Ilbert, O., Le Brun, V., Pozzetti, L., Bardelli, S., Tresse, L., Zucca, E., Charlot, S., Lamareille, F., McCracken, H. J., Bolzonella, M., Iovino, A., Lonsdale, C., Polletta, M., Surace, J., Bottini, D., Garilli, B., Maccagni, D., Picat, J. P., Scaramella, R., Scodeggio, M., Vettolani, G., Zanichelli, A., Adami, C., Cappi, A., Ciliegi, P., Contini, T., de la Torre, S., Foucaud, S., Franzetti, P., Gavignaud, I., Guzzo, L., Marano, B., Marinoni, C., Mazure, A., Meneux, B., Merighi, R., Paltani, S., Pellò, R., Pollo, A., Radovich, M., Temporin, S., & Vergani, D. 2007, A&A, 476, 137
- La Barbera & de Carvalho (2009) La Barbera, F., & de Carvalho, R. R. 2009, ApJ, 699, L76
- Beckwith et al. (2006) Beckwith, S. V. W., Stiavelli, M., Koekemoer, A. M., Caldwell, J. A. R., Ferguson, H. C., Hook, R., Lucas, R. A., Bergeron, L. E., Corbin, M., Jogee, S., Panagia, N., Robberto, M., Royle, P., Somerville, R. S., & Sosey, M. 2006, AJ, 132, 1729
- Bell et al. (2003) Bell, E. F., McIntosh, D. H., Katz, N., & Weinberg, M. D. 2003, ApJS, 149, 289
- Benson et al. (2003) Benson, A. J., Bower, R. G., Frenk, C. S., Lacey, C. G., Baugh, C. M., & Cole, S. 2003, ApJ, 599, 38
- Bouwens et al. (2010) Bouwens, R. J., Illingworth, G. D., Oesch, P. A., Stiavelli, M., van Dokkum, P., Trenti, M., Magee, D., Labbé, I., Franx, M., Carollo, C. M., & Gonzalez, V. 2010, ApJ, 709, L133
- Brinchmann & Ellis (2000) Brinchmann, J., & Ellis, R. S. 2000, ApJ, 536, L77
- Calzetti et al. (2000) Calzetti, D., Armus, L., Bohlin, R. C., Kinney, A. L., Koornneef, J., & Storchi-Bergmann, T. 2000, ApJ, 533, 682
- Calzetti et al. (1994) Calzetti, D., Kinney, A. L., & Storchi-Bergmann, T. 1994, ApJ, 429, 582
- Caon et al. (2000) Caon, N., Macchetto, D., & Pastoriza, M. 2000, ApJS, 127, 39
- Cardelli et al. (1989) Cardelli, J. A., Clayton, G. C., & Mathis, J. S. 1989, ApJ, 345, 245
- Cardiel et al. (2003) Cardiel, N., Gorgas, J., Sánchez-Blázquez, P., Cenarro, A. J., Pedraz, S., Bruzual, G., & Klement, J. 2003, A&A, 409, 511
- Carlberg (1984) Carlberg, R. G. 1984, ApJ, 286, 416
- Cassata et al. (2010) Cassata, P., Giavalisco, M., Guo, Y., Ferguson, H., Koekemoer, A. M., Renzini, A., Fontana, A., Salimbeni, S., Dickinson, M., Casertano, S., Conselice, C. J., Grogin, N., Lotz, J. M., Papovich, C., Lucas, R. A., Straughn, A., Gardner, J. P., & Moustakas, L. 2010, ApJ, 714, L79
- Cimatti et al. (2008) Cimatti, A., Cassata, P., Pozzetti, L., Kurk, J., Mignoli, M., Renzini, A., Daddi, E., Bolzonella, M., Brusa, M., Rodighiero, G., Dickinson, M., Franceschini, A., Zamorani, G., Berta, S., Rosati, P., & Halliday, C. 2008, A&A, 482, 21
- Croton et al. (2006) Croton, D. J., Springel, V., White, S. D. M., De Lucia, G., Frenk, C. S., Gao, L., Jenkins, A., Kauffmann, G., Navarro, J. F., & Yoshida, N. 2006, MNRAS, 365, 11
- Daddi et al. (2004) Daddi, E., Cimatti, A., Renzini, A., Fontana, A., Mignoli, M., Pozzetti, L., Tozzi, P., & Zamorani, G. 2004, ApJ, 617, 746
- Daddi et al. (2005) Daddi, E., Renzini, A., Pirzkal, N., Cimatti, A., Malhotra, S., Stiavelli, M., Xu, C., Pasquali, A., Rhoads, J. E., Brusa, M., di Serego Alighieri, S., Ferguson, H. C., Koekemoer, A. M., Moustakas, L. A., Panagia, N., & Windhorst, R. A. 2005, ApJ, 626, 680
- Dahlen et al. (2010) Dahlen, T., Mobasher, B., Dickinson, M., Ferguson, H. C., Giavalisco, M., Grogin, N. A., Guo, Y., Koekemoer, A., Lee, K., Lee, S., Nonino, M., Riess, A. G., & Salimbeni, S. 2010, ApJ, 724, 425
- Dahlen et al. (2005) Dahlen, T., Mobasher, B., Somerville, R. S., Moustakas, L. A., Dickinson, M., Ferguson, H. C., & Giavalisco, M. 2005, ApJ, 631, 126
- de Jong (1996) de Jong, R. S. 1996, A&A, 313, 377
- De Lucia et al. (2006) De Lucia, G., Springel, V., White, S. D. M., Croton, D., & Kauffmann, G. 2006, MNRAS, 366, 499
- Draine (2009) Draine, B. T. 2009, in Astronomical Society of the Pacific Conference Series, Vol. 414, Astronomical Society of the Pacific Conference Series, ed. T. Henning, E. Grün, & J. Steinacker, 453–+
- Driver et al. (2006) Driver, S. P., Allen, P. D., Graham, A. W., Cameron, E., Liske, J., Ellis, S. C., Cross, N. J. G., De Propris, R., Phillipps, S., & Couch, W. J. 2006, MNRAS, 368, 414
- Faber (1972) Faber, S. M. 1972, in Bulletin of the American Astronomical Society, Vol. 4, Bulletin of the American Astronomical Society, 224–+
- Fan et al. (2008) Fan, L., Lapi, A., De Zotti, G., & Danese, L. 2008, ApJ, 689, L101
- Fioc & Rocca-Volmerange (1997) Fioc, M., & Rocca-Volmerange, B. 1997, A&A, 326, 950
- Fitzpatrick (1986) Fitzpatrick, E. L. 1986, AJ, 92, 1068
- Fontana et al. (2006) Fontana, A., Salimbeni, S., Grazian, A., Giallongo, E., Pentericci, L., Nonino, M., Fontanot, F., Menci, N., Monaco, P., Cristiani, S., Vanzella, E., de Santis, C., & Gallozzi, S. 2006, A&A, 459, 745
- Fontana et al. (2009) Fontana, A., Santini, P., Grazian, A., Pentericci, L., Fiore, F., Castellano, M., Giallongo, E., Menci, N., Salimbeni, S., Cristiani, S., Nonino, M., & Vanzella, E. 2009, A&A, 501, 15
- Franx et al. (2003) Franx, M., Labbé, I., Rudnick, G., van Dokkum, P. G., Daddi, E., Förster Schreiber, N. M., Moorwood, A., Rix, H.-W., Röttgering, H., van de Wel, A., van der Werf, P., & van Starkenburg, L. 2003, ApJ, 587, L79
- Gargiulo et al. (2011) Gargiulo, A., Saracco, P., & Longhetti, M. 2011, MNRAS, 67
- Gonzalez-Perez et al. (2011) Gonzalez-Perez, V., Castander, F. J., & Kauffmann, G. 2011, MNRAS, 411, 1151
- Giavalisco et al. (2004) Giavalisco, M., Dickinson, M., Ferguson, H. C., Ravindranath, S., Kretchmer, C., Moustakas, L. A., Madau, P., Fall, S. M., Gardner, J. P., Livio, M., Papovich, C., Renzini, A., Spinrad, H., Stern, D., & Riess, A. 2004, ApJ, 600, L103
- Goudfrooij & de Jong (1995) Goudfrooij, P., & de Jong, T. 1995, A&A, 298, 784
- Guo et al. (2009) Guo, Y., McIntosh, D. H., Mo, H. J., Katz, N., van den Bosch, F. C., Weinberg, M., Weinmann, S. M., Pasquali, A., & Yang, X. 2009, MNRAS, 398, 1129
- Hogg et al. (2002) Hogg, D. W., Blanton, M., Strateva, I., Bahcall, N. A., Brinkmann, J., Csabai, I., Doi, M., Fukugita, M., Hennessy, G., Ivezić, Ž., Knapp, G. R., Lamb, D. Q., Lupton, R., Munn, J. A., Nichol, R., Schlegel, D. J., Schneider, D. P., & York, D. G. 2002, AJ, 124, 646
- Hopkins et al. (2010) Hopkins, P. F., Bundy, K., Hernquist, L., Wuyts, S., & Cox, T. J. 2010, MNRAS, 401, 1099
- Hopkins et al. (2009b) Hopkins, P. F., Bundy, K., Murray, N., Quataert, E., Lauer, T. R., & Ma, C. 2009b, MNRAS, 398, 898
- Hopkins et al. (2009c) Hopkins, P. F., Lauer, T. R., Cox, T. J., Hernquist, L., & Kormendy, J. 2009c, ApJS, 181, 486
- Idiart et al. (2003) Idiart, T. P., Michard, R., & de Freitas Pacheco, J. A. 2003, A&A, 398, 949
- Ilbert et al. (2010) Ilbert, O., Salvato, M., Le Floc’h, E., Aussel, H., Capak, P., McCracken, H. J., Mobasher, B., Kartaltepe, J., Scoville, N., Sanders, D. B., Arnouts, S., Bundy, K., Cassata, P., Kneib, J.-P., Koekemoer, A., Le Fèvre, O., Lilly, S., Surace, J., Taniguchi, Y., Tasca, L., Thompson, D., Tresse, L., Zamojski, M., Zamorani, G., & Zucca, E. 2010, ApJ, 709, 644
- Kellermann et al. (2008) Kellermann, K. I., Fomalont, E. B., Mainieri, V., Padovani, P., Rosati, P., Shaver, P., Tozzi, P., & Miller, N. 2008, ApJS, 179, 71
- Kobayashi (2004) Kobayashi, C. 2004, MNRAS, 347, 740
- Kriek et al. (2006a) Kriek, M., van Dokkum, P. G., Franx, M., Förster Schreiber, N. M., Gawiser, E., Illingworth, G. D., Labbé, I., Marchesini, D., Quadri, R., Rix, H.-W., Rudnick, G., Toft, S., van der Werf, P., & Wuyts, S. 2006a, ApJ, 645, 44
- Kriek et al. (2006b) Kriek, M., van Dokkum, P. G., Franx, M., Quadri, R., Gawiser, E., Herrera, D., Illingworth, G. D., Labbé, I., Lira, P., Marchesini, D., Rix, H.-W., Rudnick, G., Taylor, E. N., Toft, S., Urry, C. M., & Wuyts, S. 2006b, ApJ, 649, L71
- La Barbera et al. (2005) La Barbera, F., de Carvalho, R. R., Gal, R. R., Busarello, G., Merluzzi, P., Capaccioli, M., & Djorgovski, S. G. 2005, ApJ, 626, L19
- Laidler et al. (2007) Laidler, V. G., Papovich, C., Grogin, N. A., Idzi, R., Dickinson, M., Ferguson, H. C., Hilbert, B., Clubb, K., & Ravindranath, S. 2007, PASP, 119, 1325
- Larson (1974) Larson, R. B. 1974, MNRAS, 166, 585
- Lauer et al. (2005) Lauer, T. R., Faber, S. M., Gebhardt, K., Richstone, D., Tremaine, S., Ajhar, E. A., Aller, M. C., Bender, R., Dressler, A., Filippenko, A. V., Green, R., Grillmair, C. J., Ho, L. C., Kormendy, J., Magorrian, J., Pinkney, J., & Siopis, C. 2005, AJ, 129, 2138
- Le Fèvre et al. (2000) Le Fèvre, O., Abraham, R., Lilly, S. J., Ellis, R. S., Brinchmann, J., Schade, D., Tresse, L., Colless, M., Crampton, D., Glazebrook, K., Hammer, F., & Broadhurst, T. 2000, MNRAS, 311, 565
- Lee et al. (2010) Lee, S., Ferguson, H. C., Somerville, R. S., Wiklind, T., & Giavalisco, M. 2010, ApJ, 725, 1644
- Luo et al. (2008) Luo, B., Bauer, F. E., Brandt, W. N., Alexander, D. M., Lehmer, B. D., Schneider, D. P., Brusa, M., Comastri, A., Fabian, A. C., Finoguenov, A., Gilli, R., Hasinger, G., Hornschemeier, A. E., Koekemoer, A., Mainieri, V., Paolillo, M., Rosati, P., Shemmer, O., Silverman, J. D., Smail, I., Steffen, A. T., & Vignali, C. 2008, ApJS, 179, 19
- MacArthur et al. (2004) MacArthur, L. A., Courteau, S., Bell, E., & Holtzman, J. A. 2004, ApJS, 152, 175
- Madau (1995) Madau, P. 1995, ApJ, 441, 18
- Mancini et al. (2010) Mancini, C., Daddi, E., Renzini, A., Salmi, F., McCracken, H. J., Cimatti, A., Onodera, M., Salvato, M., Koekemoer, A. M., Aussel, H., Le Floc’h, E., Willott, C., & Capak, P. 2010, MNRAS, 401, 933
- Maraston et al. (2010) Maraston, C., Pforr, J., Renzini, A., Daddi, E., Dickinson, M., Cimatti, A., & Tonini, C. 2010, MNRAS, 407, 830
- Martinelli et al. (1998) Martinelli, A., Matteucci, F., & Colafrancesco, S. 1998, MNRAS, 298, 42
- Mathews & Brighenti (2003) Mathews, W. G., & Brighenti, F. 2003, ARA&A, 41, 191
- Menanteau et al. (2001a) Menanteau, F., Abraham, R. G., & Ellis, R. S. 2001a, MNRAS, 322, 1
- Menanteau et al. (2004) Menanteau, F., Ford, H. C., Illingworth, G. D., Sirianni, M., Blakeslee, J. P., Meurer, G. R., Martel, A. R., Benítez, N., Postman, M., Franx, M., Ardila, D. R., Bartko, F., Bouwens, R. J., Broadhurst, T. J., Brown, R. A., Burrows, C. J., Cheng, E. S., Clampin, M., Cross, N. J. G., Feldman, P. D., Golimowski, D. A., Gronwall, C., Hartig, G. F., Infante, L., Kimble, R. A., Krist, J. E., Lesser, M. P., Miley, G. K., Rosati, P., Sparks, W. B., Tran, H. D., Tsvetanov, Z. I., White, R. L., & Zheng, W. 2004, ApJ, 612, 202
- Menanteau et al. (2001b) Menanteau, F., Jimenez, R., & Matteucci, F. 2001b, ApJ, 562, L23
- Miller et al. (2008) Miller, N. A., Fomalont, E. B., Kellermann, K. I., Mainieri, V., Norman, C., Padovani, P., Rosati, P., & Tozzi, P. 2008, ApJS, 179, 114
- Naab et al. (2009) Naab, T., Johansson, P. H., & Ostriker, J. P. 2009, ApJ, 699, L178
- Naab et al. (2007) Naab, T., Johansson, P. H., Ostriker, J. P., & Efstathiou, G. 2007, ApJ, 658, 710
- Naab & Ostriker (2009) Naab, T., & Ostriker, J. P. 2009, ApJ, 690, 1452
- Nonino et al. (2009) Nonino, M., Dickinson, M., Rosati, P., Grazian, A., Reddy, N., Cristiani, S., Giavalisco, M., Kuntschner, H., Vanzella, E., Daddi, E., Fosbury, R. A. E., & Cesarsky, C. 2009, ApJS, 183, 244
- Oesch et al. (2010) Oesch, P. A., Bouwens, R. J., Illingworth, G. D., Carollo, C. M., Franx, M., Labbé, I., Magee, D., Stiavelli, M., Trenti, M., & van Dokkum, P. G. 2010, ApJ, 709, L16
- Oesch et al. (2007) Oesch, P. A., Stiavelli, M., Carollo, C. M., Bergeron, L. E., Koekemoer, A. M., Lucas, R. A., Pavlovsky, C. M., Trenti, M., Lilly, S. J., Beckwith, S. V. W., Dahlen, T., Ferguson, H. C., Gardner, J. P., Lacey, C., Mobasher, B., Panagia, N., & Rix, H. 2007, ApJ, 671, 1212
- Oke (1974) Oke, J. B. 1974, ApJS, 27, 21
- Onodera et al. (2010) Onodera, M., Daddi, E., Gobat, R., Cappellari, M., Arimoto, N., Renzini, A., Yamada, Y., McCracken, H. J., Mancini, C., Capak, P., Carollo, M., Cimatti, A., Giavalisco, M., Ilbert, O., Kong, X., Lilly, S., Motohara, K., Ohta, K., Sanders, D. B., Scoville, N., Tamura, N., & Taniguchi, Y. 2010, ApJ, 715, L6
- Papovich et al. (2001) Papovich, C., Dickinson, M., & Ferguson, H. C. 2001, ApJ, 559, 620
- Peletier et al. (1990a) Peletier, R. F., Davies, R. L., Illingworth, G. D., Davis, L. E., & Cawson, M. 1990a, AJ, 100, 1091
- Peletier et al. (1990b) Peletier, R. F., Valentijn, E. A., & Jameson, R. F. 1990b, A&A, 233, 62
- Pipino et al. (2010) Pipino, A., D’Ercole, A., Chiappini, C., & Matteucci, F. 2010, MNRAS, 407, 1347
- Prevot et al. (1984) Prevot, M. L., Lequeux, J., Prevot, L., Maurice, E., & Rocca-Volmerange, B. 1984, A&A, 132, 389
- Rest et al. (2001) Rest, A., van den Bosch, F. C., Jaffe, W., Tran, H., Tsvetanov, Z., Ford, H. C., Davies, J., & Schafer, J. 2001, AJ, 121, 2431
- Saracco et al. (2010) Saracco, P., Longhetti, M., & Gargiulo, A. 2010, MNRAS, L115+
- Shapley et al. (2001) Shapley, A. E., Steidel, C. C., Adelberger, K. L., Dickinson, M., Giavalisco, M., & Pettini, M. 2001, ApJ, 562, 95
- Tamura et al. (2000) Tamura, N., Kobayashi, C., Arimoto, N., Kodama, T., & Ohta, K. 2000, AJ, 119, 2134
- Tamura & Ohta (2003) Tamura, N., & Ohta, K. 2003, AJ, 126, 596
- Tamura & Ohta (2004) —. 2004, MNRAS, 355, 617
- Temi et al. (2007) Temi, P., Brighenti, F., & Mathews, W. G. 2007, ApJ, 660, 1215
- Thompson et al. (1999) Thompson, D., Beckwith, S. V. W., Fockenbrock, R., Fried, J., Hippelein, H., Huang, J.-S., von Kuhlmann, B., Leinert, C., Meisenheimer, K., Phleps, S., Röser, H.-J., Thommes, E., & Wolf, C. 1999, ApJ, 523, 100
- Tortora et al. (2010) Tortora, C., Napolitano, N. R., Cardone, V. F., Capaccioli, M., Jetzer, P., & Molinaro, R. 2010, MNRAS, 407, 144
- Tran et al. (2001) Tran, H. D., Tsvetanov, Z., Ford, H. C., Davies, J., Jaffe, W., van den Bosch, F. C., & Rest, A. 2001, AJ, 121, 2928
- Trujillo et al. (2007) Trujillo, I., Conselice, C. J., Bundy, K., Cooper, M. C., Eisenhardt, P., & Ellis, R. S. 2007, MNRAS, 382, 109
- Trujillo et al. (2006) Trujillo, I., Feulner, G., Goranova, Y., Hopp, U., Longhetti, M., Saracco, P., Bender, R., Braito, V., Della Ceca, R., Drory, N., Mannucci, F., & Severgnini, P. 2006, MNRAS, 373, L36
- van der Wel et al. (2009) van der Wel, A., Bell, E. F., van den Bosch, F. C., Gallazzi, A., & Rix, H. 2009, ApJ, 698, 1232
- van Dokkum & Franx (1995) van Dokkum, P. G., & Franx, M. 1995, AJ, 110, 2027
- van Dokkum et al. (2008) van Dokkum, P. G., Franx, M., Kriek, M., Holden, B., Illingworth, G. D., Magee, D., Bouwens, R., Marchesini, D., Quadri, R., Rudnick, G., Taylor, E. N., & Toft, S. 2008, ApJ, 677, L5
- van Dokkum et al. (2010) van Dokkum, P. G., Whitaker, K. E., Brammer, G., Franx, M., Kriek, M., Labbé, I., Marchesini, D., Quadri, R., Bezanson, R., Illingworth, G. D., Muzzin, A., Rudnick, G., Tal, T., & Wake, D. 2010, ApJ, 709, 1018
- Vanzella et al. (2008) Vanzella, E., Cristiani, S., Dickinson, M., Giavalisco, M., Kuntschner, H., Haase, J., Nonino, M., Rosati, P., Cesarsky, C., Ferguson, H. C., Fosbury, R. A. E., Grazian, A., Moustakas, L. A., Rettura, A., Popesso, P., Renzini, A., Stern, D., & The Goods Team. 2008, A&A, 478, 83
- Wise & Silva (1996) Wise, M. W., & Silva, D. R. 1996, ApJ, 461, 155
- Wu et al. (2005) Wu, H., Shao, Z., Mo, H. J., Xia, X., & Deng, Z. 2005, ApJ, 622, 244
- Wuyts et al. (2010) Wuyts, S., Cox, T. J., Hayward, C. C., Franx, M., Hernquist, L., Hopkins, P. F., Jonsson, P., & van Dokkum, P. G. 2010, ApJ, 722, 1666