An extended infrared study of the phase diagram of the -doped Cu-O plane
Abstract
The -plane optical conductivity of eleven single crystals, belonging to the families Sr2-xCuO2Cl2, Y1-xCaxBa2Cu3O6, Bi2Sr2-xLaxCuO6, and Bi2Sr2CaCu2O8 has been measured with hole concentrations between 0 and 0.18, and for 6 K 500 K to obtain an infrared picture of the phase diagram of the Cu-O plane. At extreme dilution ( = 0.005), a narrow peak is observed at 1570 cm-1 (195 meV), that we assign to a single-hole bound state. For increasing doping, that peak broadens into a far-infrared (FIR) band whose low-energy edge sets the insulating gap. The insulator-to-metal transition (IMT) occurs when the softening of the FIR band closes the gap thus evolving into a Drude term. In the metallic phase, a multi-band analysis identifies a mid-infrared band which weakly depends on temperature and softens for increasing , while the extended-Drude analysis leads to an optical scattering rate larger than the frequency, as found in other cuprates. The infrared spectral weight is consistent with a Fermi liquid renormalized by strong correlations, provided that the term of the Sommerfeld expansion is included above 300 K. In the superconducting phase, the optical response of single-layer Bi2Sr2-xLaxCuO6 at optimum doping is similar to that of the corresponding optimally-doped bilayer Bi2Sr2CaCu2O8.
pacs:
71.30.+h, 74.25.Gz, 78.30.j1 Introduction
Despite twentyfive-year-long experimental and theoretical efforts, the low-energy electrodynamics of the high- cuprates still presents phenomena, both in the normal and in the superconducting phase, which are not fully understood [1, 2]. Among them we can cite the pseudogap, which in the plane does not manifest itself in the optical conductivity but only in the scattering rate, the bosonic spectral feature at 41 meV, the anomalous dependence of the spectral weight on frequency and temperature, the effect of the superconducting transition up to energies larger than the optical gap by one-two orders of magnitude, and so on. The understanding of those intriguing phenomena can be improved by collecting further spectroscopic data on the different high- families, in order to enucleate the common features of the Cu-O plane electrodynamics at low energy. Here we present an extended study in the infrared of the family Bi2Sr2-xLaxCuO6 (BSLCO), on the track of those previously performed, for instance, on La2-xSrxCuO4 (LSCO) [3, 4], YBa2Cu3O6+δ (YBCO) [4], and PbxBi2-xLaySr2-yCuO6+δ [5].
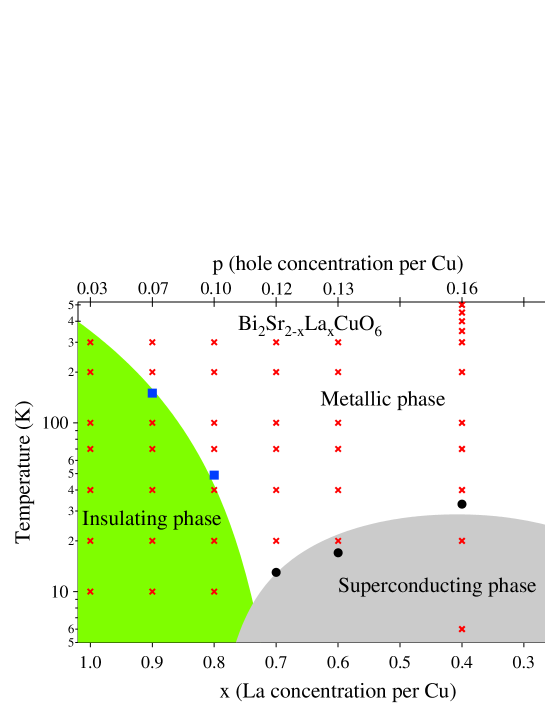
BSLCO is, like LSCO, a single-layer cuprate where the hole doping can be finely controlled [6]: the hole concentration can be varied from 0.03 to 0.19 by decreasing from 1.0 to 0.2, according to a well known [7] non-linear relation. Here also, the rather low critical temperature of BSLCO ( 33 K) allows for studies of the normal phase down to low . In addition, its crystals can be easily cleaved along the planes, so that spurious contributions to the measured reflectivity from the axis are automatically ruled out. On the other hand, the Cu-O planes of BSLCO exhibit a slight corrugation reminiscent of the 1: 5 superstructure of Bi2Sr2Cu2O8 (BSCCO) which here becomes incommensurate and doping dependent [8]. In BSCCO the only effect of the superlattice at infrared wavelengths is a slight difference between the reflectivity along the and the axis, especially above the plasma edge which separates the intraband from the interband range [9]. In Bi2Sr2-xLaxCuO6 we expect therefore that the slight and incommensurate corrugation of the Cu-O plane will be overwhelmed by the much stronger doping dependence of the reflectivity.
To extend our study below , we have also measured single crystals of Sr2-xCuO2Cl2 (SCOC) with 0 () and = 0.3 (), and of Y0.97Ca0.03Ba2Cu3O6 (YCBCO) (). In the present work we use BSLCO, SCOC, and YCBCO to identify common absorption features in the Cu-O plane, irrespective of the out-of-plane lattice structure, and to investigate how they change under a variation in the hole-doping of nearly two order of magnitude. In order to compare the optical behavior of BSLCO at optimum doping with that of BSCCO, both below and well above room temperature, we have also measured the reflectivity of a single crystal of the 2212 compound with = 93 K.
2 Experiment
The SCOC, BSLCO, and BSCCO single crystals were all grown by the floating-zone technique, and characterized as described elsewhere [7]. YCBCO was grown and characterized as described in Ref. [10]. The doping , hole concentration of the samples, and the critical temperature of the superconductors, are listed in table 1. The accuracy in the determination of for each value [11] is %. was determined both from the zero resistivity and from the onset of the Meissner signal in the SQUID magnetization measurement, with an uncertainty of K. For BSLCO, the temperatures and doping levels where the optical measurements were performed, are marked by the crosses in the () or () phase diagram of figure 1. This reproduces that traced in Ref. [12] on the basis of transport measurements in magnetic field, with slight adjustments of the coexistence lines. Indeed, in figure 1 the IMT line (the line) has been adapted to the squares (dots), which are extracted from the minima (the drop) in the curves of figure 2.
| Compound | (K) | ||
|---|---|---|---|
| Sr2-xCuO2Cl2 | 0.0 | 0.005 | 0 |
| 0.3 | 0.005 | 0 | |
| Y1-xCaxBa2Cu3O6 | 0.03 | 0.015 | 0 |
| Bi2Sr2-xLaxCuO6 | 1.0 | 0.03 | 0 |
| 0.9 | 0.07 | 0 | |
| 0.8 | 0.10 | 1.4 | |
| 0.7 | 0.12 | 13 | |
| 0.6 | 0.13 | 17 | |
| 0.4 | 0.16 | 33 | |
| 0.2 | 0.18 | 19 | |
| Bi2Sr2CaCu2O8 | 0.16 | 93 |
Figure 2 indeed shows the resistivity of both optimally-doped samples, Bi2Sr1.6La0.4CuO6 and Bi2Sr2CaCu2O8 up to 500 K, for the other crystals up to 300 K. The superconductors in figure 2(b), at least in the optimal doping region, display the ”famous” linear resistivity behavior from to the highest . In BSLCO with = 0.8 and = 0.10 instead the metallic behavior appears above 50 K only, while a broad minimum is observed above its K. The of the non-superconducting samples is reported in figure 2(a). It displays a typical insulating behavior () for all of them, except for BSLCO with = 0.9 , which looks like a poor metal above 100 K. Below 50 K, its diverges for according to a variable range hopping regime [7]. A check value of was determined also for the Y0.97Ca0.03Ba2Cu3O6 at 200 K [13]. The very large resistivity of the SCOC insulators has been reported at high temperature only, where the measuring range of our apparatus allowed for reliable measurements.
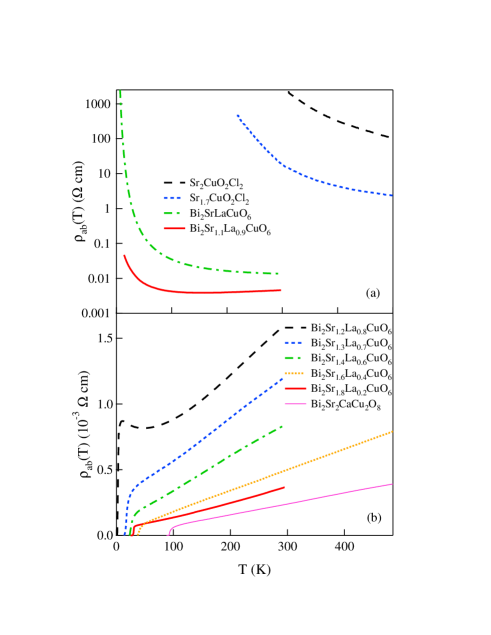
Basing on the data of figure 2, the IMT of the Cu-O plane in BSLCO can be placed between and . This finding is consistent with the Ioffe-Regel limit, which fixes the insulator-to-metal crossover where the mean free path is equal to the Fermi wavelength . Apart from numerical factors, this leads for the Cu-O plane of both BSLCO and LSCO [12] to the condition [14] . Here is the -axis lattice spacing. Indeed, following Ref. [12], from the (10 K) in figure 2, one obtains at and at . Magnetic fields on the order of 60 T displace the IMT [12] to .
The -plane reflectivity of the single crystals, obtained from the same batch of those used for resistivity measurements, has been measured at near-normal incidence with Michelson interferometers. The dimensions of the surfaces were between mm2 and mm2. Their thickness along the axis was m for all Bi-based crystals, 0.5 mm for YCBCO, 150 (180) m for Sr2-xCuO2Cl2 with 0 ( = 0.3).
The measurements were performed after thermoregulating the samples within 1 K between 10 or 40 K and 3 K between 300 and 500 K. In BSLCO and SCOC, they were made shortly after cleaving the sample surfaces parallel to the Cu-O planes, thus excluding any contribution from the axis. The reference in the infrared (visible) range was a gold (silver) film evaporated in situ onto the sample. This was mounted in a closed-cycle cryostat or, above K, inside an optical chamber under vacuum. At every , and for any spectral range, the intensity reflected by the sample was measured with and without coating, in order to compensate for the displacements of the sample holder due to thermal expansion. The chemical stability of both samples was checked by measuring at 300 K after every high- cycle.
In order to investigate the superconducting phase in the -plane reflectivity of the optimally doped samples, due to the small gap related to the relatively low ’s of Bi2Sr1.6La0.4CuO6, it was necessary to extend our measuring range to the sub-Terahertz region (1 THz cm-1). The necessary brilliance was provided by the Coherent Synchrotron Radiation (CSR) extracted from the storage ring BESSY II, working in the so-called low- mode [15]. Below 25 cm-1 we could thus measure the absolute reflectivity with a sensitivity of 1 % [16]. From 20 to 40 cm-1 we used incoherent synchrotron radiation and above that frequency conventional sources. The real part of the -plane optical conductivity was obtained from through Kramers-Kronig (KK) transformations. Preliminary extrapolations of to = 0 were based on Drude-Lorentz fits, which provided a which deviated from the measured at the same within a few percent. Afterwards, these fits were adjusted exactly to . In the superconducting phase the extrapolation was based on the London formula . The extrapolations to high frequency were based instead on the data of Ref. [17] up to 12.5 eV (100,000 cm-1) and on a power law beyond this energy.
3 The insulating phase and the insulator-to-metal transition
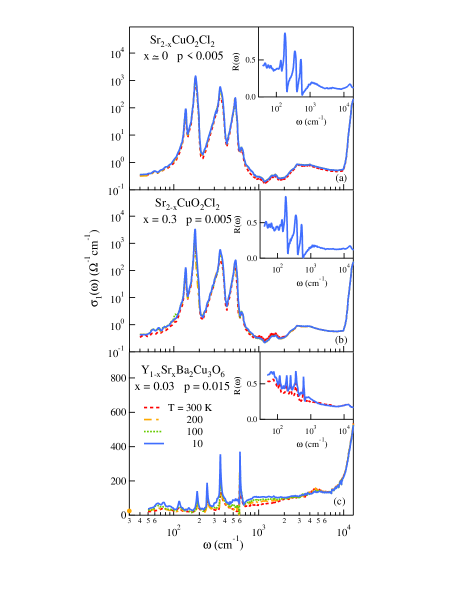
The optical conductivity of the lowest-doping insulators belonging to each family are reported in figure 3 for SCOC and YCBCO, and in figure 4(a) for BLSCO. The far infrared spectra are dominated by the peaks of the transverse optical (TO) phonons. At higher frequencies a broad contribution (mid-infrared, or MIR band) appears, already observed in many strongly correlated materials [18]-[21]. Its physical interpretation will be discussed in the next section. The edge of the charge transfer (CT) excitation from the O to the Cu orbitals can be instead observed in the visible. The peaks of the TO, infrared-active optical phonons of the plane are four in SCOC and six in YCBCO. In BSLCO one observes five pairs of lines instead of the six predicted by a factor-group analysis. Indeed, the bending mode involving the apical oxigen cannot be detected because of its low intensity [22]. The splittings of the remaining lines were already reported and explained in terms of distorted double Bi-O layers [22]. The lowest-frequency phonons can be assigned to translational modes of rare earth Bi and Sr(La) translational modes, while the mode at 445-480 cm-1 is assigned to the Bi-O bending. On the other hand, the phonon doublets at 350-390 cm-1 and 560-600 cm-1 involve only Cu and the O atoms building up the ochtaedral structures. They are associated with bending and stretching modes in Cu-O planes, respectively. The frequencies of all lines observed at the lowest measured , as obtained by fits to Lorentzians, are listed in table 1 and compared with those reported at 300 K in Ref. [22]. The phonon frequencies of YCBCO are very similar to those previously measured [22] on pure YBa2Cu3Oy.
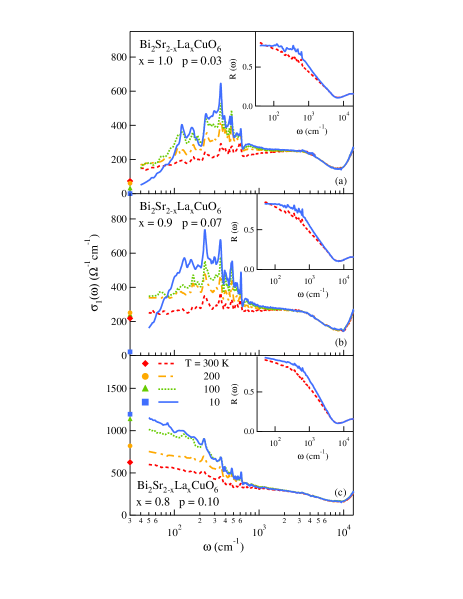
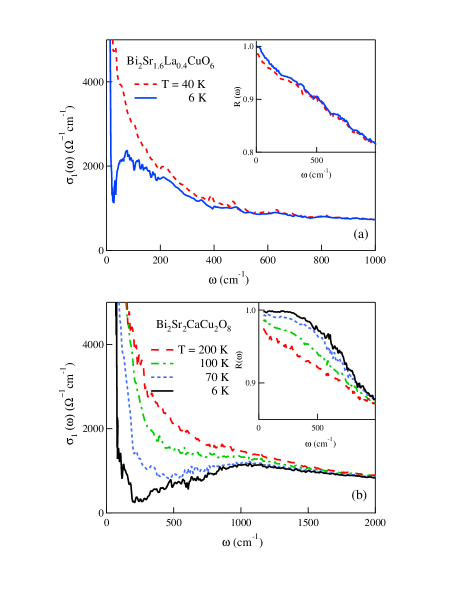
The -plane optical conductivity of three single crystals of Bi2Sr1-xLaxCuO6 with = 1.0, 0.9, and 0.8 ( = 0.03, 0.07, and 0.10, respectively) is shown in figure 4 at selected temperatures in the normal state. The corresponding reflectivity spectra are shown in the insets. The values measured on samples belonging to the same batch and at the same temperatures are also shown. Together with those of figure 3, the curves of figure 4 monitor the evolution of with and as the doped Cu-O plane approaches, and eventually overcomes, the IMT at .
.
In order to better follow that evolution, in figure 5 we show the -plane conductivity of the six crystals with the lowest non-zero doping after subtracting all phonon contributions by fits similar to those whose results are reported in table 2. The remaining contributions to , peaked at zero frequency (Drude term), and at a far-infrared (mid-infrared) frequency (), are indicated by open symbols.
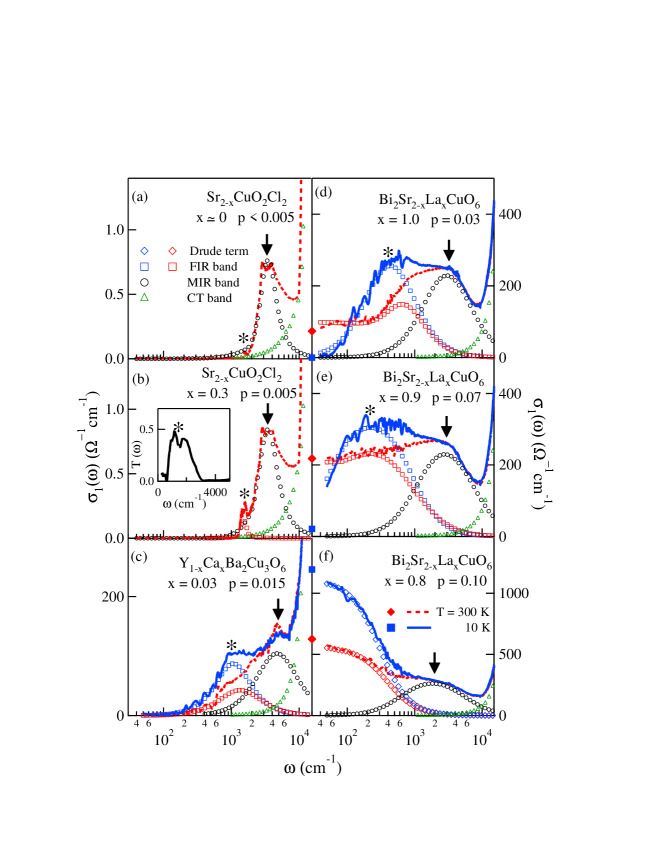
In figure 5 the effect of increasing doping on the Cu-O plane clearly appears. At (SCOC sample in (a)) mid-IR absorption can be observed, which includes a weak peak (marked by a star) at = 1570 cm-1 (195 meV) and a broad structured band which extends between 3000 and 4000 cm-1. A linear extrapolation of the absorption to zero conductivity places its edge at 2000 cm-1 (0.25 eV). A mid-IR absorption has been observed in several highly correlated materials and associated with different excitation mechanisms [18]-[21]. In the SCOC material, the mid-IR broad band was previously ascribed to a Frenkel exciton, probably of crystal-field origin, associated with strong multimagnon sidebands [23, 24]. However, as the charge density in the 0 antiferromagnetic SCOC sample is nearly zero, theoretical calculations for a single hole in the AFM Cu-O plane suggest that this band is related to the photoionization process of an isolated hole strongly interacting with the magnetic degrees of freedom (magnetic polaron) [25]. The narrow peak, instead, was assigned either to a phononic hypertone in Ref.[23] or, in Ref.[24], to an extrinsic absorbtion due to chlorine surface contamination. Here, the fine tuning of doping in our SCOC crystals allows us to track the evolution of the mid-IR absorption adding a controlled number of holes in the Cu-O plane. In particular, for the SCOC crystal with = 0.3 and = 0.005 (figure 5(b)) both the structured mid-IR band and the narrow peak increase their intensity, while mantaining the same characteristic frequencies of those for 0. This allows us to propose an alternative interpretation for both bands, namely that they have an intrinsic origin related to the added holes. Indeed, the observation that the optical conductivity in figure 5(b) is typical of semiconductors at very low doping, reasonably allows one to associate the feature at with a hole bound to the Sr vacancies. According to the usual hydrogen-like model, the ground state of the bounded hole is
| (1) |
where =109737 cm-1 is the Rydberg constant, the hole effective mass, the free electron mass, and the relative dielectric constant of the insulating cuprate. If one assumes , for = 1570 cm-1 one obtains = 8.4, a value consistent with Ref. [26]. Thanks to the SCOC samples, we can thus correct the 1000 cm-1 reported in a previous paper [27], where it was taken from the gap edge at the minimum doping then available, namely = 0.015.
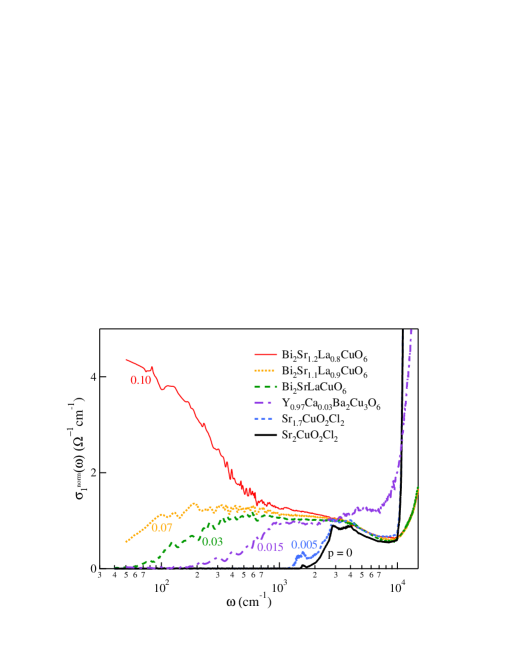
As further increases below , the weak feature detected at = 0.005 appears to turn into a broad band, whose peak at (marked by stars in figure 5) softens rapidly with doping and whose edge progressively closes the insulating gap, as better shown pictorially in figure 6. Therein, is the same of the samples in figure 5 at the lowest , but normalized for all of them to 1 cm-1 around 3000 cm-1. The MIR band at in figure 5 also softens, even if much less dramatically. Already at = 0.03, the gap survives at low temperature only, while at high it is replaced by a broad, non-Drude like absorption which may be ascribed to incoherent charge hopping. At = 0.07 the gap is closed also at the lowest , but the dc conductivity is still very small. A full metallic phase, with a Drude-like at all temperatures, is finally established at = 0.10. It is then confirmed by the present optical data that the IMT in the Cu-O plane can be placed between 0.07 and 0.10. holes per copper site. The behavior with of the gap in figure 6 is consistent with that measured by ARPES in BSLCO at the leading edge midpoint along the nodal line of the Brillouin zone [28].
As discussed in a previous paper [27], the IMT can be explained qualitatively by a Mott mechanism, which is further supported by the present observation of a hole bound state in the insulating gap at extreme dilution. We can thus make a prediction on the critical hole density . Indeed, the radius of the hole orbit is related to the experimental by
| (2) |
where is the Bohr radius. One thus obtains = 0.54 nm. The Mott condition [29] implies that the hole density per unit area at the transition
| (3) |
and the Cu density satisfies the relation
| (4) |
In SCOC = 0.39716 nm [30]. By using the result of equation 2 one obtains , a value larger by a factor of two than the experimental observed in figure 5. This should not be seen as unsatisfactory, if one considers that in a much simpler semiconductor like Si:P the difference between the observed and that predicted by the Mott criterion is much larger [31]. Here, the main reason for the disagreement may be the fact that makes unreliable the approximation of the Cu-O plane as an uniform dielectric.
The broad contributions peaked at and in figure 5 have been observed in a number of cuprates at low doping [2],[32]-[34] and their origin has been long discussed in the literature. For the FIR band, a possible explanation is disorder. In cuprates added with Zn impurities or irradiated by high-energy particles, the metallic phase can be destroyed and the Drude spectral weight strongly reduced, due to a poor screening of the impurities and to the resulting fluctuating potentials in the Cu-O planes [35]. Recent calculations [36] show that such disorder effects are amplified in a -wave electronic symmetry and that, for increasing impurity content, the Drude term turns into a FIR peak at a finite frequency. However, in the present experiment the gap is monotonically closed, and the metal approached, both by adding (in SCOC and YCBCO) and by subtracting impurities (in BSLCO). Therefore, the parameter which governs the metal-to-insulator transition is rather than . The above scenario is also consistent with recent calculations of the optical conductivity in hole-doped cuprates. They are based on a --Holstein approach, where the FIR band has a dominant electron-phonon character (lattice polaron), while the MIR band is attributed mainly to the electron-spin interaction (spin polaron) [25]. This polaronic scenario seems to be also consistent with other experimental observations. Indeed, in BSLCO the FIR peak behaves with like the FIR band of electron-doped NCCO vs the electron concentration [37]. This absorption was attributed to large polarons [33], and its softening was explained in terms of polaron-polaron interactions which increase with [38, 39]. At room temperature, where , incoherent polaron hopping takes place: this may explain the flat background observed in figures 5(d) and 5(e) and the resulting, nonvanishing at .
4 The metallic phase
4.1 The optical conductivity
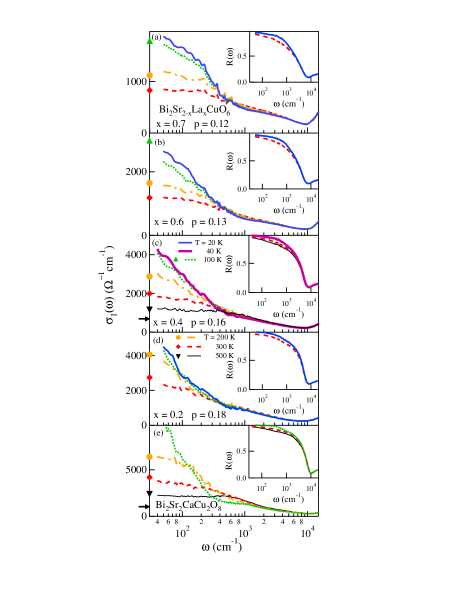
Figure 7 shows the -plane reflectivity and the optical conductivity of four metallic BSLCO samples in the normal phase, from the underdoped to the overdoped regime, and those of the optimally doped BSCCO crystal for comparison. The in all the insets has a minimum at 8000 cm-1, which is usually assumed to approximately separate the intraband absorption from the interband absorption.
As usually done in cuprates, the optical conductivity of Fig. 7 can be analyzed in two different ways. In the two-component model, the former oscillator is a standard Drude peak centered at , which increases in intensity with and broadens as increases. The second component is a mid-IR band peaked at and described in terms of a Lorentzian shape, like in the less doped crystals in figure 5. Indeed, that band survives at as shown clearly in figure 6, where the of the underdoped crystal with = 0.8 and = 0.10 is shown after phonon subtraction. Here, a clear change of slope is found above 1000 cm-1 and the two-component fit provides 1800 cm-1. As the Drude intensity increases with doping, for 0.10 the MIR band is no more resolved. However, an additional oscillator in the mid infrared is required by all Drude-Lorentz fits to the spectra in figure 7. The MIR band continues to shift remarkably toward lower energies as increases, as shown in figure 8. At any doping the MIR band is instead nearly insensitive to temperature between 10 and 300 K.
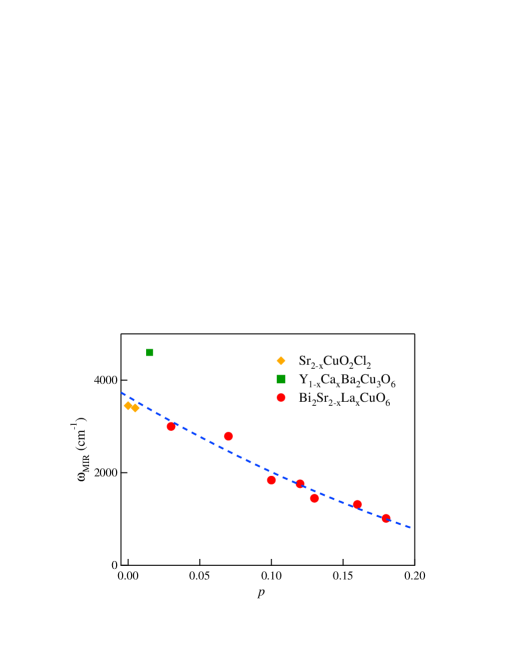
The fact that a band interpreted in terms of magnetic polarons [25] survives in the metallic phase of a cuprate family is not unexpected. Indeed, the existence of local antiferromagnetic fluctuations has been reported for example in YBCO [4], and spin-density waves are known to exist in superconducting pnictides [34]. The data of figure 8 are particularly interesting if one considers the possible role of magnetic excitations in the pairing mechanism. For example, according to the resonant-valence-bond (RVB) theory [40] the pairing is intimately related to superexchange interaction of energy , where is the effective hopping matrix element and is the Hubbard on-site repulsion. Other approaches to high- superconductivity based on the model also involve the scale of energy [41]: it would be interesting to investigate theoretically, in those frameworks, the softening of with .
An alternative picture for the metallic optical conductivity of cuprates is the one-component extended Drude model. Here one describes the complex in the whole infrared range by a single contribution peaked at = 0, weighted by the unscreened plasma frequency but with an optical scattering rate and an effective mass which are both dependent on frequency:
| (5) |
Therefore, in terms of the complex dielectric function, one has [42]
| (6) |
and
| (7) |
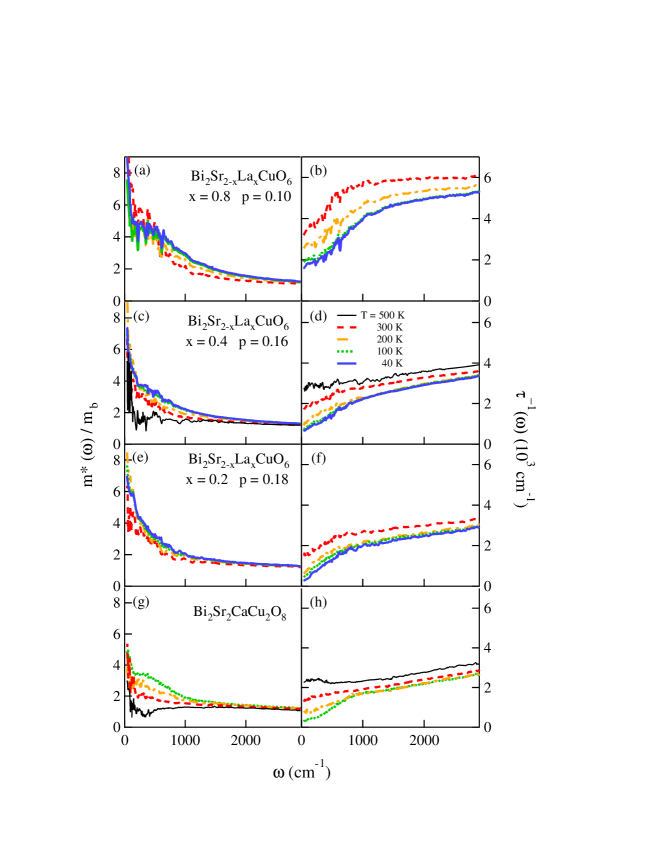
Here the unscreened plasma frequency was extracted from the in figure 7 via Lorentzian fits to the intraband (Drude+MIR) and interband absorptions. This allows one to subtract the interband contribution and then estimate the intraband spectral weight . Indeed, in the units here employed, [43]. We found out 11000, 14000, 14500, and 17500 cm-1 for BSLCO with = 0.8, 0.4, 0.2, and BSCCO, respectively. An example of fit is shown in figure 9 for BSLCO with = 0.4. Moreover, was obtained by subtracting the intraband contribution to , recalculating the remaining , and extrapolating the result to zero frequency. We obtained 4.5 (independent of the material), a standard value for the cuprates [44]. The final results for (left panels) and (right panels) are shown in figure 10 for underdoped (a,b), optimally doped (c,d), and overdoped (e,f) BSLCO crystals, as well as for the optimally-doped BSCCO crystal (g,h). One sees that approaches the band mass at high energy, while in the far infrared it reaches values . Moreover, is just slightly affected by the change in the hole content, consistently with previous observations on LSCO [45].
The optical scattering rate in the right panels of figure 10 exceeds the frequency . As already reported for other cuprates [1, 2], this violates the basic assumption of the Fermi-liquid theory , which is demanded for the coherence of quasiparticles. The overall magnitude of the scattering rate is remarkably enhanced over the whole frequency range in the material. The change of slope at cm-1, particularly evident at , which in the two component model identifies the MIR band, in the extended Drude approach indicates the opening of a pseudogap [1] in the density of states, which does not appear directly in the .
4.2 The spectral weight
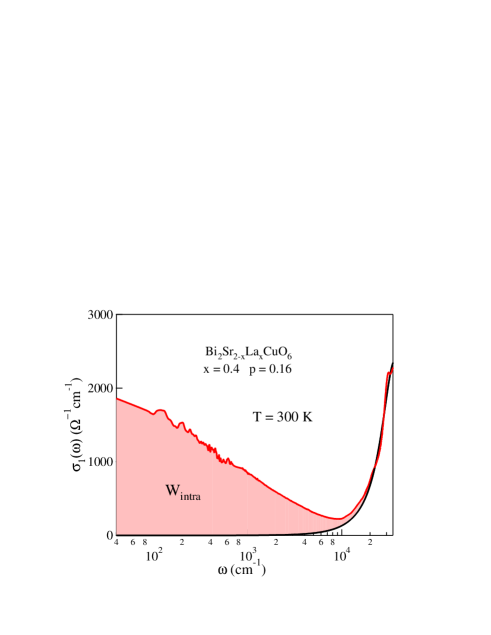
In the literature of metallic cuprates, the -plane has been modeled either by the extended Drude approach or by the multi-component picture described in the preceding sections. However, information on their peculiar electrodynamics and especially on the role played by the correlation effects can be also provided by a model-independent quantity, the optical spectral weight
| (8) |
For , according to the ordinary sum rule, is independent of . Therein, , , and are the carrier density, charge, and band mass, respectively. If instead is set close to the minimum in the reflectivity, which provides a rough estimate of the screened plasma frequency 8000 cm-1, one obtains a sum rule restricted to the majority of the carriers in the conduction band [46].
The interest in the optical spectral weight is mostly due to its relation with the kinetic energy [47]. Indeed [46]:
| (9) |
where the sum is performed over momenta of the first Brillouin zone, is the dispersion, the occupation number for a given state with spin , and the unit-cell volume. The last relation in equation 9, where is the average kinetic energy and is the dimensionality of the system, only holds for a nearest-neighbor, tight-binding, single-band model. Therefore, using the Sommerfeld expansion of the Fermi distribution function [48] at the first order, one obtains for single-band tight-binding metals
| (10) |
This equation is verified in gold [49], whose conduction band is indeed described by a one-band (the band) tight-binding approximation [50]. As , it is related to the hopping rate by the general bandwidth relation . Furthermore, the ”thermal” coefficient is crucially related to the density of states at the Fermi energy , which depends on and on the details of the band structure, but in general it will be inversely proportional to the bandwidth, and hence to . We thus have, for a conventional tight-binding metal like gold, and .
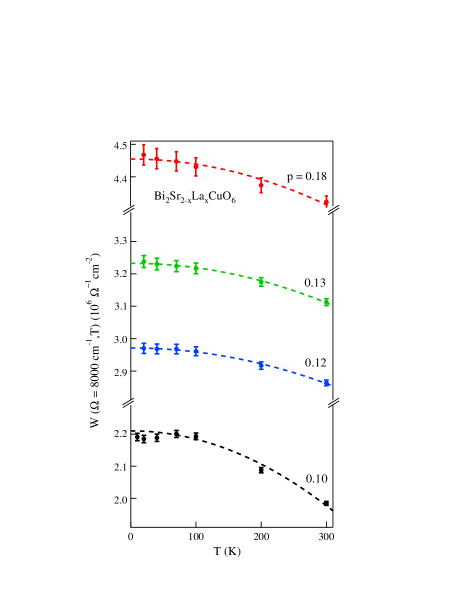
In cuprates, the behavior in equation 10 has been confirmed in BSCCO for [51, 52] and in LSCO for a wide frequency and doping range [49]. For the present BSLCO crystals, the behavior of is displayed in figure 11. It follows the dependence between K and the minimum , over the whole metallic side of its phase diagram, except the underdoped material with below 70 K, due probably to the weak low- divergence of the in-plane resistivity reported in figure 2. The error bars in figure 11 have been calculated by assuming an experimental uncertainty of 1% on the overall level of the measured . Moreover, in a given sample, both the dependence of and the value of are the same within errors between and .
| Metal | |||
|---|---|---|---|
| ( K-2) | ( cm) | (cm-1) | |
| Correlated | |||
| Bi2Sr1.8La0.2CuO6 | 35 | 0.37 | 8000 |
| Bi2Sr1.6La0.4CuO6 | 40 | 0.50 | 8000 |
| Bi2Sr1.4La0.6CuO6 | 41 | 0.85 | 8000 |
| Bi2Sr1.3La0.7CuO6 | 41 | 1.2 | 8000 |
| Bi2Sr1.2La0.8CuO6 | 117 | 1.6 | 8000 |
| La1.88Sr0.12CuO4 [49] | 35 | 0.50 | 6800 |
| La1.74Sr0.26CuO4 [49] | 25 | 0.17 | 6800 |
| Bi2Sr2CaCu2O8 | 20 | 0.24 | 10000 |
| V2O3 [53, 54] | 160 | 0.37 | 8000 |
| Uncorrelated | |||
| CaAlSi [16] | 5.0 | 0.14 | 8000 |
| Au [49] | 1.3 | 0.03 | 20500 |
The frequency-dependent thermal response can be evaluated at any from fits like those in figure 11. The resulting values are reported in table 3 in terms of normalized coefficients . Therein, they are compared with those evaluated for other cuprates, for the Mott-Hubbard model system V2O3 and for two uncorrelated metals. As one can see, in BSLCO is comparable with that of the other cuprate families (except in the strongly underdoped material), while it is larger by roughly one order of magnitude than that of uncorrelated metals . The of V2O3 is even larger, in average, than that of cuprates. Table 3 also indicates that high values of , corresponding to a strong -dependence of , are poorly related to the resistivity of the metal and are not related at all to its plasma frequency. These results are not surprising in view of the strong correlation effects in the latter compounds. Indeed, the motion of a hole can in principle result in a double electron occupancy on Cu sites, which costs the Hubbard energy . The modification with of the filling of the Hubbard bands produces changes in up to an energy and this explains why for . This relation has been quantitatively supported by Dynamical Mean Field (DMFT) calculations for LSCO, which predict the correct values of ) only if one takes into account the effect of electronic correlations [55]. The thermal response , or ), therefore probes experimentally the correlation effects at finite and out of half-filling.
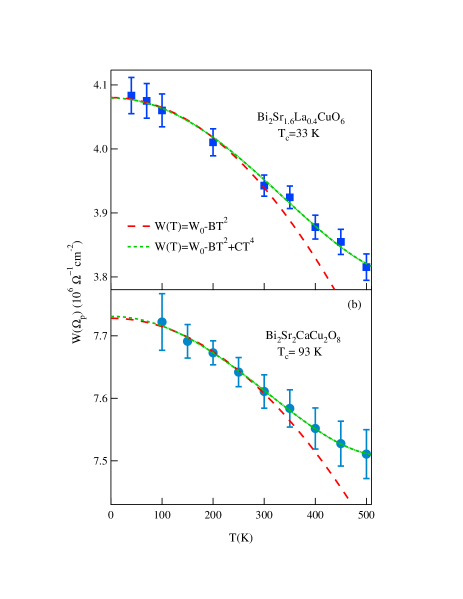
In order to verify both the accuracy of the Sommerfeld expansion and the effect of correlations at higher temperatures, we have extended the measurements on both the crystals at optimum doping (BSLCO with = 0.4 and BSCCO) up to 500 K (see figure 7). The resulting spectral weight , calculated at the plasma edge ( cm-1 in BSLCO and cm-1 in BSCCO) is shown in figure 12.
Therein, the dependence predicted by equation (10) well fits the measured only for K, while a clear deviation appears above room temperature for both samples. One may wonder whether this is due to the system approaching the I-R limit, where the quasiparticle picture breaks down due to the electron mean free path becoming comparable with the lattice constant [56]. However, the calculated [57] (marked by arrows in figure 7) shows that, even at 500 K, in both systems for is far from the Ioffe-Regel limit.
On the contrary, the deviation of from the behavior is satisfactorily reproduced at all temperatures if one includes the term of the Sommerfeld expansion (dotted lines in figure 12), namely if is fitted to
| (11) |
We obtained K-2 in BSLCO and K-2 in BSCCO. Therefore, () K-4 and (() K-2 for BSLCO (BSCCO). In order to check the generality of such behavior, the cutoff frequency in equation 8 was varied from to , and deviations from the dependence quite similar to those in figure 12 were always found. DMFT calculations [57] show that either the absolute values of the above coefficients and the behavior are influenced by strong correlations, which then produce major effects also at high temperature.
5 The superconducting phase
5.1 The optical conductivity
We have also studied (down to 10 cm-1), both optimally-doped samples (Bi2Sr1.6La0.4CuO6 and BSCCO) below their (33 and 93 K, respectively). The data of BSCCO are similar to those reported previously for the same material [43, 58]. The low-frequency and of both compounds are displayed in figure 13, above and below . In both panels, below , exhibits the partial opening of a gap and residual Drude conductivity below 20 cm-1 in BSLCO and 100 cm-1 in BSCCO. A similar behavior is usually observed in -wave superconductors and can be attributed to the infrared average of the anisotropic density of states in the momentum space. The residual Drude may then come from the ungapped zones of the Fermi surface.
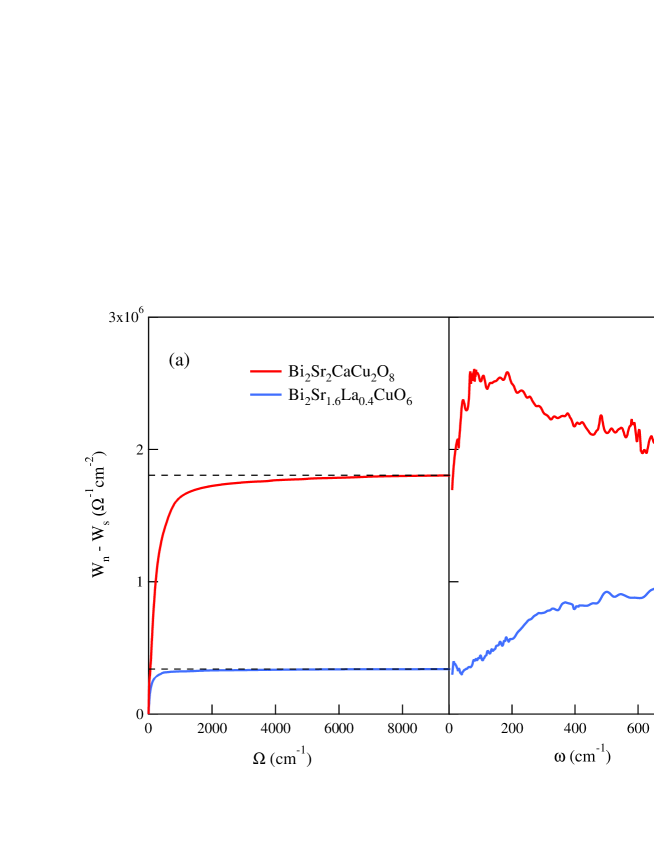
Basing on the Ferrel-Glover-Tinkham sum rule (FGT) one usually obtains the spectral weight of the function which condenses at , namely the superfluid density, through
| (12) |
with . is calculated at the lowest (i.e., 40 K) and is obtained at K, well below in both materials. The result is plotted vs. in figure 14(a). An alternative estimate of is given by the imaginary part of the complex conductivity through the London equation for the electrodynamics of superconductors, which gives
| (13) |
| Bi-2212 | BSLCO | LSCO | |
|---|---|---|---|
| (K) | 93 | 33 | 41 |
| (nm) | 137 | 291 | 215 |
| (nm) | 169 | 297 | 246 |
In figure 14-b this limit, divided by 8, coincides [51, 52] with the difference provided that is integrated in Eq. 12 up to cm-1 in BSLCO and cm-1 in BSCCO. Therefore, as already reported for other hole-doped superconducting cuprates [49, 51], the energy range involved in the FGT sum rule is much larger than the Bardeen-Cooper-Schrieffer (BCS) prediction (4) where is the superconducting gap in the dirty (clean) limit. In optimally doped BSLCO, cm-1, while in BSCCO cm-1 [59]. One may notice that in figure 14 should be fairly constant for any in the region of the superconducting gap. Its frequency dependence in the far IR is due the presence of a residual Drude-like absorption in figure 13.
From one can also extract the London penetration depth
| (14) |
The values thus obtained for BSLCO and BSCCO are reported in Table 4, where of optimally-doped LSCO from Ref. [49] is also shown for comparison. As one can see, they are found in good agreement with recent [61, 60] measurements of , extrapolated to , by muon spin spectroscopy. Table 4 also shows the strong increase in the London penetration depth as decreases from 93 K to 33 K.
6 Concluding remarks
In the present work we have measured the -plane reflectivity of single crystals belonging to three different one-layer cuprate families. This allowed us to analyze the infrared response of the doped Cu-O plane throughout its phase diagram, from 0 to = 0.18, and for varying from 6 to 500 K. In the insulating phase we have measured the low-temperature phonon spectrum of SCOC, YCBCO, and BSLCO, which has been compared with previous observations at room temperature. At extreme hole dilution ( 0 and = 0.005), a narrow peak at 1570 cm-1 (195 meV) was observed for the first time in a cuprate, which increases in intensity with doping. It was assigned to the ground state of a hole bound to a Sr defect. By using that energy value and a simple Mott-transition model, we could predict a critical value for at the insulator-to-metal transition which differs by a factor of 2 from that really observed in another compound, BSLCO. Considering that in simpler semiconductors the disagreement between the Mott criterion and the observations is generally much larger, we consider this result as a confirmation that the IMT in cuprates is driven by a conventional transformation of isolated-impurity levels into a conduction band at a critical . This is indeed what we have observed by monitoring the optical conductivity at low temperature for increasing doping. The level at 195 meV broadens into a FIR band whose low-energy edge forms an insulating gap which closes as either or increase. In the latter case however, in the far infrared instead of the true Drude peak a flat band appears, which is suggestive of thermally-activated incoherent hopping. The IMT occurs at low only when the FIR band turns into a Drude term, which continues to develop when doping further increases. During the whole process, a mid-infrared band well distinguished from the Drude absorption also softens, from 3000 cm-1 at 0 to about 1000 cm-1 at . However, it does not seem to participate actively to the IMT, and the fact that it originates in the AF phase may imply that it is magnetic in nature, as proposed for similar infrared bands by recent theoretical models.
In the metallic phase, an analysis of the optical conductivity alternative to the MIR+Drude model has been performed in terms of the extended-Drude approach. The presence of a pseudogap may be assumed for the strongly underdoped compound only, where however the clear separation between the Drude and MIR contributions makes the model unreliable. We have then analyzed in detail a model-independent quantity, the infrared spectral weight . Below 300 K this depends on temperature like , as predicted by the Sommerfeld expansion of the carrier kinetic energy truncated at the first order, and as already observed in LSCO and other cuprates. Like in LSCO, in BSLCO there are however two independent scales, which differ in energy by approximately one order of magnitude, that of and that of the -coefficient . Moreover, this remains nearly constant with frequency well above the shielded plasma frequency. DMFT calculations showed that these effects are related to the strong correlations present in the Cu-O plane. An interesting effect comes out when extending the study of to temperatures higher than 300 K. In both the superconductors examined, the single-layer BSLCO and the bilayer BSCCO, is still well described by the Sommerfeld expansion, provided however that the term is included.
In the superconducting phase BSLCO behaves similarly to BSCCO, once the gap energy, the width of the residual Drude peak below , and the superconducting carrier density are scaled down in consideration of its lower critical temperature. As previously reported for other cuprates, also in BSLCO the FGT sum rule is fulfilled only if the integration of the conductivity is extended to frequencies much beyond the BCS limit of 6.
Acknowledgments
We are indebted to A. Erb for providing the YCBCO sample and to L. Baldassarre for measuring its infrared spectra. We acknowledge the Helmholtz-Zentrum Berlin - Electron storage ring BESSY II for provision of synchrotron radiation at beamline IRIS. The research leading to these results has received funding from the European Community’s Seventh Framework Programme (FP7/2007-2013) under grant agreement n.226716.
References
References
- [1] Timusk T and Statt B 1999 The pseudogap in high-temperature superconductors: an experimental survey Rep. Prog. Phys.62 61.
- [2] Basov D N and Timusk T 2005 Electrodynamics of high- superconductors Rev. Mod. Phys. 77 721.
- [3] Lucarelli A Lupi S Ortolani M Calvani P Maselli P Capizzi M Giura P Eisaki H Kikugawa N Fujita T Fujita M and Yamada K 2003 Phase Diagram of La2-xSrxCuO4 Probed in the Infrared: imprints of Charge Stripe Excitations Phys. Rev. Lett. 90 037002.
- [4] Lee Y S Segawa K Li Z Q Padilla W J Dumm M Dordevic S V Homes C C Ando Y and Basov D N 2005 Electrodynamics of the nodal metal state in weakly doped high-Tc cuprates Phys. Rev. B 72 054529.
- [5] van Heumen E Meevasana W Kuzmenko A B Eisaki H van der Marel D 2009 Doping-dependent optical properties of Bi2201 New J. Phys. 11 055067.
- [6] Ando Y and Murayama T 1999 Nonuniversal power law of the Hall scattering rate in a single-layer cuprate Bi2Sr2-xLaxCuO6 Phys. Rev. B 60 R6991.
- [7] Ono S and Ando Y 2003 Evolution of the resistivity anisotropy in Bi2Sr2-xLaxCuO6+δ single crystals for a wide range of hole doping Phys. Rev. B 67 104512.
- [8] Lübben O Dudy L Krapf A Janowitz C and Manzke R 2010 Structural behavior of PbyyBi1.95-ySr1.49La0.4Cu1.15O6+δ for 0y0.53 Phys. Rev. B 81 174112.
- [9] Quijada M A Tanner D B Kelley R J Onellion M Berger H and Margaritondo G 1999 Anisotropy in the ab-plane optical properties of Bi2Sr2CaCu2O8 single-domain crystals Phys. Rev. B 60 14917.
- [10] Jánossy A Fehér T and Erb A 2003 Diagonal antiferromagnetic easy axis in lightly hole doped Y1-xCaxBa2Cu3O6 Phys. Rev. Lett. 91 177001.
- [11] Ando Y Hanaki Y Ono S Murayama T Segawa K Miyamoto N and Komiya S 2000 Carrier concentrations in Bi2Sr2-zLazCuO6+δ single crystals and their relation to the Hall coefficient and thermopower Phys. Rev. B 61 R14956; ibidem 2001 63 069902(E).
- [12] Ono S Ando Y Murayama T Balakirev F F Betts J B and Boebinger G S 2000 Metal-to-Insulator crossover in the low-temperature normal state of Bi2Sr2-xLaxCuO6+δ Phys. Rev. Lett. 85 638.
- [13] A. Jánossy, private communication.
- [14] Ando Y 2008 Implication of the Mott-limit violation in high-Tc cuprates J. Phys. Chem. Solids 69 3195.
- [15] Abo-Bakr M Feikes J Holldack K Kuske P Peatman W B Schade U üstefeld G W and Hübers H W 2003 Brilliant, coherent far-Infrared (THz) Synchrotron Radiation Phys. Rev. Lett. 90 094801.
- [16] Lupi S Baldassarre L Ortolani M Mirri C Schade U Sopracase R Tamegai T Fittipaldi R Vecchione A and Calvani P 2008 Subterahertz electrodynamics of the graphenelike superconductor CaAlSi Phys. Rev. B 77 054510.
- [17] Terasaki I Tajima S Eisaki H Takagi H Uchinokura K and Uchida S 1990 Optical reflectivity spectra of single-crystal Bi2Sr2Can-1CunO2n+4+x (n=1 and 2) Phys. Rev. B 41 865.
- [18] Paolone A Giura P Calvani P Dore P Lupi S and Maselli P 1998 Charge-localization effects in the infrared transmittance of layered perovskites Physica B 244 33.
- [19] Perucchi A Marini C Valentini M Postorino P Sopracase R Dore P Hansmann P Jepsen O Sangiovanni G Toschi A Held K Topwal D Sarma D D and Lupi S 2009 Pressure and alloying effects on the metal to insulator transition in NiS2-xSex studied by infrared spectroscopy Phys. Rev. B 80 073101.
- [20] Congeduti A Postorino P Dore P Nucara A Lupi S Mercone S Calvani P Kumar A and Sarma D D 2001 Infrared study of charge delocalization induced by pressure in the La0.75Ca0.25MnO3 manganite Phys. Rev. B 63 184410.
- [21] Basov D N Averitt R D van der Marel D Dressel M and Haule K 2011 Electrodynamics of correlated electron materials Rev. Mod. Phys. 83 471.
- [22] Tajima S Ido T Ishibashi S Itoh T Eisaki H Mizuo Y Arima T Takagi H and Uchida S 1991 Optical-phonon study of single crystals of various layered cuprates and related materials: Evidence of unique electron-phonon coupling in the CuO2 plane Phys. Rev. B 43 10496.
- [23] Perkins J D Graybeal J M Kastner M A Birgeneau R J Falck J P and Greven M 1993 Mid-infrared optical absorption in undoped lamellar copper oxides Phys. Rev. Lett. 71 1621.
- [24] Zibold A Liu H L Moore S W Graybeal J M and Tanner D B 1996 Optical properties of single-crystal Sr2CuO2Cl2 Phys. Rev. B 53 11734.
- [25] Mishchenko A S Nagaosa N Shen Z X De Filippis G Cataudella V Devereaux T P Bernhard C Kim K W and Zaanen J 2008 Charge dynamics of doped holes in High Tc Cuprate Superconductors: a clue from optical conductivity Phys. Rev. Lett. 100 166401.
- [26] Markiewicz R S Hasan M Z and Bansil A 2008 Acoustic plasmons and doping evolution of Mott physics in resonant inelastic x-ray scattering from cuprate superconductors Phys. Rev. B 77 094518.
- [27] Lupi S Nicoletti D Limaj O Baldassarre L Ortolani M Ono S Ando Y and Calvani P 2009 Far-Infrared absorption and the Metal-to-Insulator Transition in hole-doped cuprates Phys. Rev. Lett. 102 206409.
- [28] Shen K M Yoshida T Lu D H Ronning F Armitage N P Lee W S Zhou X J Damascelli A Feng D L Ingle N J C Eisaki H Kohsaka Y Takagi H Kakeshita T Uchida S Mang P K Greven M Onose Y Taguchi Y Tokura Y Komiya S Ando Y Azuma M Takano M Fujimori A and Shen Z X 2004 Fully gapped single-particle excitations in lightly doped cuprates Phys. Rev. B 69 054503.
- [29] The three dimensional Mott criterion can be extended to a charge moving in the Cu-O plane with small corrections, as shown by Kastner et al., [1998 Fully gapped single-particle excitations in lightly doped cuprates Rev. Mod. Phys. 70 897]. In the present general approach, we adopted the simple geometrical factor instead of the usual, phenomenological valuer 0.25.
- [30] Miller L L Wang X L Wang S X Stassis C Johnson D C Faber J Jr. and Long C K 1990 Synthesis, structure, and properties of Sr2CuO2Cl2 Phys. Rev. B 41 1921.
- [31] Kittel C 1996 Introduction to Solid State Physics 7th ed. (New York: John Wiley and Sons) p 285.
- [32] Calvani P Capizzi M Lupi S Maselli P Paolone A and Roy P 1996 Polaronic optical absorption in electron-doped and hole-doped cuprates Phys. Rev. B 53 2756.
- [33] Calvani P 2001 Optical properties of polarons Riv. Nuovo Cim. Soc. Ital. di Fisica 8 1-72.
- [34] Tropeano M Fanciulli C Ferdeghini C Marre’ D Siri A S Putti M Martinelli A Ferretti M Palenzona A Cimberle M R Mirri C Lupi S Sopracase R Calvani P Perucchi A 2009 Transport and infrared properties of SmFeAs(O1-xFx): from SDW to superconducting ordering Supercond. Sci. Technol. 22 034004.
- [35] Basov D N Dabrowski B and Timusk T 1998 Infrared Probe of Transition from Superconductor to Nonmetal in YBa2(Cu1-xZnx)4O8 Phys. Rev. Lett. 81, 2132; Basov D N Puchkov A V Hughes R A Strach T Preston J Timusk T Bonn D A Liang R and Hardy W A 1994 Disorder and superconducting-state conductivity of single crystals of YBa2Cu3O6.95 Phys. Rev. B 49 12165.
- [36] Atkinson W A and Hirschfeld P J 2002 Optical and thermal-transport properties of an inhomogeneous d-wave superconductor Phys. Rev. Lett. 88 187003.
- [37] Lupi S Maselli P Capizzi M Calvani P Giura P and Roy P 1999 Evolution of a polaron band through the phase diagram of Nd2-xCexCuO4-y Phys. Rev. Lett. 83 4852.
- [38] Tempere J and Devreese J T 2001 Optical absorption of an interacting many-polaron gas Phys. Rev. B 64 104504; Tempere J and Devreese J T 2001 Sum rule for the optical absorption of an interacting many-polaron gas Europ. Phys. Jour. B 20 27.
- [39] Lorenzana J 2001 Instability due to long-range Coulomb interaction in a liquid of Feynman polarons Europhys. Lett. 53 532.
- [40] Anderson P W 1987 The Resonating Valence Bond State in La2CuO4 and superconductivity Science 235 1196.
- [41] Maier T A Poilblanc D and Scalapino D J 2008 Dynamics of the pairing interaction in the Hubbard and t-J models of High-Temperature Superconductors Phys. Rev. Lett. 100 237001, and references therein.
- [42] van Heumen E Lortz R Kuzmenko F Carbone A B van der Marel D Zao X Yu G Cho Y Barisic N Greven M Homes C C and Dordevic S W 2007 Optical and thermodynamic properties of the high-temperature superconductor HgBa2CuO4+δ Phys. Rev. B 75 054522.
- [43] Hwang J Timusk T and Gu G D 2007 Doping dependent optical properties of Bi2Sr2CaCu2O8+δ Journ. Phys.: Cond. Matt. 19 125208.
- [44] van der Marel D Molegraaf H J A Zaanen J Nussinov Z Carbone F Damascelli A Eisaki H Greven M Kes P H and Li M 2003 Quantum critical behaviour in a high-Tc superconductor Nature 425 271.
- [45] Padilla W J Lee Y S Dumm M Blumberg G Ono S Segawa K Komiya S Ando Y and Basov D N 2005 Constant effective mass across the phase diagram of high-Tc cuprates Phys. Rev. B 72 060511(R).
- [46] Benfatto L Sharapov S G Andrenacci N and Beck H 2005 Ward identity and optical conductivity sum rule in the d-density wave state Phys. Rev. B 71 104511.
- [47] Hirsch J E 2002 The true colors of Cuprates Science 295 2226; Norman M R and Pepin C 2002 Quasiparticle formation and optical sum rule violation in cuprate superconductors Phys. Rev. B 66 100506(R).
- [48] Boris A V Kovaleva N N Dolgov O V Holden T Lin C T Keimer B and Bernhard C 2004 In-plane spectral weight shift of charge carriers in YBa2Cu3O6.9 Science 304 708.
- [49] Ortolani M Calvani P and Lupi S 2005 Frequency-dependent thermal response of the charge system and the restricted sum rules of La2-x Srx CuO4 Phys. Rev. Lett. 94 067002.
- [50] Ashcroft N W and Mermin N D 1976 Solid State Physics (Philadelphia: W. B. Saunders Co.).
- [51] Molegraaf H J A Presura C Van der Marel D Kes P H and Li M 2002 Superconductivity-induced transfer of in-plane spectral weight in Bi2Sr2CaCu2O8+δ Science 295 2239.
- [52] Santander-Syro A F Lobo R P S M Bontemps N Konstantinovic Z Li Z Z and Raffy H 2003 Pairing in cuprates from high-energy electronic states Europhys. Lett. 62 568; Santander-Syro A F Lobo R P S M Bontemps N Konstantinovic Z Li Z Z and Raffy H 2002 Absence of a loss of in-plane infrared spectral weight in the pseudogap regime of Bi2Sr2CaCu2O8+δ Phys. Rev. Lett. 88 097005.
- [53] Baldassarre L Perucchi A Nicoletti D Toschi A Sangiovanni G Held K Capone M Ortolani M Malavasi L Marsi M Metcalf P Postorino P and Lupi S 2008 Quasiparticle evolution and pseudogap formation in V2O3: an infrared spectroscopy study Phys. Rev. B 77 113107.
- [54] Perucchi A Baldassarre L and Lupi S 2009 Optical properties across the insulator to metal transitions in vanadium oxide compounds TOPICAL REVIEW: Journal of Physics Condensed Matter 21 323202.
- [55] Toschi A Capone M Ortolani M Calvani P Lupi S and Castellani C 2005 Temperature dependence of the optical spectral weight in the cuprates: role of electron correlations Phys. Rev. Lett. 95 097002.
- [56] Gunnarsson O Calandra M and Han J E 2003 Colloquium: Saturation of electrical resistivity Rev. Mod. Phys 75 1085.
- [57] Nicoletti D Limaj O Calvani P Rohringer G Toschi A Sangiovanni G Capone M Held K Ono S Ando Y and Lupi S 2010 High-temperature optical spectral weight and Fermi-liquid renormalization in Bi-based cuprate superconductors Phys. Rev. Lett. 105 077002.
- [58] Carbone F Kuzmenko A B Molegraaf H J A van Heumen E Lukovac V Marsiglio F van der Marel D Haule K Kotliar G Berger H Courjault S Kes P H and Li M 2006 Doping dependence of the redistribution of optical spectral weight in Bi2Sr2CaCu2O8+δ Phys. Rev. B 74 064510.
- [59] Yurgens A Winkler D Claeson T Ono S and Ando Y 2003 Intrinsic tunneling spectra of Bi2(Sr2-xLax)CuO6+δ Phys. Rev. Lett. 90 147005.
- [60] Russo P L Wiebe C R Uemura Y J Savici A T MacDougall G J Rodriguez J Luke G M Kaneko N Eisaki H Greven M Vajk O P Ono S Ando Y Fujita K Kojima K M and Uchida S 2007 Muon spin relaxation study of superconducting Bi2Sr2-xLaxCuO6+δ Phys. Rev. B 75 054511.
- [61] Kadono R Higemoto W Koda A Larkin M I Luke G M Savici A T Uemura Y J Kojima K M Okamoto T Kakeshita T Uchida S Ito T Oka K Takigawa M Ichioka M and Machida K 2004 Expansion of vortex cores by strong electronic correlation in La2-xSrxCuO4 at low magnetic induction Phys. Rev. B 69 104523.
- [62] Farnworth B and Timusk T 1974 Far-infrared measurements of the phonon density of states of superconducting lead Phys. Rev. B 10 2799.
- [63] Marsiglio F Startseva T and Carbotte J P 1998 Inversion of K3C60 reflectance data Phys. Lett. A 245 172.
- [64] Tu J J Homes C C Gu G D Basov D N and Strongin M 2002 Optical studies of charge dynamics in optimally doped Bi2Sr2CaCu2O8+δ Phys. Rev. B 66 144514.
- [65] Hwang J Timusk T Schachinger E and Carbotte J P 2007 Evolution of the bosonic spectral density of the high-temperature superconductor Bi2Sr2CaCu2O8+δ Phys. Rev. B 75 144508.
- [66] van Heumen E Muhlethaler E Kuzmenko A B Eisaki H Meevasana W Greven M and van der Marel D 2009 Optical determination of the relation between the electron-boson coupling function and the critical temperature in high-Tc cuprates Phys. Rev. B 79 184512.
- [67] Yang J Hwang J Schachinger E Carbotte J P Lobo R S P M Colson D Forget A and Timusk T 2009 Exchange boson dynamics in cuprates: optical conductivity of Ba2CuO4+δ Phys. Rev. Lett. 102 027003.