Phonon Dynamics and Multipolar Isomorphic Transition in -pyrochlore KOs2O6
Abstract
We investigate with a microscopic model anharmonic K-cation oscillation observed by neutron experiments in -pyrochlore superconductor KOs2O6, which also shows a mysterious first-order structural transition at =7.5 K. We have identified a set of microscopic model parameters that successfully reproduce the observed temperature dependence and the superconducting transition temperature. Considering changes in the parameters at , we can explain puzzling experimental results about electron-phonon coupling and neutron data. Our analysis demonstrates that the first-order transition is multipolar transition driven by the octupolar component of K-cation oscillations. The octupole moment does not change the symmetry and is characteristic to noncentrosymmetric K-cation potential.
The -pyrochlore oxides Os2O6(=K, Rb, or Cs) are one of the material families that have unique cage-like structure, and -cation inclusions exhibit large anharmonic local oscillations[1, 2, 3, 4, 5, 6, 7, 8, 9]. Such anharmonic and large-amplitude oscillations strongly interact with conduction electrons, which leads to strong coupling superconductivity[10, 11, 12], anomalous temperature dependence of electric resistivity[4, 13] and nuclear relaxation time[14, 5]. To explain such interesting properties is a big challenge for the theory of electron-phonon systems and strong coupling theory of superconductivity[15].
As the -cation size decreases, amplitude of the -cation oscillation increases, and thus potassium oscillations are the most anharmonic[16]. Elastic neutron scattering data show that the temperature dependence curve of oscillation amplitude is concave (convex upwards) in KOs2O6, reflecting strong anharmonicity[17, 18]. A recent inelastic neutron scattering experiment revealed that the phonon peaks shift to lower energy with decreasing temperature and the peak positions are at around 3-7 meV at the lowest temperature[19]. This softening is the strongest in K-, and the weakest in Cs-compound. Superconducting transition takes places in all the three, and the transition temperature is 9.6, 6.3 and 3.3 K for =K, Rb and Cs, respectively[4, 9]. The symmetry of the superconducting gap function is confirmed to be s-wave[6, 7].
KOs2O6, the most anharmonic one, not only has the highest of superconductivity, but also exhibits another singularity, a first-order structural transition at K[2]. It is interesting that no sign of symmetry breaking has been observed[8, 20, 21]. Below , the temperature dependence of electric resistivity changes to from at higher temperatures[4], and the absolute value decreases by about 25 % at . Both of these results show that electron-phonon scatterings are suppressed below [3], which is also supported by the reduction in the specific heat jump at in magnetic fields when [4]. However, recent neutron scattering data[20] show the oscillation amplitude increases below . Its naive interpretation is an increase in the electron-phonon coupling.
In our previous work[22], we have developed a general theory of anharmonic ion oscillations in tetrahedral symmetry. A strong coupling theory of superconductivity mediated by these ion oscillations has been also developed. Applying them to -pyrochlore compounds, we estimated their . We also started to study the contradiction between the change of the electron phonon coupling and the neutron data at in KOs2O6 but that was in a qualitative level.
In this Letter, we will resolve by microscopic calculations the contradiction between the data of resistivity and specific heat [4] and the neutron scattering[20] in KOs2O6 at . Our calculation demonstrates that the first-order transition is a multipolar isomorphic phase transition and the phonon anharmonicity plays a crucial role to explain the experimental data. We will apply the theory developed in ref. 22 to Os2O6 and carry out more elaborate numerical calculations in order to understand the higher-temperature and higher-energy properties of the anharmonic -cation oscillations. We will show that we can reproduce the temperature dependence of the softening of phonon energy and the amplitude of -cation oscillations in a wide range of temperatures in nice agreement with the experimental data.
We start with a short review of our model for -cation oscillation. Since the inelastic neutron experiment shows nearly momentum-independent modes of their dynamics[19], we employ a local model. The -site has the tetrahedral symmetry and this implies that the ion potential generally has, in addition to spherical and cubic fourth order terms, a third-order anharmonic term, which breaks space inversion symmetry. The ionic Hamiltonian is thus given by
| (1) |
where is set to be unity, and is the ion displacement from the equilibrium position, and is the ion mass. We ignore the higher order terms of which is irrelevant for our discussions because of positive forth order terms. We diagonalize Hamiltonian (1) numerically in the restricted Hilbert space of dimension 62196, which is about three times larger Hilbert space used in the previous study[22] and sufficient to discuss the physical properties below room temperature, by extrapolating the obtained data to the infinite limit if necessary. Details of calculations are explained in ref. 22.
An important point is the variation in potential parameters among different compounds. The Madelung part of the potential energy is essentially the same among the three compounds, since the band structure calculations[23] show essentially the same electric states for them. Thus, the main difference in the potential parameters originates from the the relaxation of local charge density as discussed in ref. 23. This point can be well captured by setting the smaller for the smaller ion. We use the same parameters as those in ref. 22: K, K and K for K, Rb, and Cs, respectively, with keeping the same values for other parameters, K/Å3 and K/Å4. The validity of our choice will be checked later by comparing the phonon energy and oscillation amplitudes with experimental data.
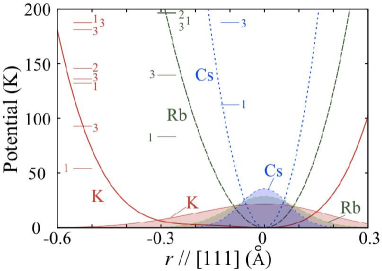
Figure 1 shows the potential profile with these parameters along [111] direction for the three compounds. Eigenenergies of Hamiltonian (1) are indicated by bars and the probability density of the ground state is also shown. The potential of K-cation is much shallower than those of Rb and Cs, and correspondingly, its has a broader tail than the others. Kuneš et al., proposed a potential with for KOs2O6 based on the first principle calculation[23], but with their choice, the K-cation oscillates about 1 Å, which is too large and inconsistent with the neutron experiment data[17, 18]. Therefore, we use positive for all the three compounds. As we will show later, our potential parameters reproduce the correct temperature dependence of the variance of ion oscillation , and also the excitation energy agreeing with the neutron and x-ray scattering data[16, 19, 17, 18].
We first calculated the variance of ion oscillation as a function of temperature from the calculated eigenfunctions of (1) and the results are shown in Fig. 2. The experimental values determined by neutron[17, 18] and x-ray[16, 17] scattering are also shown for comparison. As is clearly seen, our results are quantitatively consistent with the experimental results. For KOs2O6, we mainly concentrate on fitting the recent experimental data of ref. 18 and the low-temperature limit is consistent with the recent data Å2 just above [20]. As for Rb- and Cs-compounds, the calculated is slightly larger than the data in ref. 17. However, concerning the discrepancy between the data in refs. 17 and 18 for K-compound, our results for Rb- and Cs-compounds well capture the essential aspect of the experimental data. We note that the values in the low- limit are important to discuss the superconducting transition temperature, since these values directly influence the dimensionless electron-phonon coupling constant .
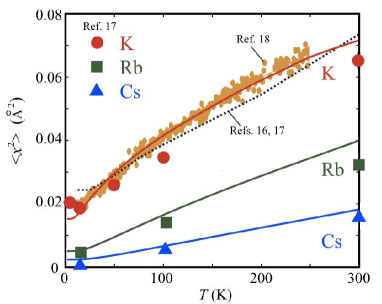
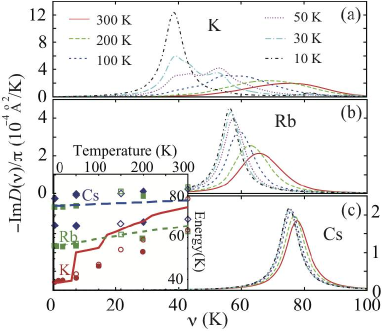
Figure 3 shows the phonon spectrum, i.e., the imaginary part of the phonon Green’s function at six different temperatures for =K, Rb and Cs compounds. is a phenomenological relaxation rate set as K. There are several peaks in the spectrum of KOs2O6 for intermediate temperatures in Fig. 3(a) owing to the anharmonic terms and the smaller compared to other members. The results are consistent with the inelastic neutron scattering spectra[19], particularly in the following three aspects. (i) The peak positions at the lowest temperature are 38.5, 52.9 and 73.1 K, which correspond to the energy of the first excited states , consistent with the neutron data at 1.5 K[19]: , 56, and 66 K for K, Rb and Cs, respectively. (ii) The softening of the peak energy with decreasing is the strongest for K, intermediate for Rb and the weakest for Cs. The temperature dependence is also qualitatively reproduced by our calculation as shown in the inset of Fig. 3. Note that the relevant mode splits into two branches owing to two cages in the unit cell, and our data correspond to their average energy. (iii) The spectrum of K at higher temperatures is much broader than that of Rb and Cs.
As discussed above, our model can explain the neutron experiments and well describes potential of -cation oscillations. These results confirm our previous work,[22] in which the superconducting transition temperature was calculated with the same parameters used in this Letter and the result is 10.5, 5.7 and 3.4 K, for K, Rb and Cs, respectively. The calculated agrees with the experimental data within K, even without optimizing parameters for each compound. The variation in among the three members is mainly attributed to the difference in the anharmonicity of -cation oscillations. Indeed, 60 % of is owing to the K-cation oscillation in KOs2O6.
As mentioned in the introduction, KOs2O6 exhibits a first-order structural transition at K, which does not break any symmetry[4, 8, 20, 21]. In ref. 24, we have proposed a scenario of isomorphic structural transition to explain it based on a simple toy model. The point is that in the tetrahedral symmetry, not only but also the third moment are nonzero and their changes at do not break the point group symmetry.
Here, we will examine this scenario by means of the present realistic model. Analyzing the changes in the oscillation profile as a function of variations in the potential parameters at , we will identify the transition as “multipolar” isomorphic one, because the change in the octupole is much larger than in the isotropic scalar . This point is important to explain the experimental results of recent neutron scattering[20] and specific heat jump at [4], which will be explained below. Our previous analysis based on the simplified toy model[24] fails to describe this point, since the model cannot distinguish and owing to the lack of the degrees of freedom. This kind of phase transition driven by a scalar order parameter is similar to that proposed for the f-electron system PrRu4P12[25].
Let us discuss the nature of the transition at and three experimental results are important. First, the magnetic field dependence of the specific heat jump at [4] indicates that the electron-phonon coupling decreases below . Secondly, a recent neutron experiment shows that jumps up at and the value is Å2 at low temperature 1.5 K[20]. Thirdly, the upper critical field shows that the first-order transition does not affect [4, 26]. The first two experimental data cannot be explained on the basis of harmonic oscillations. In the harmonic case, and thus, the increase in leads to enhanced . These puzzling experimental results are naturally explained on the basis of the multipolar isomorphic transition.
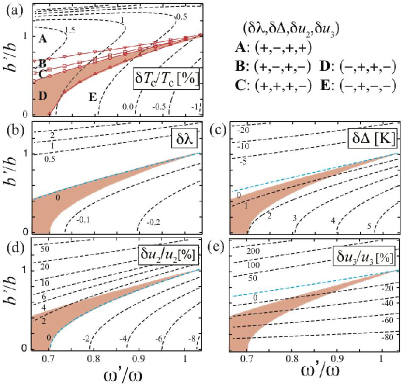
Since the transition is first-order, the potential parameters change discontinuously, which originates from, for example, the changes in volume, oxygen positions, and the inter-site ion interactions. The high- potential parameters K, K/Å3, K/Å4 change to low- ones, say, , , and , respectively. Changes in and are particularly important and we investigate the effects of their change, while we set for simplicity. Thus, with varying and , we repeat the same procedure as before[22] and calculate the deviations of dimensionless electron-phonon coupling , and gap , similarly, , , and . Here, the quantities denoted with prime symbol are the low- values calculated for the new potential parameters at for each of the parameter set. is low enough compared with and thus these quantities are regarded as those for the low-temperature limit. The results are shown in Fig. 4.
First, it is noted that there exist five regions, A-E, distinguished by the sign of , , and . In the harmonic case, only the variations characterized by the region A or E are possible, but they are not consistent with the experimental results, and . The other three regions appear as a consequence of the third-order phonon anharmonicity . Among them, it is the region D that satisfies the experimental constraints, and the low- parameters and should be located inside this region. The change in is less than 2 % and this small change is consistent with the last one of the three experimental points mentioned before.
The puzzling behavior, and , is a consequence of two competing effects. The reduction in enhances , , and , whereas the reduction in suppresses them. The change in is dominated by the effect of reduced , while the change in is rather due to reduced . Our calculation shows that the experimental results predict the constraint on the potential changes at as , as far as the changes are not so large.
One can also explain the reduction in the electrical resistivity observed at [4], since the changes and mean the suppression of the electron scatterings due to the K-cation oscillations. Finally, the nature of the first-order transition is identified by examining various moments of ion oscillations. As for the changes in and , the isotropic part of the oscillation amplitude is enhanced while anisotropic one is suppressed as shown in Figs. 4(d) and (e). Furthermore, the relative change in is much larger than that in , and this is the reason to call this a multipolar isomorphic transition.
The important point is that our calculation already reproduces changes consistent with the experimental results at . In order to carry out the further quantitative comparison between the theory and the experimental results, one needs more detailed information about the potential changes. It is also useful to observe the anisotropic part of the Debye-Waller factor and compare with theoretical calculation.
In summary, we have proposed that the first-order transition observed in KOs2O6 is a multipolar isomorphic transition and demonstrated that the third order fluctuation is the primary order parameter. Our theory naturally explains both the reduction in electron-phonon coupling constant and the enhanced oscillation amplitude at . We hope detailed neutron scattering experiments detect its change at .
Acknowledgment
The authors thank T. Dahm, K. Ueda, J. Yamaura and Z. Hiroi for discussions and also acknowledge the international workshop “New Developments in Theory of Superconductivity” held in Institute for Solid State Physics, University of Tokyo, Japan, June 22-July 10, 2009, for giving them an opportunity to discuss many aspects of this work. This work is supported by KAKENHI (No. 19052003 and No. 20740189).
References
- [1] Z. Hiroi, S. Yonezawa, and Y. Muraoka: J. Phys. Soc. Jpn. 73 (2004) 1651.
- [2] Z. Hiroi, S. Yonezawa, J. Yamaura, T. Muramatsu and Y. Muraoka: J. Phys. Soc. Jpn. 74 (2005) 1682.
- [3] Y. Kasahara, Y. Shimono, T. Shibauchi, Y. Matsuda, S. Yonezawa, Y. Muraoka, and Z. Hiroi: Phys. Rev. Lett. 96 (2006) 247004.
- [4] Z. Hiroi, S. Yonezawa, Y. Nagao, and J. Yamaura: Phys. Rev. B 76 (2007) 014523.
- [5] M. Yoshida, M. Takigawa, H. Yoshida, Y. Okamoto, and Z. Hiroi: Phys. Rev. Lett. 98 (2007) 197002.
- [6] I. Bonalde, R. Ribeiro, W. Brämer-Escamilla, J. Yamaura, Y. Nagao, and Z. Hiroi: Phys. Rev. Lett. 98 (2007) 227003.
- [7] Y. Shimono, T. Shibauchi, Y. Kasahara, T. Kato, K. Hashimoto, Y. Matsuda, J. Yamaura, Y. Nagao, and Z. Hiroi: Phys. Rev. Lett. 98 (2007) 257004.
- [8] T. Hasegawa, Y. Takasu, N. Ogita, and M. Udagawa: Phys. Rev. B 77 (2008) 064303.
- [9] Y. Nagao, J. Yamaura, H. Ogusu, Y. Okamoto, and Z. Hiroi: J. Phys. Soc. Jpn. 78 (2009) 064702.
- [10] M. Brühwiler, S. M. Kazakov, J. Karpinski, and B. Batlogg: Phys. Rev. B 73 (2006) 094518.
- [11] S. Manalo, H. Michor, and G. Hilscher: Phys. Rev. B 73 (2006) 224520.
- [12] J. Chang, I. Eremin and P. Thalmeier: New. J. Phys. 11 (2009) 055068.
- [13] G. D. Mahan and J. O. Sofo: Phys. Rev. B 47 (1993) 8050.
- [14] T. Dahm and K. Ueda: Phys. Rev. Lett. 99 (2007) 187003.
- [15] G. M. Eliashberg: Zh. Eksp. Teor. Fiz. 38 (1960) 966; [Sov. Phys. JETP 11 (1960) 696].
- [16] J. Yamaura, S. Yonezawa, Y. Muraoka, Z. Hiroi: J. Solid State Chem. 179 (2006) 336.
- [17] K. Sasai, K. Hirota, Y. Nagao, S. Yonezawa, and Z. Hiroi: J. Phys. Soc. Jpn. 76 (2007) 104603.
- [18] R. Galati, C. Simon, P. F. Henry, and M. T. Weller: Phys. Rev. B 77 (2008) 104523.
- [19] H. Mutka, M. M. Koza, M. R. Johnson, Z. Hiroi, J. Yamaura, and Y. Nagao: Phys. Rev. B 78 (2008) 104307.
- [20] K. Sasai, M. Kofu, R. M. Ibberson, K. Hirota, J. Yamaura, Z. Hiroi, and O. Yamamuro: J. Phys.: Condens. Matter 22 (2010) 015403.
- [21] J. Yamaura, M. Takigawa, O. Yamamuro, and Z. Hiroi: J. Phys. Soc. Jpn. 79 (2010) 043601.
- [22] K. Hattori and H. Tsunetsugu: Phys. Rev. B 81 (2010) 134503.
- [23] J. Kuneš, T. Jeong, and W. E. Pickett: Phys. Rev. B 70 (2004) 174510; J. Kuneš and W. E. Pickett: Physica B 378-380 (2006) 898.
- [24] K. Hattori and H. Tsunetsugu: J. Phys. Soc. Jpn 78 (2009) 013603.
- [25] T. Takimoto: J. Phys. Soc. Jpn. 75 (2006) 034714.
- [26] below for T can be extrapolated to vanishing at the same as the case of , see Fig. 10 in ref. 4. This implies that for the low- potential parameters is approximately the same as for the high- ones.