A progenitor for the extremely luminous Type Ic supernova 2007bi
Abstract
SN 2007bi is an extremely luminous Type Ic supernova. This supernova is thought to be evolved from a very massive star, and two possibilities have been proposed for the explosion mechanism. One possibility is a pair-instability supernova with an M⊙ CO core progenitor. Another possibility is a core-collapse supernova with M⊙. We investigate the evolution of very massive stars with main-sequence mass M⊙ and , which is in the metallicity range of the host galaxy of SN 2007bi, to constrain the progenitor of SN 2007bi. The supernova type relating to the surface He abundance is also discussed. The main-sequence mass of the progenitor exploding as a pair-instability supernova could be M⊙. The minimum main-sequence mass could be 310 M⊙ when uncertainties in the mass-loss rate are considered. A star with M⊙ evolves to a CO star, appropriate for the core-collapse supernova of SN 2007bi. Arguments based on the probability of pair-instability and core-collapse supernovae favour the hypothesis that SN 2007bi originated from a core-collapse supernova event.
keywords:
stars: evolution — stars: massive — stars: mass-loss — supernovae: individual: SN 2007bi — stars: Wolf-Rayet.1 Introduction
SN 2007bi was found as an extremely luminous Type Ic supernova (SN Ic). Spectral analyses deduced the production of M⊙ of radioactive 56Ni (Gal-Yam et al., 2009). The metallicity of the host galaxy of SN 2007bi, which is a subluminous dwarf galaxy, has been observed to be , corresponding to (Young et al., 2010). This metallicity is similar to those of low-metallicity galaxies undergoing -ray bursts (GRBs) associated with SNe.
This SN was proposed as a pair-instability (PI) SN from observations of the light curve and spectral analyses. The final mass was estimated to be M⊙. On the other hand, the light curve was also fitted by the energetic core-collapse (CC) explosion model (Moriya et al., 2010). The estimated progenitor was a M⊙ CO core. 40 M⊙ of ejecta, containing 6.1 M⊙ of 56Ni, were thought to be ejected. Although there is a difference in the rise period of the light curves of these models, there were no observations during the period. Hence, the explosion mechanism of SN 2007bi has not yet been clarified. Observational features such as the total 56Ni mass and the SN type will provide constraints for the progenitor.
The evolution of very massive stars connects presupernova structures and stars at the main-sequence (MS) stage. The final stellar mass, the mass of the CO core and the surface composition depend on MS mass and metallicity through burning processes and mass loss. Calculations of the evolution of very massive stars will provide the relationship of these features to MS mass.
The relationship between the amount of 56Ni produced in a SN and the CO core mass has been evaluated for PI and CC SN models. The mass range of the CO cores for PI SN progenitors has been evaluated as M⊙ (Heger & Woosley, 2002; Umeda & Nomoto, 2002). Smaller progenitors for PI SNe were also suggested by Waldman (2008). The amount of 56Ni produced in a PI SN increases with MS mass (Heger & Woosley, 2002; Umeda & Nomoto, 2002). The amount of 56Ni ejected from a CC SN is related to the CO core mass and the explosion energy (Umeda & Nomoto, 2008). A SN with an M⊙ progenitor can produce more than 3 M⊙ of 56Ni when the explosion energy is erg. These relations connect the amount of 56Ni deduced from the observations of SN 2007bi with the theoretical MS mass of a very massive star.
In this Letter, we evaluate the mass range of very massive stars with initial metallicity of ( ) appropriate for the progenitor of SN 2007bi. We calculate the evolution of very massive stars with MS mass range M⊙ taking into account uncertainties in mass-loss rate. We show the CO core mass as a function of the MS mass. Then, we constrain the MS and CO core masses using the amount of 56Ni observed in SN 2007bi. We also discuss the relationship between the SN type and surface He abundance. Finally, we deduce the ranges of MS mass in PI and CC SN models appropriate for SN 2007bi and discuss the possible explosion mechanism.
2 Progenitor Model
2.1 Stellar evolution model
In order to estimate the progenitor mass of SN 2007bi, we calculated the evolution of very massive stars from H burning until central He exhaustion. We considered a mass range of zero-age MS stars of M⊙. The initial metallicity was set to be ( Z⊙). The initial mass fractions of 1H and 4He were set to be 0.7492 and 0.2468, respectively. The relative abundances of species heavier than He were derived from Anders & Grevesse (1989).
The stellar evolution code was updated from Saio et al. (1988) and Umeda & Nomoto (2005). We used a nuclear reaction network consisting of 282 species of nuclei from n, p, to Br to calculate the time evolution of the chemical composition distribution and nuclear energy generation. We adopted reaction rates from the current version of REACLIB (Rauscher & Thielemann, 2000). The reaction rate of 12C(O was taken from Caughlan & Fowler (1988), multiplied by a factor of 1.6. For the convection treatment we assumed the Schwarzschild criterion for convective instability, and a diffusive treatment for the convective mixing. The opacity was evaluated using tables of OPAL opacity (Iglesias & Rogers, 1996), molecular opacity (Ferguson et al., 2005), and conductive opacity (Cassisi et al., 2007).
2.2 Mass-loss rate
Since mass-loss rates suffer from various uncertainties, we present models computed with the following three different mass-loss recipes.
2.2.1 Case A (standard case)
The mass-loss rate of MS stars with effective temperature 12 000 K and H mass fraction was taken from Vink et al. (2001). The mass-loss rate of stars with low surface temperature 12 000 K was adopted from de Jager et al. (1988). We multiplied the mass-loss rate by the metallicity dependence factor . The power index 0.64 is the same value as that of B supergiants in Vink et al. (2001) and is consistent with observational scaling (Mauron & Josselin, 2011).
We set the mass-loss rate of Wolf-Rayet (WR) stars with 12 000 K and as
| (1) | |||||
where and are the luminosity and helium mass fraction at the surface. The factor for the initial metallicity dependence was set to be 0.86 and 0.66 for WN and WC stars, respectively. WR stars were classified into WN, WC and WO stars in accordance with Georgy et al. (2009). We took into account equation (22) in Nugis & Lamers (2000) and the initial-metallicity dependence in Vink & de Koter (2005). Extreme, episodic mass loss in WR stars, which has been observed in some SNe (e.g. Foley et al., 2007, for SN 2006jc) was not taken into account in the present study.
2.2.2 Case B (larger mass loss during the WR phase)
We adopted the same mass-loss rates in the MS and low surface temperature phases, and rates with metallicity-dependent indices 0.60 and 0.40 for WN and WC stars, respectively. The metallicity dependence of the mass-loss rate of WR stars in the Large Magellanic Cloud and Small Magellanic Cloud was observed as for WN stars and for WC stars (Crowther, 2007). If the scaling index is small, the corresponding mass-loss rate is large.
2.2.3 Case C (smaller mass loss during whole lifetime)
We reduced the mass-loss rate in case A by a factor of 2 during the whole lifetime. Overestimations of the empirical mass-loss rate in OB stars and WR stars have been discussed (see the review in Crowther, 2007; Pulse et al., 2008). The reduction of mass-loss rate depends on wind clumping (e.g. Fullerton et al., 2006; Mokiem et al., 2007) and the degree of clumping has large uncertainties (Pulse et al., 2008). It is considered that a reduction within a factor of 2 from the theoretical evaluation (Vink et al., 2001) is allowed from stellar evolution models (Hirschi, 2008; Pulse et al., 2008). The effect of wind clumping in WR stars was taken into account by Nugis & Lamers (2000). The reduction of global mass-loss rate of WR stars by wind clumping is a factor of relative to the homogeneous model (Crowther, 2007). The surface temperature of very massive stars does not decrease to , and dust-driven winds might be ineffective. In this case, wind clumping might be effective for low surface temperature.

3 Results
3.1 Final mass of very massive stars
Fig. 1(a) shows the final mass and type of WR star as a function of the MS mass. The final progenitor mass depends on the mass-loss rate as well as on the MS mass. The dependence on the mass-loss rate is larger for more massive stellar models. In case A the final mass increases with the MS mass. These stars evolve to WO stars except for the one with M⊙. The final mass of the stars in case B rises with the MS mass except for the range of M⊙. All of the stars evolve to WO stars. The increasing final mass is also shown in case C. The final type of the star depends on the MS mass. The relatively ‘low’-mass stars with 120 M⊙ evolve to WN stars. The stars with 140 and 300 M⊙ evolve to WC stars. The former WC stars lose their remaining He envelope during carbon burning. The He envelope of the latter stars has mostly been stripped away before carbon burning. The other stars evolve to WO stars.
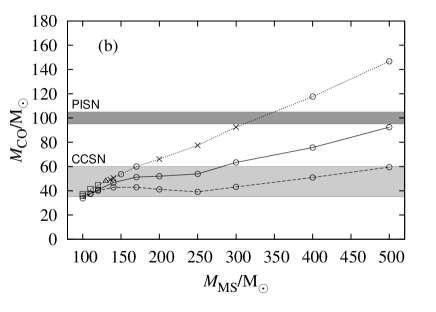
The mass of the CO core of an evolved star is important for the explosion mechanism of SN 2007bi. Fig. 1(b) shows the CO core mass as a function of the MS mass. The mass of the CO core is defined as the largest mass coordinate satisfying a He mass fraction smaller than (Umeda & Nomoto, 2008). The CO core mass of a star with a given and mass-loss rate is smaller by per cent than the corresponding final mass.
3.2 Ejected amount of 56Ni and mass of CO core
From analyses of the light curve and spectra of SN 2007bi, the ejection of M⊙ of 56Ni has been derived. The average amount of 56Ni is 5.3 M⊙. The amount of ejected 56Ni has been connected to the CO core mass in previous studies. Here we constrain the range of MS mass from the amount of 56Ni in SN 2007bi.
Nucleosynthesis studies of PI SNe have indicated that PI SN models with 95 105 M⊙ produce M⊙ of 56Ni (Heger & Woosley, 2002). The PI SN models of Umeda & Nomoto (2002) obtained a similar result. Therefore the progenitor of the PI SN corresponding to SN 2007bi should be a CO core with 95 105 M⊙.
The MS mass range deduced from the CO core mass is shown as the dark shaded region in Fig. 1(b). This criterion is not satisfied in the MS mass range of in cases A and B. The MS mass range in case A is estimated to be 515 575 M⊙ from linear extrapolation in Fig. 1(). In case C, the appropriate range reduces to 310 350 M⊙.
The amount of 56Ni produced in a CC SN model gives a lower limit on the progenitor mass. We expect from the result of Umeda & Nomoto (2008) that a SN with a kinetic energy of erg can produce more than 3 M⊙ of 56Ni if the CO core of the progenitor is larger than M⊙. The upper limit of the MS mass might be the lowest mass of a PI SN progenitor. Theoretical studies of PI SNe have indicated that a CO core larger than M⊙ explodes as a PI SN (Heger & Woosley, 2002; Umeda & Nomoto, 2002). We consider the upper limit of a CC SN progenitor as M⊙. Therefore, the CO core mass appropriate for explaining SN 2007bi with a CC explosion is 35 60 M⊙.
The range of MS mass for CC SN models is shown as the light shaded region in Fig. 1(b). The range extends from 100 to 280 M⊙ in case A. In case B, all models except for M⊙ will explode as CC SNe appropriate for SN 2007bi. On the other hand, in case C, the mass range is limited to 100 170 M⊙.
3.3 Surface He abundance for SNe Ib/Ic
SNe Ic are characterized by weak or absent He spectra. However, a quantitative criterion to distinguish between SNe Ib and Ic has not been theoretically established. The He lines are considered to appear because of the excitation of He by non-thermal electrons excited by -rays from the decays of 56Ni and 56Co (Lucy, 1991). The strength of the He lines should be sensitive to the amounts of He and 56Ni, the amount of matter in intermediate layers between Ni and He layers which attenuate the -rays, the degree of mixing of Ni into He layer, etc. Criteria to distinguish between SNe Ib and Ic were discussed using the total He mass of a progenitor (Wellstein & Langer, 1999; Georgy et al., 2009; Yoon et al., 2010) or the He mass fraction at the outermost layers (Yoon et al., 2010). The effects of thickness of the intermediate layers and the degree of mixing have been investigated (Woosley & Eastman, 1997). We discuss the possibility of a SN Ic progenitor by considering the total He mass, the He mass fraction at the surface and the mass ratio of He to the intermediate layers.
The first criterion is based on the total He mass. We consider two cases for the He mass limit of SNe Ic: 0.5 and 1.5 . In previous studies, the He mass limit of SNe Ic was assumed to be 0.5 (Wellstein & Langer, 1999; Yoon et al., 2010) or 0.6 (Georgy et al., 2009). On the other hand, Georgy et al. (2009) reported that the choice of the total He mass limit between 0.6 and 1.5 M⊙ hardly affects the ranges for SNe Ib/Ic. Yoon et al. (2010) suggested in discussion that He lines are not seen in early-time spectra even though the total He mass is as large as 1.0 M⊙ if He is well mixed with CO material having . Fig. 2(a) shows the total He mass versus the MS mass. When the He mass limit is 0.5 , the MS mass is limited in the very narrow range of M⊙ in case A and M⊙ in case B. In case C no progenitors explode as SNe Ic. When the He mass limit is 1.5 , all progenitors except for WN stars, an ‘He-rich’ WC star with M⊙ in case C, and stars with M⊙ in case C will explode as SNe Ic.
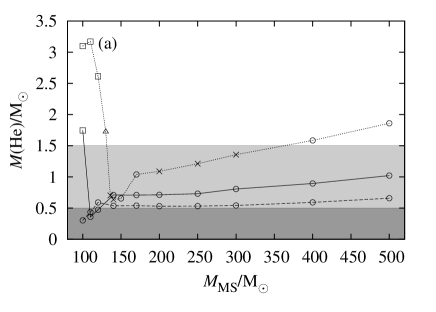
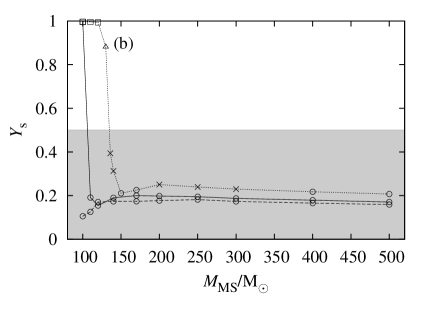

The second criterion is the He mass fraction at the surface. We set this criterion as in accordance with the discussion in Yoon et al. (2010) as mentioned above. Fig. 2(b) presents the He mass fraction at the surface as a function of the MS mass. All WO stars and WC stars except for the He-rich WC will explode as SNe Ic.
We also consider the mass ratio of He to the intermediate layers. The mass of the intermediate layers is assumed to be M⊙. The mass of 9.0 corresponds to the amount of ejected 56Ni and the central remnant in the CC SN model. The masses of 56Ni and the central remnant were evaluated to be 6.1 and 3.0 , respectively, for the M⊙ progenitor (Moriya et al., 2010). Although the amount of 56Ni would be smaller than 9 and there is no remnant in the PI SN model, the difference is not important because the final mass of the PI SN progenitors is M⊙. The mass ratio of He to the intermediate layers is shown in Fig. 2(c). The ratios of WN stars and the He-rich WC star are clearly larger than those of WO and the other WC stars. We may set the criterion of the ratio as . In this case, the range of MS mass is the same as that deduced from the criterion of the He mass fraction at the surface.
| Condition | PI SN | CC SN | |
| (M⊙) | (M⊙) | ||
| Case A | |||
| 0 | |||
| or | 0.024 | ||
| Case B | |||
| 0 | |||
| or | 0 | ||
| Case C | |||
| or | 0.19 | ||
4 Range of Main-Sequence Mass for the SN 2007bi Progenitor
We evaluate the ranges of MS mass appropriate for explaining SN 2007bi by the PI SN and CC SN models taking into account the range of CO core mass and the surface He abundance. Table 1 presents the MS mass range with different conditions of He abundance and mass-loss rate. The MS mass range strongly depends on the surface He conditions. If He lines appear with a total He mass larger than 0.5 M⊙, then there is no mass range of the PI SN model for SN 2007bi. The MS mass range of the CC SN model is also limited to M⊙. However, this condition may be too strict, as discussed by Yoon et al. (2010). If the progenitors explode as Type Ic SNe with M⊙ or , the MS mass range is mainly determined by the condition of the CO core mass. Thus the minimum MS mass for the PI SN model is 310 M⊙. The MS mass range of the CC SN model in case A becomes slightly narrower: 110 280 M⊙. In cases B and C the mass range is determined by the mass of the CO core.
We now discuss the probabilities of SN 2007bi exploding as a PI SN and a CC SN, considering the MS mass range and Salpeter initial mass function (IMF) (). The ratio of the probability of explosion as a PI SN to explosion as a CC SN, , is also listed in Table 1. If He lines are not seen for M⊙ or , the probability of the CC SN model is about 40 times larger than that of the PI SN model in case A. In case B, the PI SN model is not adequate for SN 2007bi because of large mass loss. In case C, on the other hand, the probability of the CC SN model is larger than that of the PI SN model by a factor of 5. However, if He lines are observed with a total He mass of M⊙, the PI SN model is inadequate for SN 2007bi in all mass-loss cases. It is important to establish more definite classification criteria for SNe Ic.
It has been argued that very massive CO cores would collapse to form black holes and become dark or very faint SNe (e.g., review in Smartt, 2009). In this case, the probability of explosion as a CC SN would become much smaller. Observational or theoretical evaluation of the fraction of dark or faint SNe in the death of very massive stars will more precisely constrain the probability of the CC SN model.
5 Concluding Remarks
We have investigated the evolution of very massive stars with M⊙ and from H burning to central He exhaustion to constrain the progenitor of an extremely luminous Type Ic SN 2007bi. If SN 2007bi is a PI SN, the progenitor could be evolved from a MS star with 515 575 M⊙. If SN 2007bi is a CC SN, the appropriate range of the MS mass is 110 280 M⊙. When we take into account a Salpeter IMF, the probability of SN 2007bi exploding as a CC SN is about 40 times larger than for a PI SN. If the mass-loss rate is small, the minimum mass for the progenitor becoming a PI SN is about 310 M⊙. The mass range changes to M⊙ for the PI SN model and M⊙ for the CC SN model. If the mass-loss rate is large or He lines appear for an He mass of M⊙, then SN 2007bi should have exploded as a CC SN. Although the light curve of SN 2007bi was fitted by both the PI SN and CC SN models, the CC SN model is favoured as explaining the explosion of SN 2007bi from arguments based on the probability ratio of the PI SN model appropriate for SN 2007bi to the CC SN model.
We should note that the conditions of He abundance for the progenitor to become a Type Ic SN strongly affect the probability of a PI SN. If a total He mass M⊙ enables the formation of He spectra, the PI SN model would be inadequate for SN 2007bi even for a small mass-loss rate. It is quite important to evaluate more definite criteria to classify SNe Ic. We also note the probability of direct collapse without bright SNe for CC SN cases. This would reduce the probability of a CC SN for SN 2007bi. It is necessary to evaluate theoretically or observationally the fraction of black hole formation without bright SNe in CC SNe.
If the progenitor of SN 2007bi or a more massive star was rotating very fast, it could explode as a SN Ic associated with a GRB. We may not have seen such a GRB-SN because of the orientation effect. This is also interesting point to investigate in the future.
Acknowledgments
We acknowledge the anonymous referee for many valuable comments. We thank Hideyuki Saio for providing the stellar evolution code and for useful comments. We are grateful to Masaomi Tanaka, Nobuyuki Iwamoto, and Ken’ichi Nomoto for useful discussions. This work was supported by the grants-in-aid for Scientific Research (20041005, 20105004) from the MEXT of Japan.
References
- Anders & Grevesse (1989) Anders, E., Grevesse, N., 1989, Geochim. Cosmochim. Acta, 53, 197
- Cassisi et al. (2007) Cassisi, S., Potekhin, A. Y., Pietrinferni, A., Catelan, M., Salaris, M., 2007, ApJ, 661, 1094
- Caughlan & Fowler (1988) Caughlan, G. A., & Fowler, W. A., 1988, At. Data Nucl. Data Tables, 40, 283
- Crowther (2007) Crowther, P. A., 2007, ARA&A, 45, 177
- de Jager et al. (1988) de Jager, C., Nieuwenhuijen, H., van der Hucht, K. A., 1988, ApJS, 369, 574
- Ferguson et al. (2005) Ferguson, J. W., Alexander, D. R., Allard, F., Barman, T., Bodnarik, J. G., Hauschildt, P. H., Heffner-Wong, A., Tamanai, A., 2005, ApJ, 623, 585
- Foley et al. (2007) Foley, R. J., Smith, N., Ganeshalingam, M., Li, W., Chornock, R., Filippenko, A. V., 2007, ApJL, 657, L105
- Fullerton et al. (2006) Fullerton, A. W., Massa, D. L., Prinja, R. K., 2006, ApJ, 637, 1025
- Gal-Yam et al. (2009) Gal-Yam, A. et al., 2009, Nat, 462, 624
- Georgy et al. (2009) Georgy, C., Meynet, G., Walder, R., Folini, D., Maeder, A., 2009, A&A, 502, 611
- Heger & Woosley (2002) Heger, A., Woosley, S. E., 2002, ApJ, 567, 532
- Hirschi (2008) Hirschi, R., 2008, in Clumping in Hot Star Winds, eds. W.-R. Hamann, A. Feldmeier, L. M. Oskinova, Universitätsverlag Potsdam, Potsdam, p. 9
- Iglesias & Rogers (1996) Iglesias, C. A., Rogers, F. J., 1996, ApJ, 464, 943
- Lucy (1991) Lucy, L. B., 1991, ApJ, 383, 308
- Mauron & Josselin (2011) Mauron, N., Josselin, E., 2011, A&A, 526, A156
- Moriya et al. (2010) Moriya, T., Tominaga, N., Tanaka, M., Maeda, K., Nomoto, K., 2010, ApJL, 717, L83
- Mokiem et al. (2007) Mokiem, M. R. et al., 2007, A&A, 473, 603
- Nugis & Lamers (2000) Nugis, T., Lamers, H. J. G. L. M., 2000, A&A, 360, 227
- Pulse et al. (2008) Pulse, J., Vink, J. S., Najarro, F., 2008, A&AR, 16, 209
- Rauscher & Thielemann (2000) Rauscher, T., Thielemann, F.-K., 2000, At. Data Nucl. Data Tables, 75, 1
- Saio et al. (1988) Saio, H., Nomoto, K., Kato, M., 1988, ApJ, 331, 388
- Smartt (2009) Smartt, S. J., 2009, ARA&A, 47, 63
- Umeda & Nomoto (2002) Umeda, H., Nomoto, K., 2002, ApJ, 565, 385
- Umeda & Nomoto (2005) Umeda, H., Nomoto, K., 2005, ApJ, 619, 427
- Umeda & Nomoto (2008) Umeda, H., Nomoto, K., 2008, ApJ, 678, 1014
- Vink & de Koter (2005) Vink, J. S., de Koter, A., 2005, A&A, 442, 587
- Vink et al. (2001) Vink, J. S., de Koter, A., Lamers, H. J. G. L. M., 2001, A&A, 369, 574
- Waldman (2008) Waldman, R., 2008, ApJ, 685, 1103
- Wellstein & Langer (1999) Wellstein, S., Langer, N., 1999, A&A, 350, 148
- Woosley & Eastman (1997) Woosley, S. E., Eastman, R. G., 1997, In: Thermonuclear Supernovae, eds. Ruiz-LaPuente P., Canal, R., & Isern, J., NATO ASI Ser. C., Vol. 486, Kluwer Publishers, 821
- Yoon et al. (2010) Yoon, S.-C., Woosley, S. E., Langer, N., 2010, ApJ, 725, 940
- Young et al. (2010) Young, D. R. et al., 2010, A&A, 512, A70