Planets from the HATNet project
Abstract
We summarize the contribution of the HATNet project to extrasolar planet science, highlighting published planets (HAT-P-1b through HAT-P-26b). We also briefly discuss the operations, data analysis, candidate selection and confirmation procedures, and we summarize what HATNet provides to the exoplanet community with each discovery.
1 Harvard-Smithsonian CfA, 60 Garden St., Cambridge, MA, USA [gbakos@cfa.harvard.edu]
2 Konkoly Observatory, Budapest
1. Introduction
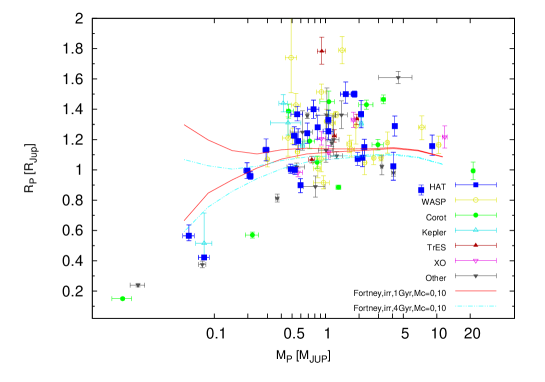
The Hungarian-made Automated Telescope Network (HATNet; Bakos et al. 2004) survey, has been one of the main contributors to the discovery of transiting exoplanets (TEPs), being responsible for approximately a quarter of the confirmed TEPs discovered to date (Fig. 1). It is a wide-field transit survey, similar to other projects such as Super-WASP (Pollaco et al. 2006), XO (McCullough et al. 2005), and TrES (Alonso et al. 2004). The TEPs discovered by these surveys orbit relatively bright stars () which allows for precise parameter determination (e.g. mass, radius and eccentricity) and enables follow-up studies to characterize the planets in detail (e.g. studies of planetary atmospheres, or measurements of the sky-projected angle between the orbital axis of the planet and the spin axis of its host star). Since 2006, HATNet has announced twenty-six TEPs111Meaning that the scientific results were submitted to peer reviewed journals and posted to arXiv, the planet host stars have been uniquely identified, and all discovery data have been made public.. Below we highlight some of the exceptional properties of these planets (Section 2), we then describe the procedures which we followed to discover them (Section 3), and we conclude by summarizing what HATNet provides to the TEP community with each discovery (Section 4).
2. Highlights
HATNet-detected TEPs span a wide range of physical properties, including: two Neptune-mass planets (HAT-P-11b, Bakos et al. 2010a; and -26b, Hartman et al. 2010b); planets with masses greater than (-2b, Bakos et al. 2007; and -20b, Bakos et al. 2010b); compact planets (-2b, and -20b); inflated planets (-7b, Pál et al. 2008; -8b, Latham et al. 2009; -12b, Hartman et al. 2009; -18b, and -19b, Hartman et al. 2010a); a planet with a period of just over one day (-23b, Bakos et al. 2010b); planets with periods greater than 10 days (-15b, Kovács et al. 2010; and -17b, Howard et al. 2010); multi-planet systems (-13b,c, Bakos et al. 2009; and -17b,c); and a number of eccentric planets (-2b; -11b; -14b, Torres et al. 2010; -15b; -17b; and -21b, Bakos et al. 2010b). We have also provided evidence for outer planets for 4 systems: HAT-P-11c, -13c, -17c (the latter two with almost closed orbits), and HAT-P-19c.
Some of these discoveries were the first of their kind, and thus were important landmarks in exoplanet science. This includes: the first transiting heavy-mass planet (-2b); the first retrograde planet (-7b; Narita et al. 2009, Winn et al. 2009); two of the first four transiting Neptunes; the first inflated Saturn (-12b); the first and second multi-planet systems with transiting inner planets; and two of the first six planets with periods longer than 10 days.
3. How HATNet Discovers Planets
The 26 HATNet TEPs were identified from a shortlist of 1300 hand-selected transit candidates culled from millions of light curves, which were, in turn, the result of diverse activities ranging from remote hardware operations to data analysis. Here we briefly describe this process.
3.1 Instrumentation
HATNet utilizes 6 identical instruments, each with an 11 cm aperture f/1.8 lens and a front-illuminated CCD with 9′′ pixels (yielding a wide, field), attached to a horseshoe mount, protected by a clam-shell dome, and with all devices controlled by a single PC. Each instrument, called a HAT (Bakos et al. 2002), can obtain per-image photometric precision reaching 4 mmag at 3.5-min cadence on the bright end at , and 10 mmag at . By collecting a light curve with or more points in transit, a transit with a depth of only a few mmag may be detected. We note that the original HATNet hardware employed front illuminated detectors with Cousins -band filters. This was replaced to front-illuminated CCDs and Cousins filters in 2007 September, and the filter was changed to Sloan in 2008 July.
Four HAT instruments are located at the Smithsonian Astrophysical Observatory’s (SAO) Fred Lawrence Whipple Observatory (FLWO), and an additional two instruments are on the roof of the hangar servicing the antennae of SAO’s Submillimeter Array, at Mauna Kea Observatory (MKO) in Hawaii. The network with its current longitude coverage has significant advantages in detecting TEPs with periods longer than a few days.
3.2 Data acquisition and TEP Candidate Selection
The instruments are truly autonomous in the sense that they are aware of the observing schedule and the weather conditions, they prepare all the devices (CCDs, dome, telescope) for the observations, acquire ample calibration frames (biases, darks, skyflats), and then proceed to the science program of the night. For the purpose of monitoring bright stars for transits, the sky has been split up to 838 non-overlapping fields. Fields are chosen for observation based on several factors such as optimal visibility at the given time of the year, proximity of the field to Solar system objects, and various other factors. To date HATNet has observed fields (29% of the northern sky). Typically a field is monitored for 3 months; a given instrument will begin observations of the field after evening twilight and observe it continuously at a cadence of 3.5 minutes until the field sets. The instrument will then target a second field and continue observing it until morning twilight. All time between dusk and dawn is spent by exposing on the selected fields. A single field is typically assigned to a FLWO instrument as well as a MKO instrument to increase the duty cycle of the observations. Based on operations since 2003, we find that the effective duty cycle of HATNet is .
The images are calibrated using standard techniques that take into account the problems raised by the wide FOV, such as strong vignetting, distortions, sky-background changes, etc. The entire data flows to the CfA via fast Internet. The astrometric solution is determined following Pál & Bakos (2006), based on the Two Micron All Sky Survey (2MASS; Skrutskie et al. 2006) catalog. We then perform aperture photometry at the fixed positions of the 2MASS stars. An initial ensemble magnitude calibration is performed, and the remaining systematic variations are removed from the light curves by decorrelating against external parameters (i.e. parameters describing the point spread function, the position of the star on the image, and others) and by making use of the Trend Filtering Algorithm (TFA; Kovács et al. 2005). The resulting light curves typically reach a per-point photometric precision (at 3.5 min cadence) of mmag for the brightest non-saturated stars.
We search the trend filtered light curves for periodic transit events using the Box-fitting Least Squares algorithm (BLS; Kovács et al. 2002). We then subject potential transit candidates to a number of automatic filters to select reliable detections which are consistent with a transiting planet-size object, and are not obviously eclipsing binary star systems or other types of variables.
3.3 Selecting, Confirming, and Characterizing TEPs
To go from the lengthy list of potential transit candidates to a much smaller number of confirmed and well-characterized TEPs, we first manually select a list of candidates to consider for follow-up observations, we gather and analyze spectroscopic and photometric observations to reject false positives and confirm bona fide TEPs, and we finally analyze and publish the confirmed TEP systems.
The automated transit candidate selection procedure provides a manageable list of potential candidates which must then be inspected by eye to select the most promising targets for follow-up. Typically a few hundred to one thousand potential candidates per field are identified by the automated procedures, which are then narrowed down to a few dozen candidates deemed worthy of follow-up. At the end of this procedure, relative priorities are assigned to these candidates and appropriate facilities for follow-up are identified.
Candidates selected for follow-up then undergo a procedure consisting of three steps: reconnaissance spectroscopy, photometric follow-up observations, and high-precision spectroscopy.
We have found that a very efficient method to reject the majority of false positive transit detections is to first obtain one or more high-resolution, low signal-to-noise ratio (S/N per resolution element) spectra using a – m telescope (e.g. Latham et al. 2009). Double-lined eclipsing binaries, giant stars (where the detected transit is most likely a blend between an eclipsing binary and the much brighter giant), and rapidly rotating stars or excessively hot stars (where confirming a planetary orbit would be very difficult) may be immediately rejected based on one spectrum. Stars that are confirmed to be slowly rotating dwarfs are observed a second time at the opposite quadrature phase to look for a significant velocity variation. Stars where the RV amplitude implies a stellar companion (typically km s-1) are rejected. In some cases changes in the shape of the spectral line profile may also be detected, enabling us to reject the target as a stellar triple.
We find that a significant fraction of the initial candidates selected for follow-up are rejected by this reconnaissance spectroscopy (RS) procedure, saving time on precious resources that we use for the final follow-up. To carry out the RS work we primarily use the FLWO 1.5 m telescope, previously with the Digital Speedometer (DS), and now with the Tillinghast Reflector Echelle Spectrograph (TRES), and to some extent the FIber-fed Echelle Spectrograph (FIES) on the Nordic Optical Telescope (NOT) at La Palma. We have also made use of the echelle spectrograph on the Du Pont 2.5 m telescope at LCO, the echelle spectrograph on the ANU 2.3 m telescope at SSO, and the CORALIE Echelle spectrograph on the 1.2 m Euler telescope at La Silla Observatory (LSO) in Chile.
If a candidate passes the RS step, we then schedule photometric observations of the candidate over the course of a transit to confirm that the transit is real, and to confirm that the shape of the transit light curve is consistent with a TEP. We also note that these follow-up light curves are essential for obtaining precise measurements of system parameters, such as the planet-star radius ratio or the transit impact parameter. In some cases the candidate is subjected to photometry follow-up without RS or with incomplete RS, when, e.g., there is evidence that the star is a dwarf (colors, proper motion, parallax), or when the transit events are rare (long period). We primarily use the KeplerCam instrument on the FLWO 1.2 m telescope, but have also made use of Faulkes Telescope North (FTN) of the Las Cumbres Observatory Global Telescope (LCOGT) on Mauna Haleakala, Hawaii, and occasionally telescopes in Hungary and Israel.
The final step in the confirmation follow-up procedure is to obtain high-resolution, high-S/N spectra with sufficient velocity precision to detect the orbital variation of the star due to the planet, confirm that the system is not a subtle blend configuration, and measure the effective temperature, surface gravity and metallicity of the star. By this stage we have already excluded the majority of false positives, so that roughly half of the candidates that reach this step are confirmed as TEPs. False positives that reach this stage generally are rejected after only a few spectra are obtained, so that of the time is spent observing TEPs. We primarily use the HIgh Resolution Echelle Spectrometer (HIRES) with the iodine cell on the 10 m Keck I telescope at MKO. We have also used the FIES/NOT facility, the High Dispersion Spectrograph (HDS) with the iodine cell on the Subaru 8.2 m telescope at MKO, and the SOPHIE instrument on the 1.93 m telescope at the Observatoire de Haute-Provence (OHP), in France.
Once a planet is confirmed, we conduct a joint analysis of the available high-precision RV observations and photometric observations to determine the system parameters, including in particular the masses and radii of the star and planet(s) (e.g. Bakos et al. 2010a). In cases where the spectral line bisector spans are inconclusive, we must also carry out a detailed blend-model of the system concurrently with the TEP modeling to definitively prove that the object is a TEP.
4. What HATNet Provides
The HATNet project strives to provide the following to the community for a given TEP discovery:
-
1.
HATNet discovery data.
-
2.
High-precision, often multi-band, photometry follow-up.
-
3.
High-precision radial velocity follow-up.
-
4.
Access to all of the data via the online tables, including raw and detrended values.
-
5.
Characterization of the host star: stellar atmospheric and fundamental parameters (from isochrone fitting).
-
6.
A blend analysis.
-
7.
Accurate parameters of the planetary system.
-
8.
A publication available on arXiv with all the above when the planet is announced.
-
Acknowledgements.
HATNet operations have been funded by NASA grants NNG04GN74G, NNX08AF23G and SAO IR&D grants. Work of G.Á.B. was supported by the Postdoctoral Fellowship of the NSF Astronomy and Astrophysics Program (AST-0702843). We wish to thank all our collaborators the help they have provided over the past years.
References
Alonso, R., et al. 2004, ApJ, 613, L153
Bakos, G. Á., Lázár, J., Papp, I., Sári, P., & Green, E. M. 2002, PASP, 114, 974
Bakos, G. Á., Noyes, R. W., Kovács, G., Stanek, K. Z., Sasselov, D. D., & Domsa, I. 2004, PASP, 116, 266
Bakos, G. Á., et al. 2007, ApJ, 670, 826
Bakos, G. Á., et al. 2010a, 710, 1724
Bakos, G. Á., et al. 2010b, ApJ submitted, arXiv:1008.3388
Fortney, J. J., Marley, M. S., & Barnes, J. W. 2007, ApJ, 659, 1661
Hartman, J. D., et al. 2009, ApJ, 706, 785
Hartman, J. D., et al. 2010a, ApJ submitted, arXiv:1007.4850
Hartman, J. D., et al. 2010b, ApJ submitted, arXiv:1010.1008
Howard, A. W., et al. 2010, ApJ submitted, arXiv:1008.3898
Kovács, G., Zucker, S., & Mazeh, T. 2002, A&A, 391, 369
Kovács, G., Bakos, G.Á., & Noyes, R. W. 2005, MNRAS, 356, 557
Kovács, G., et al. 2010, ApJ in press, arXiv:1005.5300
Latham, D. W., et al. 2009, ApJ, 704, 1107
McCullough, P. R., et al. 2005, PASP, 117, 783
Narita, N., Sato, B., Hirano, T., & Tamura, M. 2009, PASJ, 61, L35
Pál, A., & Bakos, G. Á. 2006, PASP, 118, 1474
Pál, A., et al. 2008, ApJ, 680, 1450
Pollacco, D. L., et al. 2006, PASP, 118, 1407
Skrutskie, M. F., et al. 2006, AJ, 131, 1163
Torres, G., et al. 2010, ApJ, 715, 458
Winn, J. N., et al. 2009, ApJ, 703, L99