X-ray spectral properties of Seyfert galaxies and the unification scheme
Abstract
Aims. The unification scheme of Seyfert galaxies predicts that the observed differences between type 1 and type 2 Seyfert galaxies are solely due to the differing orientations of the toroidal-shaped obscuring material around AGN. The observed X-ray spectra of Seyfert type 2s compared to type 1s are expected to be affected by higher absorbing column density due to the edge-on view of the obscuring torus. We study the 0.5 - 10 keV X-ray spectral properties of Seyfert type 1s and type 2s with the aim to test the predictions of Seyfert unification scheme in the X-ray regime.
Methods. We use an optically selected Seyfert sample in which type 1s and type 2s have matched distributions in the orientation independent parameters of AGN and host galaxy.
Results. The 0.5 - 10 keV XMM-Newton pn X-ray spectra of Seyfert galaxies are in general best fitted with a model consists of an absorbed power-law, a narrow Gaussian fitted to the Fe K emission line and an often seen soft excess component characterized by either a thermal plasma model with temperature kT 0.1 - 1.0 keV and/or a steep power-law. The 2.0 - 10 keV hard X-ray continuum emission in several Seyfert type 2s is reflection dominated and suggests the Compton-thick obscuration. Results on the statistical comparison of the distributions of the observed X-ray luminosities in the soft (0.5 - 2.0 keV) and hard (2.0 - 10.0 keV) bands, the X-ray absorbing column densities, the equivalent widths of Fe K line and the flux ratios of hard X-ray to [OIII] 5007Å for the two Seyfert subtypes are consistent with the obscuration and orientation based unification scheme.
Key Words.:
Galaxies: Seyfert – X-rays: galaxies – Galaxies: active1 Introduction
Seyfert galaxies are classified mainly into two classes, based on the presence (type 1) or absence (type 2) of broad emission lines in their optical spectra (Antonucci 1993). The unification scheme of Seyfert galaxies hypothesizes that Seyfert type 1s and type 2s constitute the same parent population and appear different solely due to the differing orientations of the AGN axis w.r.t. the line-of-sight. The scheme requires the presence of toroidal-shaped dusty molecular obscuring material around the AGN. In the type 2s, this torus is inclined edge-on and blocks the direct view to the nuclear region, while in type 1s the observer’s line-of-sight is away from the plane of the torus and the central region is visible (Antonucci & Miller 1985; Antonucci 1993; Urry et al. 1995).
Several investigations in the literature have yielded results consistent with the predictions of this scheme, such as, the presence of broad emission lines in the polarized optical and infrared spectra of many Seyfert 2s (Moran et al. 2000), the biconical structure of the narrow line region (Mulchaey et al. 1996), the similarity of CO masses of the two Seyfert subtypes (Maiolino et al. 1997), and similar nuclear radio properties of both the subtypes (Lal et al. 2011). Inconsistencies with the predictions of the scheme remain however, the absence of hidden Seyfert 1 nuclei in several Seyfert 2s (Tran 2001, 2003), Seyfert 1s being preferentially hosted in galaxies of earlier Hubble type (Malkan et al. 1998), the lack of X-ray absorption in some Seyfert 2s (Panessa & Bassani 2002), and Seyfert 2s having a higher propensity for nuclear starbursts (Buchanan et al. 2006). Moreover, it has been evident that the sample selection plays a crucial role in testing the predictions of Seyfert unification scheme (Antonucci 2002). Ho & Ulvestad (2001) have discussed that the optical and UV selected samples are likely to have inherent biases against the obscured sources. IR selected samples can be biased towards unusually dusty as well as sources which have higher level of nuclear star formation (Ho & Ulvestad 2001; Buchanan et al. 2006). X-ray selected samples have also been used to examine the validity of Seyfert unification (Awaki et al. 1991; Smith & Done 1996; Turner et al. 1997a, b, 1998; Bassani et al. 1999). However, the Seyfert samples selected from flux limited surveys are likely to have obscured type 2 Seyferts that are intrinsically more luminous than the selected type 1 counterparts. Maiolino et al. (1998) and Risaliti et al. (1999) have shown the increased number of heavily obscured type 2 sources using a sample based on [OIII] 5007Å line luminosity, suggesting the generally inherent bias against less luminous and heavily obscured sources in X-ray selected samples. Hard X-ray selected samples are suppose to be less biased but cannot be granted to be free from biases against heavily obscured Compton-thick and low luminosity AGNs (Heckman et al. 2005; Wang et al. 2009). Recent Seyfert samples based on INTEGRAL and Swift/BAT surveys preferentially contain relatively large number of high luminosity and less absorbed Seyferts (Tueller et al. 2008; Treister et al. 2009; Beckmann et al. 2009), possibly due to less effective area which limits the sensitivity only to (10-11 erg s-1 cm-2) bright sources.
The quest of testing the validity and limitations of the Seyfert unification with more
improved and well defined samples still continues. Recent studies by
Cappi et al. (2006); Dadina (2008); Beckmann et al. (2009) used
less biased optically and X-ray selected samples and reported the results broadly consistent with unification,
nonetheless, issues related to sample selection still remains.
Keeping the above sample selection arguments in mind we opted to use a sample in which the distributions for type 1 and
type 2 Seyferts are matched in orientation independent parameters. Such sample selection
mitigates the biases generally inherent
in flux limited surveys and also ensures that the two Seyfert subtypes are intrinsically similar within the
framework of Seyfert unification scheme (Schmitt et al. 2003; Lal et al. 2011).
In the standard picture of the unification scheme, AGN powered by accretion on to supermassive black hole and surrounding
broad line region clouds are embedded in an obscuring torus (Antonucci & Miller 1985; Antonucci 1993; Urry et al. 1995).
The X-ray emission originating from the AGN carries the imprints of obscuring and reprocessing material.
Therefore Seyfert X-ray spectra are expected to differ depending upon whether the AGN is viewed
directly (type 1s) and through the obscuring torus (type 2s).
In Seyfert type 2s, the intrinsic X-ray emission is attenuated by the obscuring torus
and the observed flux as well as the X-ray spectral shape depend on the optical depth of the obscuring
torus (Awaki et al. 1991; Smith & Done 1996; Turner et al. 1997a; Bassani et al. 1999; Cappi et al. 2006).
Since the photoelectric absorption cross-section decreases with the increase in photon energy,
an increasing fraction of primary high energy photons are expected to transmit through the torus.
Therefore, Seyfert type 1s and type 2s are expected to show systematically
less difference for the observed hard X-ray luminosities and more difference for the soft X-ray (E 2.0 keV) luminosities.
Since in type 2s, AGN is viewed through the obscuring torus therefore type 2s are expected to show systematically higher absorbing column densities
than type 1s.
The absorbing column density can be measured via photoelectric absorption component in 0.5 - 10 keV spectral fits as long as
obscuration is Compton-thin (NH 1024 cm-2).
If obscuration is Compton-thick (NH 1024 cm-2), type 2s become faint even at higher X-ray energies
since high energy photons are Compton-down scattered to soft photons which eventually get absorbed or scattered out of the line-of-sight (Matt et al. 2000a).
The equivalent width (EW) of Fe K line also increases with the absorbing column density as it is measured against much depressed continuum and
for Compton-thick sources it increases to 1 keV (Ghisellini et al. 1994; Levenson et al. 2006).
The flux ratio of hard X-ray (2.0 - 10 keV) to [OIII] 5007Å line emission can also be used as a diagnostic parameter
for the amount of obscuration and type 2s compared to type 1s are expected to show lower flux ratios of hard X-ray to [OIII] (Bassani et al. 1999; Cappi et al. 2006).
In this paper we test these predictions of the unification scheme by comparing the properties such as the observed
soft and hard X-ray luminosities, the X-ray absorbing column densities, the EWs of Fe K line and
the flux ratios of X-ray to [OIII] 5007Å for
the Seyfert type 1s and type 2s. In other words, using 0.5 - 10 keV XMM-Newton data we test whether X-ray properties conform with
the optical classification of Seyfert type 1s and type 2s in the framework of the orientation and obscuration based unification scheme.
The important aspect of our study is the sample selection in which type 1s and type 2s are matched in
orientation-independent parameters.
A description of the sample, observations and data reduction is given in the section 2 and 3, section 4 describes the spectral modeling of X-ray spectra and the statistical comparisons of X-ray spectral properties of the two Seyfert subtypes have been discussed in section 5. Notes on individual Seyfert galaxies are given in the appendix. In this paper, we assume H0 = 71 km-1 Mpc-1, m = 0.27, and vac = 0.73.
2 The Sample
We use the sample of Lal et al. (2011) which is consist of 20 (10 type 1 and 10 type 2) optically selected Seyfert galaxies. This sample was formulated to study the nuclear radio properties in the framework of Seyfert unification scheme and in this paper we attempt to test the predictions of Seyfert unification scheme in the X-ray regime using the same sample. Although, the sample was formulated to study parsec-scale radio emission and is constrained by VLBI observing feasibility criteria, it is adequately qualified to test the predictions of unification scheme in the X-ray regime since it is based on the orientation-independent parameters. In this sample Seyfert galaxies are defined as radio quiet ( 10) (Kellermann et al. 1989), low optical luminosity AGN (MB -23) (Schmidt & Green 1983), hosted in spiral or lenticular galaxies (Weedman 1977). All the intermediate subclasses Seyferts (1.0, 1.2, 1.5, 1.8, 1.9) which show any broad permitted emission line component in their optical spectra are grouped as type 1s, while those which show only narrow permitted emission lines are considered as type 2 Seyferts. The sample is selected such that the two Seyfert subtypes have matched distributions in the orientation-independent parameters of AGN and host galaxy and the sources which were deviating in matching the type 1 and type 2 distributions of the orientation-independent parameters were left out. In other words, the sources should lie within the same range of values for a given parameter to enter into the sample. Also, it was ensured that in a given bin of a parameter distribution type 1s do not outnumber the type 2s and vice-versa. Indeed, there is a possibility to increase the sample size following the same sample selection criteria, however, we would like to emphasize that the more important is the sample selection criteria and not the sample size to rigorously test the predictions of the unification scheme. Larger but heterogeneous and biased sample is likely to result incorrect conclusions.
Cosmological redshift, [OIII] 5007Å line luminosity, Hubble stage of the host galaxy, absolute stellar magnitude of the host galaxy and absolute magnitude of the bulge are considered as the orientation-independent properties for the sample selection. These properties do not depend on the orientation of the obscuring torus, AGN axis and the host galaxy. And, indeed all these properties are intimately linked to the evolution of AGN as well as host galaxy. We refer reader to see Lal et al. (2011) for the detailed description on the sample selection and on the matching of the distributions of the orientation-independent parameters for the two Seyfert subtypes. The matching of type 1s and type 2s in orientation-independent isotropic parameters ensures that we are not comparing entirely intrinsically different sources selected from different parts of the (luminosity, bulge mass, Hubble type, redshift) evolution function.
| Source | Obs. | Obs. | Obs. | Net expo. | ct/s | Obs. ID | RS |
|---|---|---|---|---|---|---|---|
| name | mode/filter | date | time (ks) | time (ks) | (arcsec) | ||
| MCG+8-11-11 | SW/Medium | 2004-04-10 | 38.45 | 25.24 | 14.93 | 0201930201 | 35.0 |
| MRK 1218 | SW/Thin | 2005-04-09 | 13.87 | 6.55 | 0.53 | 0302260201 | 20.0 |
| NGC 2639 | FW/Thin | 2005-04-03 | 26.12 | 4.23 | 0.24 | 0301651101 | 16.0 |
| NGC 4151 | SW/Medium | 2006-11-29 | 52.81 | 24.60 | 9.57 | 0402660201 | 40.0 |
| MRK 766 | SW/Medium | 2005-05-24 | 95.51 | 60.12 | 4.92 | 0304030101 | 40.0 |
| MRK 231 | FW/ Medium | 2001-06-07 | 22.34 | 17.30 | 0.10 | 0081340201 | 30.0 |
| ARK 564 | SW/Medium | 2005-01-06 | 101.77 | 69.07 | 39.67 | 0206400101 | 35.0 |
| NGC 7469 | SW/Medium | 2004-12-03 | 79.11 | 54.95 | 21.59 | 0207090201 | 37.5 |
| MRK 926 | SW/Thin | 2000-12-01 | 11.76 | 7.19 | 18.33 | 0109130701 | 37.5 |
| MRK 530 | SW/Thick | 2006-06-14 | 16.82 | 11.42 | 12.93 | 0305600601 | 20.0 |
| MRK 348 | FW/Medium | 2002-07-18 | 49.50 | 26.54 | 1.96 | 0067540201 | 22.5 |
| MRK 1 | FW/Thin | 2004-01-09 | 11.91 | 8.66 | 0.07 | 0200430301 | 17.5 |
| NGC 2273 | FW/Medium | 2003-09-05 | 13.02 | 5.21 | 0.08 | 0140951001 | 20.0 |
| MRK 78 | FW/Thin | 2006-03-11 | 16.12 | 4.83 | 0.09 | 0307001501 | 22.5 |
| NGC 7212 | FW/Thin | 2004-05-20 | 14.22 | 10.50 | 0.10 | 0200430201 | 20.0 |
| MRK 533 | LW/Thick | 2004-06-02 | 10.42 | 7.51 | 0.12 | 0200660101 | 17.5 |
| NGC 7682 | FW/Thin | 2005-05-27 | 20.21 | 14.27 | 0.04 | 0301150501 | 16.0 |
Notes: SW: Small Window, FW: Full Window, LW: Large Window, RS: radius of the circular region around the source used for spectral extraction.
3 X-ray observations and data reduction
We modeled the X-ray spectra of our sample sources using XMM-Newton EPIC-pn observations obtained from XMM-Newton Science Archive. High throughput (especially, at energies E 2.0 keV) of XMM-Newton allows to search for spectral components with absorbing column density up to NH 1024 cm-2 and its good spatial resolution minimizes any strong contamination from off-nuclear X-ray emission. For our X-ray spectral study, we use only EPIC pn data and did not include EPIC MOS data since it is more susceptible to pile-up for bright X-ray sources and few sources, MRK 530 do not have MOS data. Also, EPIC pn data is good enough for our purpose of obtaining the average X-ray spectral parameters (photon index, equivalent hydrogen column density, EW of Fe K emission line) of our sample sources. In case of a source had more than one observations in archive, we chose the latest one with sufficient long exposure time. The observation log is given in table 1 and gives the details of observing modes of pn camera, used optical light blocking filters, observation dates, observation and net exposure times, count rates, observation IDs and radius (in arcsec) of the circular region around the source position used to extract the X-ray spectra. The raw observation data files (ODFs) were reduced and analyzed using the standard Science Analysis System (SAS) software package (version 7.1) with the latest calibration files. The time intervals of high energy background particle flares were removed by applying fixed threshold on single events, using E 10.0 keV, and t = 50 sec light curves. The background is extracted from a circular region in the same chip. In order to apply statistics the spectra were binned with minimum 20 counts per bin.
We present the X-ray spectra of 17 (10 type 1s and 7 type 2s) out of 20 Seyfert galaxies of the sample using XMM-Newton pn archival data. For 6 Seyfert galaxies, MRK 1218, NGC 2639, MRK 530, MRK 78, MRK 533 and NGC 7682, the XMM-Newton X-ray spectra are presented for the first time and for two Seyferts, NGC 4151 and NGC 7469, the XMM-Newton archival data chosen by us have not been published. The XMM-Newton spectra of rest of the 9 sources have been individually published, however, to have uniform reduction and analysis, we re-do the X-ray spectral fitting of these sources using data reduced with most updated calibration files. Also, a priori we do not rule out the possibility of obtaining the different or better fits for these 9 sources and therefore we prefer to re-do the spectral analysis for these sources. For 3 (type 2) Seyfert galaxies of our sample, NGC 5135, MRK 477 and NGC 5929, there are no XMM-Newton data and we are using Chandra and ASCA spectral parameters for these sources from literature while performing the statistical comparison of the X-ray properties of the two subtypes of Seyferts.
4 X-ray spectral analysis
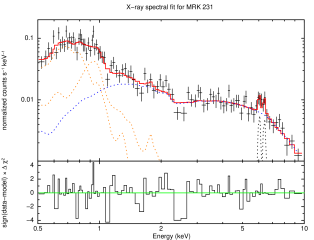
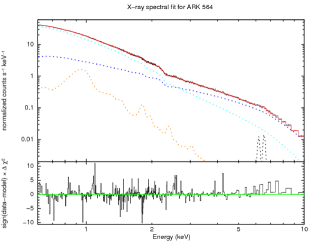
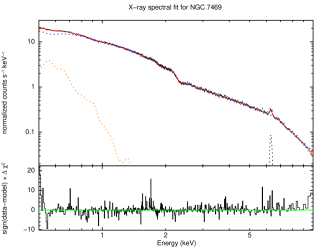
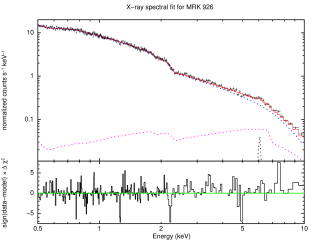
We attempt to obtain the physically motivated best fits for the 0.5 - 10.0 keV XMM-Newton pn X-ray spectra of our sample Seyfert galaxies. Since the primary aim of spectral analysis is to identify the underlying continuum components, we first tried to fit each spectrum with a simplest model consists of a power-law plus absorption fixed at the Galactic value plus intrinsic absorption as a free parameter. However, in most of the cases this simple parametrization is insufficient to model the whole spectrum and residuals often show a soft excess and an emission line feature at 6.4 keV on top of the (absorbed or unabsorbed) power-law. In most of the cases, we found the best fit model consists of a power-law with a photoelectric cutoff due to cold absorption from the Galactic column density and neutral gas at the redshift of the source; a narrow Gaussian line to reproduce the iron K fluorescent emission line at 6.4 keV in the rest frame with energy, width and intensity as free parameters; soft excess component characterized by either a steep power-law and/or a thermal plasma model with temperature kT. In some cases reflection component characterized by reflection from an isotropically illuminated cold slab (model PEXRAV (Magdziarz & Zdziarski 1995) in XSPEC (Arnaud 1996)) is required for the best fit. A partial covering of the primary power-law component is also needed for the best fit in some sources. The partial covering model is equivalent to a combination of an absorbed power-law plus a scattered power-law, assuming that the power-law slopes of these two components are same. We note that for many of our sample sources, the 0.5 - 10.0 keV X-ray spectra can approximately be modeled as “exp(-N ) [soft component + exp(-N ) (AEΓ + emission lines)]”, as suggested by Nandra & Pounds (1994); Awaki et al. (2000), where N and N are the Galactic and source column densities, respectively. Table 2 describes the best fit spectral parameters of all the sample sources and figure 1 shows the best spectral fits of 17 sample sources. Errors on the spectral fit parameters and derived quantities are at confidence level.
4.1 X-ray spectral components
In the following sections we describe the main components of the 0.5 - 10 keV spectra of our sample Seyfert galaxies.
4.1.1 Absorbed power-law
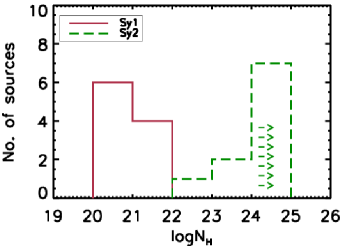
The X-ray continuum of Seyfert galaxies can primarily be characterized by a photoelectric absorbed power-law. Figure 3 shows the distributions of equivalent hydrogen column density for the two subtypes of Seyferts of our sample. The estimated column densities in Seyfert galaxies of our sample varies from Galactic value to as high as the limiting value of Compton-thick obscuration (NH 1.5 1024 cm-2). As expected in the unification scheme, Seyfert type 1s of our sample are systematically less absorbed than type 2s.
Among type 2s, many sources (MRK 1, NGC 2273, MRK 78, NGC 5135, NGC 7212, MRK 533 and NGC 7682) are heavily obscured and show only the reflection component in the 2.0 - 10 keV band. We identify these 7 type 2 Seyferts as Compton-thick sources with equivalent hydrogen column density along the line-of-sight 1.51024 cm-2 or higher and exhibiting reflection dominated spectra in the 2.0 - 10.0 keV band. The hard (2.0 - 10.0 keV) component of all the Seyfert type 1s is fitted with an absorbed power-law and our best fits render photon indices () 1.5 - 2.5 with the mean value of 2.0, while type 2s have either similar hard X-ray photon indices with high absorption or only pure reflection component. In the cases, where both direct as well as reflection components are considered, we fix the reflection component photon index equal to that of the direct power-law component. In some cases equally good fits can be obtained either using unabsorbed or less absorbed flat ( 0.5 - 1.0) power-law or with relatively more absorbed steep ( 1.8 - 2.1) power-law. In such cases we preferred the more absorbed steep power-law fit as the power-law photon index is closer to the canonical value for Seyfert galaxies (Cappi et al. 2006). We do not perform the statistical comparison of the photon indices of the two Seyfert subtypes since in many of the type 2 sources, the 2.0 - 10.0 keV hard X-ray spectrum is best fitted by pure reflection component and without the presence of any transmitted power-law component from AGN. Therefore in such reflection dominated sources we do not have the photon index of the direct power-law component.
4.1.2 Soft X-ray excess
17 among the 20 Seyferts of our sample exhibit the soft excess, emission above the extrapolation of the absorbed AGN power-law. 3 (type 1) sources, MCG+8-11-11, MRK 1218 and MRK 926 do not show any presence of the soft excess. We fit the soft excess by a thermal plasma model MEKAL (Mewe-Kaastra-Liedahl (1995)) and/or by a steep power-law. The typical temperature of the thermal plasma corresponds to kT 0.1 - 1.0 keV and the soft X-ray photon index is typically 2.5 - 3.5, however, in two cases (MRK 78, NGC 7682) the best fit photon index is as steep as 7.0 and 5.4, respectively. In some cases (NGC 4151, MRK 766 and NGC 7212), we see emission line features in 0.5 - 2.0 keV part of the spectrum, which indicates the presence of a sub-keV thermal plasma.
The origin of soft excess can be attributed to circumnuclear gas heated to million degrees by shocks induced by AGN outflows (King 2005), an intense circumnuclear star formation (Cid Fernandes et al. 1998; González Delgado et al. 2001) or the photoionization and photoexcitation of circumnuclear gas by the primary AGN emission. Recent high-resolution spectra of few sources, NGC 1068 (Young et al. 2001; Kinkhabwala et al. 2002), the Circinus galaxy (Sambruna et al. 2001), MRK 3 (Sako et al. 2000; Bianchi et al. 2005b; Pounds & Page 2005); NGC 4151 (Schurch et al. 2004) have provided evidence that the soft excess is largely due to circumnuclear gas photoionized by primary AGN emission. Using a large sample of type 1 AGNs, Mateos et al. (2010) noticed the presence soft X-ray excess in a substantial fraction of nearby sources and fitted it with a thermal plasma model with mean rest-frame temperature kT 100 eV. Mateos et al. (2010) ruled out the origin of the soft excess as thermal emission from the accretion disk or Compton scattered disk emission on the basis of the temperatures detected and the lack of correlation of the soft excess temperature with the hard X-ray luminosity.
4.1.3 Reflection component
Previous X-ray spectral studies reported that many Seyferts, in particular type 2s, show the presence of a reflection component (Awaki et al. 2000). Compton reflection of nuclear radiation from optically thick material can be an important component in Seyfert type 2s and beside absorption, a flat spectrum can result from Compton reflection component (Matt et al. 1996). In highly obscured (NH 1.5 1024 cm-2), Compton-thick sources, the primary radiation is almost completely absorbed (at E 10 keV), but these sources are still observable through the reflected radiation. There are 7 type 2 sources in our sample in which the 2.0 - 10.0 keV part of the spectrum is best fitted with reflection component alone (PEXRAV model in XSPEC; Magdziarz & Zdziarski (1995)). The large EW of Fe K line in these sources is consistent with the Compton-thick obscuration and reflection-dominated spectrum (Ghisellini et al. 1994; Levenson et al. 2006). Some type 1 sources, MCG+8-11-11, NGC 4151, MRK 766 and MRK 926 also show the presence of a reflection component at the hard end of the spectrum. This can be expected in the framework of the unification scheme since a similar obscuring material having toroidal geometry is present but the plane of the torus lies away from the line-of-sight and thus the reflection component is much fainter in compared to the direct transmitted component. Moreover, at the hard end of the spectrum (E 8.0 keV) the reflection component may have significant contribution.
4.1.4 Fe Kα and other emission lines
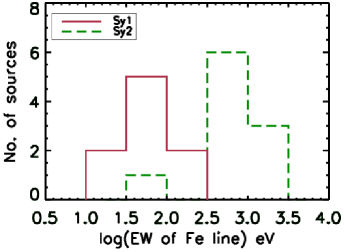
We detected fluorescent Fe K emission line at 6.4 keV in all (except NGC 2639) of our sample sources suggesting the ubiquitous presence of Fe K line in the X-ray spectra of Seyfert galaxies. In most of the sources the centroid energy of Fe K emission line is consistent with the emission from neutral or mildly ionized iron. In some sources, MRK 766, MRK 231, ARK 564, MRK 533 and NGC 7682, an emission line at 6.7 - 7.1 keV is also present, which is possibly either H or He like ionized Fe K line component or a neutral component of Fe Kβ emission line. When the absorbing column density increases to a few times of 1023 cm-2, the equivalent width of Fe K increases, since it is measured against a depressed continuum. The equivalent width can be higher than 1.0 keV for column densities of NH 1024 cm-2, and such values are indeed observed in heavily absorbed and Compton-thick sources (Maiolino et al. 1998). Figure 3 shows the distributions of EWs of Fe K line for the two subtypes of Seyferts of our sample. Seyfert type 1s have EWs 20 - 250 eV while for type 2s (except MRK 348) it ranges from 0.5 keV to 2.0 keV. High EWs of Fe K line in type 2s suggests high obscuration compared to type 1s.
Apart from the ubiquitous Fe K emission line we also notice the presence of other emission lines in some of our sample sources, mainly in the soft X-ray band. The addition of Gaussian emission line at 0.88 keV in NGC 4151 and NGC 7212 improves the fit and is likely to be associated with O VIII radiative recombination continua (Griffiths et al. 1998). High resolution spectroscopic observations show that the soft X-ray emission in NGC 4151 is dominated by X-ray emission lines and radiative recombination continua (RRC) from hydrogen-like and helium-like ionization states of neon, oxygen, nitrogen and carbon (Schurch et al. 2004). Also, in MRK 766 the addition of Gaussian emission feature at 0.5 keV improves the fit and may arise due to the blending of few narrow emission lines.
5 Comparison of the X-ray spectral properties of the two Seyfert subtypes
In this section we discuss the statistical comparison of the distributions of X-ray luminosities and spectral properties of the two subtypes of Seyferts in the framework of Seyfert unification scheme.
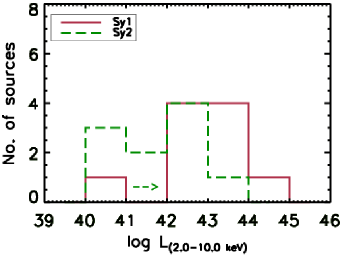
5.1 Soft (0.5 - 2.0 keV) and hard (2.0 - 10.0 keV) band X-ray luminosities
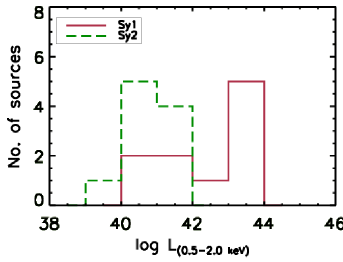
Table 5 lists the fluxes, luminosities in the soft (0.5 - 2.0 keV) as well as hard (2.0 - 10.0 keV) X-ray bands and the flux ratios of the hard X-ray to [OIII] 5007Å line emission. Figure 2 shows the X-ray luminosity distributions for the two Seyfert subtypes in the soft (0.5 - 2.0 keV) as well as hard (2.0 - 10.0 keV) X-ray bands. The observed soft X-ray luminosities for Seyfert type 1s in our sample range from 1040 erg s-1 to 1044 erg s-1 with the median value 6.58 1042 erg s-1, while for Seyfert type 2s it range from 1038 erg s-1 to 1042 erg s-1 with the median value 6.9 1040 erg s-1. The two sample Kolmogorov - Smirnov test shows that the soft (0.5 - 2.0 keV) X-ray luminosity distributions of type 1 and type 2 Seyferts are completely different, null hypothesis that two distributions are same is rejected at 99 level of significance. Seyfert type 2s have systematically lower soft X-ray luminosities than type 1s. The nearly 2 Dex difference in the medians of the soft X-ray luminosities of two Seyfert subtypes can be explained as the presence of more line-of-sight obscuration in type 2s than that in type 1s, which is expected since torus intercepts observer’s line-of-sight according to the orientation based Seyfert unification. In hard X-ray (2.0 - 10.0 keV) band, Seyfert 1s of our sample have luminosities ranging from 1040 erg s-1 to 1045 erg s-1 with the median value 1.1 1043 erg s-1, while for Seyfert 2s it range from 1040 erg s-1 to 1044 erg s-1 with the median value 6.8 1041 erg s-1. The difference in the hard X-ray luminosity distributions of the two Seyfert subtypes is lower compared to the soft band and can be explained as hard X-ray (2.0 - 10.0 keV) photons suffer less absorption. According to the unification model, at sufficiently high energy one can expect similar X-ray luminosities for the two Seyfert subtypes as the torus optical thickness decreases with the increase in photon energy and similar central engines are at work in both subtypes. The substantial difference in the hard X-ray (2.0 - 10.0 keV) luminosity distributions of the two Seyfert subtypes can be understood as due to high absorption in type 2s. We have several heavily obscured (Compton-thick) type 2 sources in our sample in which X-ray continuum below 10.0 keV is completely suppressed and dominated by reprocessed components.
5.2 Line-of-sight obscuration
The cold matter present in between observer and the AGN (consisting of the Galactic and the material at the redshift of AGN) preferentially absorbs soft X-ray from AGN. The photoelectric absorption component in the X-ray spectral modeling renders the amount of absorption along the line-of-sight in terms of the equivalent hydrogen column density, as long as direct transmitted component is seen. In general, we fit the X-ray continuum with a photoelectric absorbed power-law keeping column density and power-law photon index as free parameters and also all the spectral components are at least absorbed by the Galactic equivalent hydrogen column density. Figure shows the distributions of cumulative NH for the two Seyfert subtypes. The estimated absorbing equivalent hydrogen column densities for our sample sources varies from as low as to Galactic value (NH 1020 cm-2) to as high as to the Compton-thick value (NH 1024 cm-2). For type 1s the equivalent NH ranges from 1020 cm-2 (Galactic value) to 1022 cm-2 with median value 1021 cm-2, while for type 2s it ranges from 1022 cm-2 to 1024 cm-2 with median value 1024 cm-2. We have 7/10 reflection dominated type 2 sources in which the 2.0 - 10.0 keV hard component is accounted by pure reflection component (PEXRAV model) and therefore we do have only upper limit of NH values ( 1.5 1024) in such cases. Seyfert type 2s have systematically higher absorbing column densities than types 1s and the distributions of the absorbing column densities (NH) are consistent with the orientation based unification scheme. In our small sample we do not find any unobscured type 2 Seyfert, although some previous studies reported the presence of 10 - 30 of unobscured type 2 Seyferts (Panessa & Bassani 2002). While comparing the amount of obscuration for the two Seyfert subtypes we consider only cold absorption accounted by the photoelectric absorption component. In several sources we require partial covering of primary AGN radiation. The best fit values of covering fraction and absorbing equivalent hydrogen column density are mentioned in table 3. In four Seyfert type 1s, MRK 1218, NGC 4151, MRK 766 and NGC 7469, warm absorption characterized by the ABSORI model (ionized absorber) is needed for the best fit. While using the ABSORI model we fixed the photon index of the power-law of the absori component equal to the photon index of the primary power-law component and the temperature was fixed to 3104 K. The best fit parameter values for NH and ionization parameters () are mentioned in table 4. The ionization parameter indicates the ionization state of absorbing material and is defined as = , where L is the source luminosity (in 13.6 eV - 13.6 keV), n is the absorbing gas density and r is the distance of absorber from the ionizing source (see; Osterbrock & Ferland (2006)). The estimated ionization parameter reveals low ionizing material in MRK 1218, NGC 4151 and MRK 766, however, in NGC 7469, the ionization level is high. Using XMM-Newton RGS data, Blustin et al. (2007) reported that NGC 7469 shows the evidence of ionized outflowing material with a wide range of ionization (log 0.5 - 3.5).
| Source | Model | Soft X-ray Continuum | Hard X-ray Continuum | Emission Lines | /dof | |||||
|---|---|---|---|---|---|---|---|---|---|---|
| NH | kT | NH,hard | Ec,rest | Iline | EW | |||||
| (1020 cm-2) | (keV) | (1022 cm-2) | (keV) | (eV) | ||||||
| MCG+8-11-11 | pha(PL+R+L) | 18.30 | 1.84 | 6.44 | 4.95 | 97.9 | 0.99 | |||
| MRK 1218 | pha(abs*PL+L) | 15.20 | 1.48 | 6.32 | 0.19 | 63.9 | 0.99 | |||
| NGC 2639 | pha(T+PL) | 16.20 | 0.63 | 2.21 | 0.82 | |||||
| NGC 4151 | pha(T+PL+pha*abs*pcf*PL+R+L+L) | 6.33 | 3.14 | 0.13 | 0.12 | 1.75 | 6.39 | 14.43 | 108.4 | 1.12 |
| 0.88 | 1.12 | 60.1 | ||||||||
| MRK 766 | pha(T+abs*pcf*PL+R+L+L+L) | 1.35f | 0.20 | 2.17 | 6.44 | 0.50 | 47.9 | 1.09 | ||
| 6.67 | 0.22 | 19.3 | ||||||||
| 0.48 | 5.38 | 137.3 | ||||||||
| MRK 231 | pha(T+T+pcf*pha*PL+L+L) | 1.25f | 0.33 | 0.46 | 1.57 | 6.28 | 0.16 | 215.0 | 1.04 | |
| 0.99 | 6.66 | 0.15 | 243.5 | |||||||
| ARK 564 | pha(T+PL+pcf*PL+L+L) | 6.38f | 3.42 | 0.97 | 2.32 | 6.33 | 0.29 | 20.9 | 1.09 | |
| 6.71 | 0.41 | 32.3 | ||||||||
| NGC 7469 | pha(T+abs*pcf*PL+L) | 4.96f | 0.18 | 2.04 | 6.41 | 2.03 | 64.2 | 1.09 | ||
| MRK 926 | pha(pcf*PL+R+L) | 3.59f | 1.98 | 6.33 | 1.24 | 29.1 | 0.96 | |||
| MRK 530 | pha(T+pcf*PL+L) | 4.06f | 0.20 | 2.28 | 6.40 | 1.49 | 47.2 | 1.09 | ||
| MRK 348 | pha(PL+pha*pcf*PL+L) | 5.91f | 2.75 | 6.86 | 1.70 | 6.40 | 1.59 | 34.2 | 1.05 | |
| MRK 1 | pha(T+PL+R+L) | 5.31f | 2.55 | 0.82 | 150 | 2.0fR | 6.77 | 0.01 | 1249.2 | 0.99 |
| NGC 2273 | pha(PL+R+L) | 7.75 | 2.79 | 150 | 0.67R | 6.40 | 2.74 | 2189.2 | 0.97 | |
| MRK 78 | pha(PL+R+L) | 65.38 | 7.05 | 150 | 1.01R | 6.37 | 0.56 | 673.0 | 0.85 | |
| NGC 5135g | pha(T+T+pha*PL+L) | 4.58f | 0.08 | 150 | 1.5 | 6.40 | 0.52 | 1700.0 | …. | |
| 0.39 | 1.78 | …. | …. | |||||||
| MRK 477l | pha(pha*PL+L) | 1.30f | 24.0 | 1.9f | 6.40 | …. | 560.0 | 0.35 | ||
| NGC 5929c | pha(PL+pha*PL+L) | 51.60 | 1.7 | 27.7 | 1.7 | 6.40 | …. | 350.0 | …. | |
| NGC 7212 | pha(PL+R+L+L) | 5.41f | 2.32 | 150 | 0.99R | 6.42 | 0.74 | 712.3 | 1.15 | |
| 0.89 | 0.04 | 59.6 | ||||||||
| MRK 533 | pha(T+PL+R+L+L) | 5.16f | 3.75 | 0.76 | 150 | 2.12R | 6.40 | 0.55 | 557.2 | 0.97 |
| 7.04 | 0.53 | 665.6 | ||||||||
| NGC 7682 | pha(T+R+L+L) | 34.88 | 5.36 | 150 | 1.77R | 6.43 | 0.20 | 477.5 | 0.81 | |
| 7.11 | 0.13 | 457.6 | ||||||||
f: fixed; s: soft component; pha: photoelectric absorption; PL: power-law;
L: Emission line fitted with a Gaussian; T: Thermal emission from hot gas (MEKAL model in XSPEC);
abs: Ionized absorber (ABSORI model in XSPEC); R: Reflection from cold neutral material (PEXRAV model in XSPEC);
pcf: partial covering.
: Guainazzi et al. (2005a); : Levenson et al. (2001); : Cardamone et al. (2007);
emission line fluxes (Iline) are in units of 10-13 ergs cm-2 s-1.
| Source | NH | Covering |
|---|---|---|
| Name | (1022 cm-2) | fraction (f) |
| NGC 4151 | 9.06 | 0.69 |
| MRK 766 | 6.42 | 0.51 |
| MRK 231 | 8.35 | 0.74 |
| ARK 564 | 3.09 | 0.61 |
| NGC 7469 | 35.55 | 0.28 |
| MRK 926 | 4.35 | 0.15 |
| MRK 530 | 14.81 | 0.27 |
| MRK 348 | 10.47 | 0.84 |
| Source | NH | Ionization |
|---|---|---|
| Name | (1022 cm-2) | parameter () |
| MRK 1218 | 0.63 | 39.60 |
| NGC 4151 | 5.08 | 0.31 |
| MRK 766 | 0.21 | 6.61 |
| NGC 7469 | 1.06 | 1193.19 |


| Name | F | log L | F | log L | F | Ref. | Hα/Hβ | Ref. | F | logRx |
|---|---|---|---|---|---|---|---|---|---|---|
| MCG+8-11-11 | 161.18 | 43.35 | 441.97 | 43.79 | 6.43 | 1 | 4.37 | 7 | 19.43 | 1.36 |
| MRK 1218 | 4.86 | 41.96 | 25.35 | 42.68 | 1.70 | 2 | 3.26 | 8 | 2.17 | 1.07 |
| NGC 2639 | 1.26 | 40.52 | 0.75 | 40.29 | 1.07 | 3 | 4.16 | 9 | 2.79 | -0.57 |
| NGC 4151 | 29.49 | 40.75 | 828.83 | 42.20 | 116.00 | 4 | 3.1 | 7 | 127.74 | 0.81 |
| MRK 766 | 33.99 | 42.10 | 72.66 | 42.43 | 3.95 | 1 | 5.1 | 7 | 18.79 | 0.59 |
| MRK 231 | 0.99 | 41.60 | 6.06 | 42.38 | 2.30 | 2 | … | … | … | 0.42 |
| ARK 564 | 364.22 | 43.67 | 162.25 | 43.31 | 1.90 | 4 | … | … | … | 1.93 |
| NGC 7469 | 213.27 | 43.08 | 293.41 | 43.21 | 5.80 | 4 | 9.33 | 7 | 162.98 | 0.26 |
| MRK 926 | 171.95 | 43.94 | 299.05 | 44.18 | 3.50 | 4 | … | … | … | 1.93 |
| MRK 530 | 166.48 | 43.52 | 182.74 | 43.56 | 0.48 | 4 | … | … | … | 2.58 |
| MRK 348 | 1.17 | 40.76 | 269.39 | 43.12 | 4.12 | 1 | 6.02 | 7 | 31.93 | 0.93 |
| MRK 1 | 0.98 | 40.74 | 0.81 | 40.66 | 6.00 | 4 | 5.89 | 7 | 43.61 | -1.73 |
| NGC 2273 | 0.53 | 39.62 | 10.02 | 40.89 | 1.60 | 5 | 6.92 | 7 | 18.68 | -0.27 |
| MRK 78 | 0.79 | 41.39 | 5.52 | 42.23 | 6.60 | 4 | 6.46 | 7 | 62.93 | -1.06 |
| NGC 5135g | 1.90 | 40.91 | 1.60 | 40.83 | 3.70 | 6 | 7.8 | 9 | 61.66 | -1.59 |
| MRK 477l | 1.20 | 41.59 | 12.0 | 42.59 | 15.00 | 4 | 5.4 | 7 | 84.45 | -0.85 |
| NGC 5929c | 0.81 | 40.15 | 14.0 | 41.39 | 0.93 | 4 | 5.5 | 7 | 5.53 | 0.40 |
| NGC 7212 | 0.83 | 41.13 | 6.96 | 42.05 | 8.75 | 1 | 5.01 | 7 | 39.52 | -0.75 |
| MRK 533 | 1.42 | 41.42 | 6.08 | 42.06 | 5.21 | 1 | 5.0 | 7 | 23.39 | -0.59 |
| NGC 7682 | 0.27 | 40.22 | 2.62 | 41.22 | 2.30 | 4 | 4.8 | 7 | 9.16 | -0.54 |
Notes: [OIII] and X-ray fluxes are in unit of 10-13 erg cm-2 s-1. Rx: ; : Guainazzi et al. (2005a); : Levenson et al. (2001); : Cardamone et al. (2007). Ref., 1: Schmitt et al. (2003), 2: Dahari & De Robertis (1988), 3: Panessa et al. (2006), 4: Whittle (1992), 5: Ferruit et al. (2000), 6: Polletta et al. (1996), 7: Mulchaey et al. (1994), 8: Dahari & De Robertis (1988), 9: Bassani et al. (1999).
| Distribution | Median | D | p-value | |
|---|---|---|---|---|
| Type 1s | Type 2s | |||
| log L | 42.82 | 40.84 | 0.8 | 2.06 10-3 |
| log L | 43.02 | 41.83 | 0.6 | 5.25 10-2 |
| log NH | 21.02 | 24.18 | 1.0 | 9.08 10-5 |
| log EW (eV) | 1.81 | 2.79 | 0.9 | 9.30 10-4 |
| log Rx | 0.96 | -0.66 | 0.7 | 1.48 10-2 |
Kolmogorov - Smirnov two sample test examines the hypothesis that two samples comes from same distribution. D = Sup x S1(x) - S2(x) is the maximum difference between the cumulative distributions of two samples S1(x) and S2(x), respectively. p-value is the probability that the null hypothesis, two samples comes from same distribution, is correct. Rx = .
5.3 Equivalent width of Fe K line
We detect fluorescent Fe K emission line in all but one (NGC 2639) of our sample sources suggesting the ubiquitous presence of Fe K line in the X-ray spectra of Seyfert galaxies. In NGC 2639, due to lack of enough counts above 2.0 keV we could not confirm the presence of Fe K emission line. However, using ASCA observations of NGC 2639, Terashima et al. (2002) reported the presence of Fe K line with EW 1.5 - 3.0 keV. We estimate the EW of Fe K line with respect to the modeled continuum and find that Seyfert type 2s have systematically larger EWs ( 350 eV to 2.2 keV, except of MRK 348), with median value 600 eV than that of type 1s ( 20 - 200 eV) with median value 64.0 eV. Kolmogorov - Smirnov two sample test shows that the distributions of EWs of Fe K line of the two Seyfert subtypes are completely different (table 6). Heavily obscured, Compton-thick sources are characterized by large EW of Fe K line (Krolik et al. 1994; Levenson et al. 2006) and therefore we use the large EW ( 1.0 keV) of Fe K line as an indicator of heavy obscuration as it is measured against much depressed continuum (NH 1023 - 1024 cm-2; Leahy & Creighton (1993)) or against pure reflection component (NH 1024 - 1025; Bassani et al. (1999)). However, identifying a source as the Compton-thick only on the basis of large EW of Fe K line may not be correct, since a large EW can arise if the ionizing radiation is anisotropic (Ghisellini et al. 1991), or if there is a lag between a drop in the continuum and line emissions, as observed in NGC 2992 by Weaver et al. (1996).
5.4 Flux ratio of hard X-ray to [OIII] 5007Å
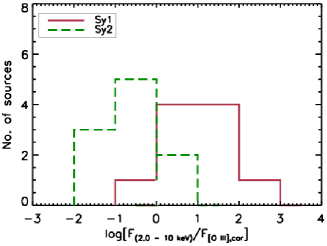
In order to confirm the high obscuration in Seyfert type 2s than in type 1s we use the flux ratio of hard (2.0 - 10.0 keV) X-ray to [OIII] 5007Å and the equivalent width of Fe K line as diagnostic tools. Bassani et al. (1999) reported that the flux ratio of hard X-ray to [OIII] 5007Å can effectively be used in identifying Compton-thin and Compton-thick sources with latter having flux ratio 1. The flux ratio of hard X-ray to [OIII] 5007Å can be used as an indicator of the amount of obscuration since [OIII] originates from the NLR region largely unaffected by the torus obscuration and can be considered as the proxy of the intrinsic AGN power since it is produced by photoionization of NLR clouds by the AGN continuum (Yee et al. 1981; Nelson & Whittle 1995). While estimating the flux ratio of hard X-ray to [OIII] 5007Å, the latter ones are corrected for the optical reddening whenever Balmer decrement value was available for a source in literature. We have Balmer decrement (Hα/Hβ) values and hence, optical reddening corrected [OIII] fluxes for only 16 (6 type 1s and 10 type 2s) sources of our sample. For reddening correction we use the formula given in Bassani et al. (1999), F[OIII],cor = F[OIII],obs[(Hα/Hβ)/]2.94, where intrinsic Balmer decrement is assumed 3.0, and only narrow components of Hα, Hβ are considered.
The statistical comparison of the distributions of the flux ratios of hard X-ray (2.0 - 10.0 keV) to [OIII] for the two Seyfert subtypes again confirms the systematically higher obscuration is type 2s than type 1s (table 6, figure 3). Also, using this flux ratio as an indicator we note that MRK 1, MRK 78, NGC 5135, MRK 477, NGC 7212, MRK 533 and NGC 7682 have Compton-thick obscuration. X-ray spectral properties, reflection dominated hard X-ray component, low hard X-ray to [OIII] flux ratio and high EW of Fe K line implies that 7 - 8 out of 10 type 2 sources of our sample are Compton-thick (NH 1.5 1024 cm-2). Some of our sample sources, MRK 477 (Bassani et al. 1999), NGC 5135, NGC 7212 (Levenson et al. 2006), NGC 2273 (Awaki et al. 2009) and MRK 533 (Bianchi et al. 2005a) have already been reported as Compton-thick. In our sample we have only one Seyfert subtype 1.8 (MRK 1218) and one subtype 1.9 (NGC 2639) which are included into type 1s and thus even if we include subtypes 1.8, 1.9 into type 2s, the relative fraction of Compton-thick sources remains high 60 (7-8 source out of 12 type 2s).
6 Conclusions
We investigated the 0.5 - 10 keV X-ray spectral properties of a sample of 20 Seyfert galaxies in which the two Seyfert subtypes have matched distributions in orientation independent parameters. we summarize the conclusions of our study as below.
-
X-ray spectra of our sample Seyfert galaxies, in general, are best fitted with a model consists of : a power-law with a photoelectric cutoff due to the cold absorption from the Galactic column density and neutral gas at the redshift of the AGN; a narrow Gaussian fitted to the Fe K fluorescent emission line at 6.4 keV; often seen soft excess component characterized by either a steep power-law and/or a thermal plasma model with temperature kT 0.1 - 1.0 keV.
-
In several of the heavily obscured type 2 sources, X-ray spectra are completely dominated by reflection component and the hard part of spectra can be characterized with the PEXRAV model and a prominent Fe K line.
-
Seyfert type 1s have systematically higher observed soft X-ray luminosities than type 2s, as would be expected in the unification scheme with the hypothesis that in type 2s obscuring torus intercepts the AGN view and therefore absorbs the soft X-ray photons emanating from the AGN. The distributions of the observed hard (2.0 - 10 keV) X-ray luminosities of the two subtypes differ much less significantly, consistent with the prediction of unification, as optical thickness of obscuring material decreases with the increase in X-ray photons energy.
-
The X-ray absorbing column density for Seyfert type 1s in our sample ranges from 1020 cm-2 (Galactic value) to 1022 cm-2 with median value 1021 cm-2, while for type 2s it ranges from 1022 cm-2 to Compton-thick limiting value 1024 cm-2 with median value 1024 cm-2. The distribution of X-ray absorbing column densities (NH) for Seyfert galaxies of our sample is broadly consistent with the previous studies (Cappi et al. (2006); Akylas & Georgantopoulos (2009)).
-
Fe K fluorescent emission line has been detected in all (except one) of our sample sources suggesting the ubiquitous presence of Fe K line in the X-ray spectra of Seyfert galaxies. The centroid energy 6.4 keV of the line is consistent with the emission from neutral or mildly ionized iron. The equivalent width of Fe K line in type 2s ranges 350 eV to 2.2 keV and is systematically higher than that of 1s ( 20 - 200 eV).
-
The statistical comparison of X-ray spectral properties, the X-ray absorbing column densities, the hard X-ray spectral shape (absorbed power-law versus reflection dominated), the EWs of Fe K line, the flux ratios of hard X-ray to [OIII] 5007Å, and the luminosity distributions in soft and hard X-ray bands for the two subtypes of Seyfert galaxies are consistent with the orientation and obscuration based Seyfert unification scheme.
-
We have argued for the importance of sample selection in testing the Seyfert unification scheme. And, using a sample based on the properties independent to the orientation of the obscuring torus, AGN and host galaxy, we show that the 0.5 - 10 keV X-ray spectral properties are consistent with the unification scheme.
-
We also note a high fraction 70 of heavily absorbed likely to be Compton-thick sources among the type 2 Seyfert population. This high fraction is in agreement with the previous study reported by Risaliti et al. (1999) based on a [OIII] 5007Å luminosity selected sample of Seyfert 2s and implies that an unbiased sample is essential to estimate the accurate relative fraction of the heavily absorbed, Compton-thick AGNs. Also, the heavily obscured AGNs may in part responsible for to account missing sources contributing to the Cosmic X-ray background (Worsley et al. 2005; Gilli et al. 2007).
Acknowledgements.
This work is based on observations obtained with XMM-Newton, an ESA science mission with instruments and contributions directly funded by ESA Member States and the USA (NASA). Also, this research has made use of the NASA/IPAC Extragalactic Database (NED) which is operated by the Jet Propulsion Laboratory, California Institute of Technology, under contract with the National Aeronautics and Space Administration. Authors thank to anonymous referee for useful comments and suggestions to improve the manuscript.Appendix A Notes on individual sources
In this section we describe the X-ray spectral properties of individual sources of our sample and the comparison of their X-ray spectral properties with the previous studies.
MCG+8-11-11
MCG+8-11-11 has been observed by all the major X-ray satellites, with the exception of Chandra. The ASCA (Grandi et al. 1998) and BeppoSAX (Perola et al. 2000) data were well fitted by a fairly standard model composed of a power-law, a warm absorber, a Compton reflection component, and an Fe K line. Matt et al. (2006) fitted the XMM-Newton EPIC pn spectrum with a model composed of an absorbed power-law (NH 1.83 1021 cm-2, 1.8050.015), a Compton reflection component (with the inclination angle kept fixed to 30∘), a Gaussian Fe K line (EW 7515 eV), warm absorption (NH,warm 1.1 1022 cm-2) with the temperature of the material fixed at K and an absorption edge at 0.74 keV, corresponding to He-like oxygen. Our best fit spectral parameters are broadly consistent with Matt et al. (2006), although we get a good fit without using warm absorption. We also confirm the absence of a soft excess in this source using the XMM-Newton EPIC pn data.
MRK 1218
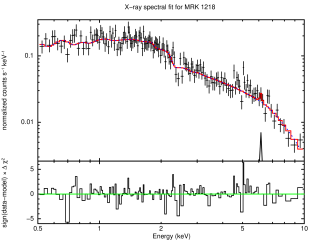
MRK 1218 does not have Chandra and ASCA observations but has been detected by RoSAT. We present the XMM-Newton spectrum of MRK 1218 for the first time. We find that an absorbed power-law (NH 1.52 1021 cm-2, 1.48), with warm absorption (NH,warm 0.63 1022 cm-2) having plasma temperature fixed at 3 104 K and an Fe K line of EW 63.9 eV gives the best fit.
NGC 2639
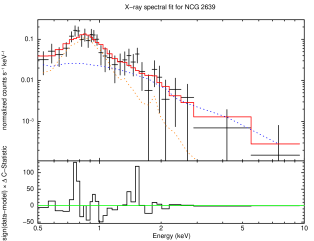
Terashima et al. (2002) fitted the ASCA spectrum of NGC 2639 by a partially covered power-law (with NH,1 0.08 ( 0.32) 1022 cm-2 , NH,2 32 1022 cm-2, covering fraction 0.89, 2.8 and /dof 45.8/49). They also attempted a model consisting of an absorbed power-law plus a Raymond-Smith (Raymond & Smith 1977) thermal plasma modified by the Galactic absorption. The best fit parameters reported by Terashima et al. (2002) using this model are NH,1 0.027 1022 cm-2 (fixed), kT 0.80, abundances fixed to 0.5 of solar, NH,2 0.0 ( 0.31) 1022 cm-2, 1.92 and /dof 45.6/49. The reported equivalent widths of Fe K for these two models are 1.49 keV and 3.13 keV, respectively. We present XMM-Newton X-ray spectrum of NGC 2639 first time and find that the best fit consists of an absorbed power-law (NH 1.62 1021 cm-2, 2.21) plus a soft component modeled with a thermal plasma (MEKAL in XSPEC) of temperature kT 0.63. We do not detect Fe K line in the XMM-Newton pn spectrum probably due to lack of sufficient counts above 2.0 keV.
NGC 4151
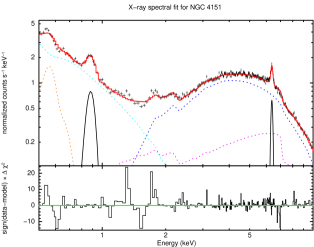
NGC 4151 is one of the most extensively studied Seyfert galaxies in nearly all wavelengths. The ASCA and BeppoSAX X-ray spectra were fitted with a flat absorbed power-law ( 1.65), a contribution from a cold reflector and a two-component absorber, an intrinsic neutral component with NH 3.4 1022 cm-2 and a highly ionized absorber with NH 2.4 1023 cm-2 (Schurch & Warwick 2002; Piro et al. 2005). Yang et al. (2001) reported the Chandra ACIS observation of NGC 4151 with notable extended soft X-ray emission on a scale of several hundred parsecs and a spatially unresolved hard X-ray ( 2.0 keV) component. The spectrum of the unresolved nuclear source is described by a heavily absorbed (NH 1022 cm-2), hard power-law ( 0.3) plus soft emission from either a power-law ( 2.6) or a thermal (kT 0.6 keV) component. We fitted the XMM-Newton pn spectrum with a model consisting of a soft component characterized with a power-law plus thermal plasma model with a temperature of kT 0.13 keV and an emission line at 0.88 keV; a hard component characterized with an absorbed power-law (NH 1.8 1021 cm-2, 1.75), with warm absorption (NH 5.2 1022 cm-2) and partial covering (NH 9.06 1022 cm-2, covering fraction f 0.69) plus a reflection component and an Fe K emission line at 6.4 keV. The Fe K line is fitted with a narrow Gaussian component with an EW 108.4 eV.
MRK 766
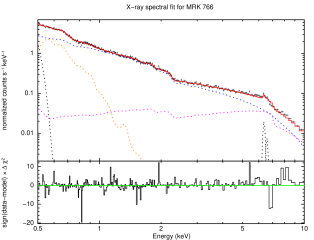
RoSAT and ASCA observations showed that the X-ray spectrum of MRK 766 can be described by a power-law of index 1.6 - 2.0 (increasing strongly with flux), a reflection component and a narrow Fe K emission line (EW 100 eV) (Leighly et al. 1996). Later observations with BeppoSAX found a steeper power-law () and evidence for an absorption edge at 7.4 keV (Matt et al. 2000b). Using XMM-Newton observations Miller et al. (2006) reported the variations in the flux of Fe K line on short time scales (5 - 20 ks) and its strong correlation with the continuum emission. We fitted the XMM-Newton pn X-ray spectrum of MRK 766 with a less absorbed fairly steep power-law ( 2.17, NH fixed to Galactic value) with partial covering (NH 6.42 1022 cm-2, covering fraction f 0.51) and warm absorption (NH 2.1 1021 cm-2), a reflection component at the hard end, a soft component fitted with a thermal plasma model of temperature kT 0.2 keV and narrow Gaussian emission lines at 0.48 keV, 6.44 keV and 6.67 keV. The Fe K emission may have broad component but we get a better fit with a narrow emission line with centroid energy at 6.44 keV and a second narrow line at 6.67 keV. The latter line could be Fe K from highly ionized (Fe XXV) material or a Kβ line from neutral matter.
MRK 231
X-ray observations by ROSAT, ASCA (Turner 1999; Iwasawa 1999; Maloney & Reynolds 2000) and more recently Chandra (Gallagher et al. 2002; Ptak et al. 2003), have revealed the presence of extended soft X-ray emission of thermal origin that is likely to be associated with the circumnuclear starburst, and a hard and flat ( 0.7) power-law component as well as an Fe Kα emission line with EW 300 eV (the line was detected by ASCA but not by Chandra). From combined XMM-Newton and BeppoSAX observations of MRK 231, Braito et al. (2004) found a highly absorbed (NH 2 1024 cm-2) AGN component. We obtain the best fit with an absorbed power-law (NH 4.6 1021 cm-2, 1.57) accompanied by a partial covering (NH 8.35 1022 cm-2, covering fraction f 0.74), a soft component fitted with two thermal plasma models with temperatures kT 0.33 keV and 0.99 keV, and narrow emission lines at 6.28 keV and 6.66 keV. The soft X-ray component may have significant contribution from starburst activity (Braito et al. 2004).
ARK 564
Vignali et al. (2004) analyzed two sets of XMM-Newton observations of ARK 564 taken a year apart (2000 June and 2001 June) and fitted the 0.6 - 10.0 keV continuum by a soft blackbody component (kT 140 - 150 eV), a steep power-law ( 2.502.55) and an absorption edge at a rest-frame energy of 0.73 keV, corresponding to O VII. No significant spectral changes were observed between the two observations, although the X-ray flux in the second observation is 40 - 50 lower. We obtain the best fit to the 0.6 - 10.0 keV XMM-Newton pn spectrum by a less absorbed steep power-law ( 2.32, NH fixed to the Galactic value) with partial covering (NH 3.09 1022 cm-2, covering fraction f 0.61), a soft component fitted with a steep power-law ( 3.42), a thermal plasma model with temperature kT 0.97 keV and narrow emission lines at 6.33 keV and 6.71 keV. While fitting we excluded the 0.5 - 0.6 keV part of the spectrum since these data are of poor quality and make it difficult to obtain even a reasonably good fit.
NGC 7469
Blustin et al. (2003) fitted the 0.2 - 10.0 keV XMM-Newton EPIC pn spectrum with a combination of a Galactic absorbed power-law (), two blackbody models and a narrow Fe K emission line. They noted significant residuals at low energies for which they suggested an instrumental origin. We fitted the 0.5 - 10.0 XMM-Newton pn spectrum with a less absorbed power-law ( 2.04, NH fixed to Galactic value), a partial covering (NH 35.55 1022 cm-2, covering fraction f 0.28), a soft component fitted with a thermal plasma model of temperature kT 0.18 keV and a narrow Gaussian fitted to the Fe K line. Using ASCA observations, Reynolds (1997) had reported both narrow and broad components to the Fe line, which was supported by De Rosa et al. (2002) using BeppoSAX data, and Nandra et al. (1997) suggested that it was relativistically broadened. We fit the Fe K line with a narrow Gaussian component, however, and the data do not need a broad component for a good fit, consistent with Blustin et al. (2003).
MRK 926
Bianchi et al. (2004) fitted the combined 2.5 - 220 keV XMM-Newton and BeppoSAX spectrum with a baseline model consisting of a power-law ( 1.72) with intrinsic absorption over and above Galactic, a reflection component and a Gaussian to reproduce the Fe K line (EW 45 eV). They also reported an upper limit to the Fe Kβ flux of the order of the K flux, and suggested the possibility of significant contribution from an Fe XXVI line. Weaver et al. (2001) reported strong line variability, both in centroid and in flux, between three ASCA observations. We fitted the 0.5 - 10.0 keV XMM-Newton spectrum with an absorbed partially covered power-law ( 1.98, NH fixed to Galactic value, Npart,H 4.35 1022 cm-2, covering fraction f 0.15), a reflection component and a narrow Gaussian to fit the Fe K line. Notably we do not see any soft excess in this Seyfert.
MRK 530
MRK 530 has not been observed by either Chandra or ASCA. We present XMM-Newton pn spectrum of MRK 530 for the first time. We fitted the 0.5 - 10.0 keV spectrum by an absorbed partially covered power-law ( 2.28, NH fixed to Galactic value, Npart,H 14.81 1022 cm-2, covering fraction f 0.27), a soft component modeled with thermal plasma at a temperature kT 0.20 keV and a narrow Gaussian fitted to the Fe K line.
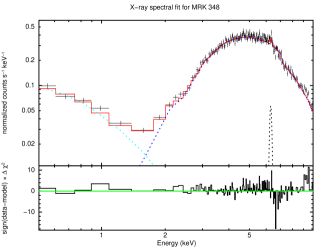
MRK 348
Awaki et al. (2006) fitted the XMM-Newton pn 0.2 - 10.0 keV spectrum of MRK 348 with an absorbed power-law (NH 13.50.02 1022 cm-2, 1.61 0.02), a soft component fitted with a thermal plasma model with temperature kT 0.56 keV and an Fe K line (EW 46.420 eV), and obtain /dof 1.46. They fixed the metal abundance of the thermal plasma at 0.1 times the solar abundance, the characteristic value of a normal galaxy (Terashima et al. 2002). We use the same XMM-Newton data and find the best fit to the 0.5 - 10.0 keV spectrum consists of an absorbed power-law (NH 6.86 1022 cm-2, 1.70) with partial covering (NH,part 10.47 1022 cm-2, covering fraction f 0.84), a soft component fitted with a power-law ( 2.75) and a narrow Gaussian fitted to Fe K line (EW 34.2) and obtained /dof 1.05.
MRK 1
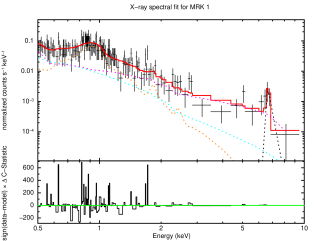
Guainazzi et al. (2005b) fitted the 0.5 - 10.0 keV XMM-Newton pn spectrum of MRK 1 with a highly absorbed power-law (NH 110 1022 cm-2, 2.41) and a scattered component with partial covering factor fixed to 1, and obtained /dof 36/32. They reported several emission lines including iron K shell lines in 0.5 - 2.0 keV band but no thermal component. In order to constrain the Fe K line they performed both global and local fits with centroid energy fixed at 6.4 keV, and found upper limits to the equivalent width of 800 eV and 2.0 keV respectively. Due to the relatively low counts in the data, we use C-statistics to fit the spectrum and find the best fit consists of a hard component (2.0 - 10.0 keV) completely dominated by reflection ( 2.0), a soft component fitted with a power-law ( 2.55) and a thermal plasma model (kT 0.82 keV), and a Gaussian fitted to the Fe K line (EW 1.25 keV). The reflection dominated spectrum, high EW of the Fe line and the low ratio of hard X-ray to [OIII] flux suggest that MRK 1 is likely to be Compton-thick source.
NGC 2273
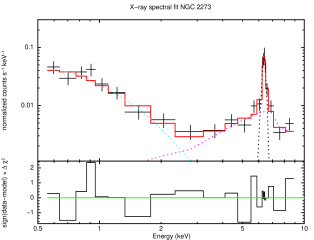
Guainazzi et al. (2005a) attempted to fit the XMM-Newton spectrum of NGC 2273 with a family of models in which hard X-ray component is accounted by an absorbed power-law but yield an unacceptable flat intrinsic spectral index ( -0.2 - -0.5) and also a large EW ( 2.0 - 3.6 keV) of the Fe K line with respect to the measured column density (NH 1.4 - 12.0 1022 cm-2), and suggested that the spectrum is dominated by Compton reflection. In the best fit reported by Guainazzi et al. (2005a), the soft X-ray spectrum is accounted by thermal emission model with temperature kT 0.80.2 keV, hard X-ray fitted by reflection model ( 1.50.4, NH 18.0 1023 cm-2), and an Fe K line with EW 2.2 keV. We find the best fit in which hard component is completely accounted by reflection component ( 0.67 , PEXRAV model), soft component is fitted with a power-law ( 2.79) and a Gaussian line fitted to Fe K (EW 2.18 keV). Compton-thick nature of this source is evident from the reflection dominated spectrum, high EW of Fe K line and low flux ratio of hard X-ray to [OIII].
MRK 78
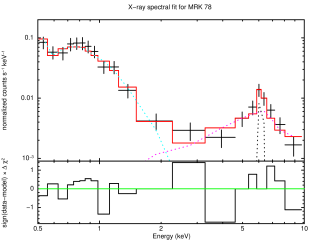
MRK 78 has not been observed by Chandra or ASCA. Levenson et al. (2001) fitted its RoSAT PSPC soft X-ray spectrum with a thermal plasma (kT 0.76 keV) model absorbed by the Galactic column density and reported extended soft X-ray emission indicative of a circumnuclear starburst. We present the XMM-Newton spectrum of MRK 78 for the first time. Our best fit has the hard component completely accounted by a reflection component ( 1.01, ‘pexrav’ model), the soft component fitted with a very steep power-law ( 7.05), and a Gaussian fitted to Fe K (EW 0.67 keV). All the spectral components are absorbed by an equivalent hydrogen column density of NH 6.54 1021 cm-2. The predominance of the reflection component, high EW of the Fe K line and the ratio of hard X-ray flux to [OIII] line flux ratio suggest that obscuration is nearly Compton-thick.
NGC 5135
NGC 5135 has not been observed by XMM-Newton, and we use the Chandra spectral
properties given in Guainazzi et al. (2005a) for our study.
Both Guainazzi et al. (2005a) and Levenson et al. (2004) obtained substantially similar spectral fits consisting
of thermal plus reflection model.
The soft X-ray spectrum requires two thermal components with kT 80 eV and kT 390 eV plus an additional emission line
with centroid energy Ec 1.78 keV. Above 2.0 keV the spectrum is Compton-reflection dominated, consistent with the AGN
being obscured by a column density NH 9.0 1023 cm-2 (for an intrinsic photon index of 1.5 and a reflection
fraction 0.5). The EW of Fe K fluorescent emission line against the reflection continuum is 1.7 keV.
Using Chandra observations Levenson et al. (2004) reported a circumnuclear starburst in NGC 5135 and could
spatially isolate the AGN emission which is entirely obscured by column density of NH 1024 cm-2,
detectable in the Chandra bandpass only as a strongly reprocessed weak continuum represented by a flat power-law
( 0) plus a prominent iron Kα emission line with EW of 2.4 keV.
We confirm the Compton-thick obscuration in NGC 5135 using broad-band 0.5 - 50 keV Suzaku observations
(Singh et al. 2010, in preparation).
MRK 477
MRK 477 has not been observed by XMM-Newton or Chandra, and we therefore use the ASCA spectral properties given in Levenson et al. (2001) for our study. The best fit reported by Levenson et al. (2001) consists of an absorbed power-law (NH 2.4 1023 cm-2, 1.9 fixed) and an unresolved Fe K emission line of EW eV. The addition of a thermal component kT 0.9 keV to this model renders the reasonable spectral parameter values but did not statistically improve the fit. Heckman et al. (1997) pointed out that MRK 477 has a powerful circumnuclear starburst with the bolometric luminosity of 3 1010 - 1011 L⊙. This luminosity is comparable to the AGN activity. However, Levenson et al. (2001) concluded that the soft X-ray spectrum is dominated by the AGN.
NGC 5929
NGC 5929 has not been observed by XMM-Newton or Chandra. Cardamone et al. (2007) have modeled the 0.5 - 8.0 keV ASCA spectrum as a sum of three components: a weakly absorbed (NH,1 5.16 1021 cm-2) power-law with photon index 1.70, a heavily absorbed power-law (NH,2 2.77 1023 cm-2) with the same photon index and a Gaussian Fe K line of EW of 0.35 keV centered at 6.19 keV. We use the ASCA spectral properties of NGC 5929 for our study.
NGC 7212
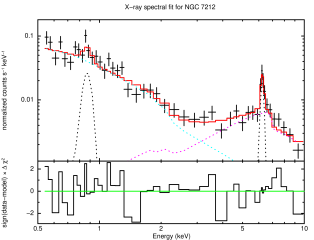
Guainazzi et al. (2005b) fitted the 0.5 - 10.0 keV XMM-Newton spectrum with a heavily absorbed power-law (NH 160 1022 cm-2, 1.5), two thermal plasma components with kT 0.16 and 0.72 keV and an Fe K line and obtain /dof 97.0/65. The Fe K line was fitted globally as well as locally giving EWs 900 eV and 1100200 eV, respectively. We fitted the 0.5 - 10.0 keV XMM-Newton spectrum with the hard component completely accounted for by reflection ( 0.99), the soft component fitted with a power-law ( 2.32), a narrow Gaussian fitted to the emission line feature at 0.9 keV and another Gaussian fitted to the Fe K emission line at 6.4 keV giving EW 0.71 keV.
MRK 533
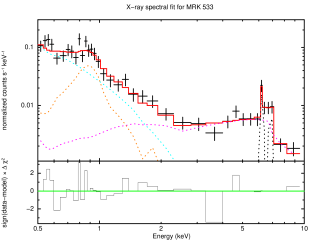
MRK 533 has not been observed by Chandra or ASCA. Levenson et al. (2001) fitted its ROSAT/PSPC soft X-ray spectrum with a power-law . We present the XMM-Newton pn spectrum of MRK 533 for the first time. We fitted the 0.5 - 10.0 keV spectrum with a model in which the soft component is fitted with a power-law ( 3.75) and thermal plasma emission with the temperature kT 0.76, a hard component completely accounted for by reflection ( 2.12, PEXRAV model) and narrow Gaussians fitted to the Fe K line at 6.4 keV and the Fe Kβ line at 7.04 keV, with EWs 0.56 keV and 0.67 keV, respectively. Our X-ray spectral properties suggest the Compton-thick obscuration in MRK 533.
NGC 7682
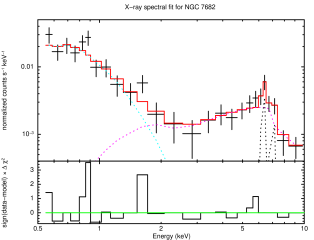
We present the XMM-Newton spectrum of NGC 7682 for the first time and find the best fit consists of a soft component fitted with a steep power-law ( 5.36), a hard component completely accounted for by reflection ( 1.77, PEXRAV model), and narrow Gaussians fitted to Fe K line at 6.4 keV and Fe Kβ line at 7.11 keV of EWs 0.48 keV and 0.46 keV, respectively. All the spectral components are absorbed by an equivalent hydrogen column density NH 3.48 1021 cm-2. Our XMM-Newton X-ray spectral properties suggest the Compton-thick obscuration in NGC 7682.
References
- Akylas & Georgantopoulos (2009) Akylas, A. & Georgantopoulos, I. 2009, A&A, 500, 999
- Antonucci (1993) Antonucci, R. 1993, Annual review of Asto & Asphy, 31, 473
- Antonucci (2002) Antonucci, R. 2002, in Astronomical Society of the Pacific Conference Series, Vol. 284, IAU Colloq. 184: AGN Surveys, ed. R. F. Green, E. Y. Khachikian, & D. B. Sanders, 147–+
- Antonucci & Miller (1985) Antonucci, R. R. J. & Miller, J. S. 1985, ApJ, 297, 621
- Arnaud (1996) Arnaud, K. A. 1996, in Astronomical Society of the Pacific Conference Series, Vol. 101, Astronomical Data Analysis Software and Systems V, ed. G. H. Jacoby & J. Barnes, 17–+
- Awaki et al. (1991) Awaki, H., Koyama, K., Inoue, H., & Halpern, J. P. 1991, PASJ, 43, 195
- Awaki et al. (2006) Awaki, H., Murakami, H., Ogawa, Y., & Leighly, K. M. 2006, ApJ, 645, 928
- Awaki et al. (2009) Awaki, H., Terashima, Y., Higaki, Y., & Fukazawa, Y. 2009, PASJ, 61, 317
- Awaki et al. (2000) Awaki, H., Ueno, S., Taniguchi, Y., & Weaver, K. A. 2000, ApJ, 542, 175
- Bassani et al. (1999) Bassani, L., Dadina, M., Maiolino, R., et al. 1999, ApJS, 121, 473
- Beckmann et al. (2009) Beckmann, V., Soldi, S., Ricci, C., et al. 2009, A&A, 505, 417
- Bianchi et al. (2005a) Bianchi, S., Guainazzi, M., Matt, G., et al. 2005a, A&A, 442, 185
- Bianchi et al. (2004) Bianchi, S., Matt, G., Balestra, I., Guainazzi, M., & Perola, G. C. 2004, A&A, 422, 65
- Bianchi et al. (2005b) Bianchi, S., Miniutti, G., Fabian, A. C., & Iwasawa, K. 2005b, MNRAS, 360, 380
- Blustin et al. (2003) Blustin, A. J., Branduardi-Raymont, G., Behar, E., et al. 2003, A&A, 403, 481
- Blustin et al. (2007) Blustin, A. J., Kriss, G. A., Holczer, T., et al. 2007, A&A, 466, 107
- Braito et al. (2004) Braito, V., Della Ceca, R., Piconcelli, E., et al. 2004, A&A, 420, 79
- Buchanan et al. (2006) Buchanan, C. L., Gallimore, J. F., O’Dea, C. P., et al. 2006, AJ, 132, 401
- Cappi et al. (2006) Cappi, M., Panessa, F., Bassani, L., et al. 2006, A&A, 446, 459
- Cardamone et al. (2007) Cardamone, C. N., Moran, E. C., & Kay, L. E. 2007, AJ, 134, 1263
- Cid Fernandes et al. (1998) Cid Fernandes, R. J., Storchi-Bergmann, T., & Schmitt, H. R. 1998, MNRAS, 297, 579
- Dadina (2008) Dadina, M. 2008, A&A, 485, 417
- Dahari & De Robertis (1988) Dahari, O. & De Robertis, M. M. 1988, ApJ, 331, 727
- De Rosa et al. (2002) De Rosa, A., Fabian, A. C., & Piro, L. 2002, MNRAS, 334, L21
- Ferruit et al. (2000) Ferruit, P., Wilson, A. S., & Mulchaey, J. 2000, ApJS, 128, 139
- Gallagher et al. (2002) Gallagher, S. C., Brandt, W. N., Chartas, G., Garmire, G. P., & Sambruna, R. M. 2002, ApJ, 569, 655
- Ghisellini et al. (1991) Ghisellini, G., George, I. M., Fabian, A. C., & Done, C. 1991, MNRAS, 248, 14
- Ghisellini et al. (1994) Ghisellini, G., Haardt, F., & Matt, G. 1994, MNRAS, 267, 743
- Gilli et al. (2007) Gilli, R., Comastri, A., & Hasinger, G. 2007, A&A, 463, 79
- González Delgado et al. (2001) González Delgado, R. M., Heckman, T., & Leitherer, C. 2001, ApJ, 546, 845
- Grandi et al. (1998) Grandi, P., Haardt, F., Ghisellini, G., et al. 1998, ApJ, 498, 220
- Griffiths et al. (1998) Griffiths, R. G., Warwick, R. S., Georgantopoulos, I., Done, C., & Smith, D. A. 1998, MNRAS, 298, 1159
- Guainazzi et al. (2005a) Guainazzi, M., Fabian, A. C., Iwasawa, K., Matt, G., & Fiore, F. 2005a, MNRAS, 356, 295
- Guainazzi et al. (2005b) Guainazzi, M., Matt, G., & Perola, G. C. 2005b, A&A, 444, 119
- Heckman et al. (1997) Heckman, T. M., Gonzalez-Delgado, R., Leitherer, C., et al. 1997, ApJ, 482, 114
- Heckman et al. (2005) Heckman, T. M., Ptak, A., Hornschemeier, A., & Kauffmann, G. 2005, ApJ, 634, 161
- Ho & Ulvestad (2001) Ho, L. C. & Ulvestad, J. S. 2001, ApJS, 133, 77
- Kellermann et al. (1989) Kellermann, K. I., Sramek, R., Schmidt, M., Shaffer, D. B., & Green, R. 1989, AJ, 98, 1195
- King (2005) King, A. 2005, ApJ, 635, L121
- Kinkhabwala et al. (2002) Kinkhabwala, A., Sako, M., Behar, E., et al. 2002, ApJ, 575, 732
- Krolik et al. (1994) Krolik, J. H., Madau, P., & Zycki, P. T. 1994, ApJ, 420, L57
- Lal et al. (2011) Lal, D. V., Shastri, P., & Gabuzda, D. C. 2011, ApJ, 731, 68
- Leahy & Creighton (1993) Leahy, D. A. & Creighton, J. 1993, MNRAS, 263, 314
- Leighly et al. (1996) Leighly, K. M., Mushotzky, R. F., Yaqoob, T., Kunieda, H., & Edelson, R. 1996, ApJ, 469, 147
- Levenson et al. (2006) Levenson, N. A., Heckman, T. M., Krolik, J. H., Weaver, K. A., & Życki, P. T. 2006, ApJ, 648, 111
- Levenson et al. (2001) Levenson, N. A., Weaver, K. A., & Heckman, T. M. 2001, ApJ, 550, 230
- Levenson et al. (2004) Levenson, N. A., Weaver, K. A., Heckman, T. M., Awaki, H., & Terashima, Y. 2004, ApJ, 602, 135
- Magdziarz & Zdziarski (1995) Magdziarz, P. & Zdziarski, A. A. 1995, MNRAS, 273, 837
- Maiolino et al. (1997) Maiolino, R., Ruiz, M., Rieke, G. H., & Papadopoulos, P. 1997, ApJ, 485, 552
- Maiolino et al. (1998) Maiolino, R., Salvati, M., Bassani, L., et al. 1998, A&A, 338, 781
- Malkan et al. (1998) Malkan, M. A., Gorjian, V., & Tam, R. 1998, ApJS, 117, 25
- Mason et al. (2003) Mason, K. O., Branduardi-Raymont, G., Ogle, P. M., et al. 2003, ApJ, 582, 95
- Mateos et al. (2010) Mateos, S., Carrera, F. J., Page, M. J., et al. 2010, A&A, 510, A35+
- Matt et al. (2006) Matt, G., Bianchi, S., de Rosa, A., Grandi, P., & Perola, G. C. 2006, A&A, 445, 451
- Matt et al. (2000a) Matt, G., Fabian, A. C., Guainazzi, M., et al. 2000a, MNRAS, 318, 173
- Matt et al. (1996) Matt, G., Fiore, F., Perola, G. C., et al. 1996, MNRAS, 281, L69
- Matt et al. (2000b) Matt, G., Perola, G. C., Fiore, F., et al. 2000b, A&A, 363, 863
- Miller et al. (2006) Miller, L., Turner, T. J., Reeves, J. N., et al. 2006, A&A, 453, L13
- Moran et al. (2000) Moran, E. C., Filippenko, A. V., & Kay, L. E. 2000, in Bulletin of the American Astronomical Society, Vol. 32, Bulletin of the American Astronomical Society, 1182–+
- Mulchaey et al. (1994) Mulchaey, J. S., Koratkar, A., Ward, M. J., et al. 1994, ApJ, 436, 586
- Mulchaey et al. (1996) Mulchaey, J. S., Wilson, A. S., & Tsvetanov, Z. 1996, ApJ, 467, 197
- Nandra et al. (1997) Nandra, K., George, I. M., Mushotzky, R. F., Turner, T. J., & Yaqoob, T. 1997, ApJ, 477, 602
- Nandra & Pounds (1994) Nandra, K. & Pounds, K. A. 1994, MNRAS, 268, 405
- Nelson & Whittle (1995) Nelson, C. H. & Whittle, M. 1995, ApJS, 99, 67
- Osterbrock & Ferland (2006) Osterbrock, D. E. & Ferland, G. J. 2006, Astrophysics of gaseous nebulae and active galactic nuclei, ed. Osterbrock, D. E. & Ferland, G. J.
- Panessa & Bassani (2002) Panessa, F. & Bassani, L. 2002, A&A, 394, 435
- Panessa et al. (2006) Panessa, F., Bassani, L., Cappi, M., et al. 2006, A&A, 455, 173
- Perola et al. (2000) Perola, G. C., Matt, G., Fiore, F., et al. 2000, A&A, 358, 117
- Piro et al. (2005) Piro, L., de Rosa, A., Matt, G., & Perola, G. C. 2005, A&A, 441, L13
- Polletta et al. (1996) Polletta, M., Bassani, L., Malaguti, G., Palumbo, G. G. C., & Caroli, E. 1996, ApJS, 106, 399
- Pounds & Page (2005) Pounds, K. A. & Page, K. L. 2005, MNRAS, 360, 1123
- Ptak et al. (2003) Ptak, A., Heckman, T., Levenson, N. A., Weaver, K., & Strickland, D. 2003, ApJ, 592, 782
- Reynolds (1997) Reynolds, C. S. 1997, MNRAS, 286, 513
- Risaliti et al. (1999) Risaliti, G., Maiolino, R., & Salvati, M. 1999, ApJ, 522, 157
- Sako et al. (2000) Sako, M., Kahn, S. M., Paerels, F., & Liedahl, D. A. 2000, ApJ, 543, L115
- Sambruna et al. (2001) Sambruna, R. M., Netzer, H., Kaspi, S., et al. 2001, ApJ, 546, L13
- Schmidt & Green (1983) Schmidt, M. & Green, R. F. 1983, ApJ, 269, 352
- Schmitt et al. (2003) Schmitt, H. R., Donley, J. L., Antonucci, R. R. J., Hutchings, J. B., & Kinney, A. L. 2003, ApJS, 148, 327
- Schurch & Warwick (2002) Schurch, N. J. & Warwick, R. S. 2002, MNRAS, 334, 811
- Schurch et al. (2004) Schurch, N. J., Warwick, R. S., Griffiths, R. E., & Kahn, S. M. 2004, MNRAS, 350, 1
- Smith & Done (1996) Smith, D. A. & Done, C. 1996, MNRAS, 280, 355
- Terashima et al. (2002) Terashima, Y., Iyomoto, N., Ho, L. C., & Ptak, A. F. 2002, ApJS, 139, 1
- Tran (2001) Tran, H. D. 2001, ApJ, 554, L19
- Tran (2003) Tran, H. D. 2003, ApJ, 583, 632
- Treister et al. (2009) Treister, E., Urry, C. M., & Virani, S. 2009, ApJ, 696, 110
- Tueller et al. (2008) Tueller, J., Mushotzky, R. F., Barthelmy, S., et al. 2008, ApJ, 681, 113
- Turner et al. (1997a) Turner, T. J., George, I. M., Nandra, K., & Mushotzky, R. F. 1997a, ApJS, 113, 23
- Turner et al. (1997b) Turner, T. J., George, I. M., Nandra, K., & Mushotzky, R. F. 1997b, ApJ, 488, 164
- Turner et al. (1998) Turner, T. J., George, I. M., Nandra, K., & Mushotzky, R. F. 1998, ApJ, 493, 91
- Urry et al. (1995) Urry, K., Padovanni, G., Wilson, A. S., & Yoshida, M. 1995, ApJ, 521, 565
- Vignali et al. (2004) Vignali, C., Brandt, W. N., Boller, T., Fabian, A. C., & Vaughan, S. 2004, MNRAS, 347, 854
- Wang et al. (2009) Wang, J., Mao, Y. F., & Wei, J. Y. 2009, AJ, 137, 3388
- Weaver et al. (2001) Weaver, K. A., Gelbord, J., & Yaqoob, T. 2001, ApJ, 550, 261
- Weaver et al. (1996) Weaver, K. A., Nousek, J., Yaqoob, T., et al. 1996, ApJ, 458, 160
- Weedman (1977) Weedman, D. W. 1977, ARA&A, 15, 69
- Whittle (1992) Whittle, M. 1992, ApJS, 79, 49
- Worsley et al. (2005) Worsley, M. A., Fabian, A. C., Bauer, F. E., et al. 2005, MNRAS, 357, 1281
- Yang et al. (2001) Yang, Y., Wilson, A. S., & Ferruit, P. 2001, ApJ, 563, 124
- Yee et al. (1981) Yee, H. K. C., Stockman, H. S., & Green, R. F. 1981, in Bulletin of the American Astronomical Society, Vol. 13, Bulletin of the American Astronomical Society, 806–+
- Young et al. (2001) Young, A. J., Wilson, A. S., & Shopbell, P. L. 2001, ApJ, 556, 6