Orbital reflectometry
Abstract
The occupation of d-orbitals controls the magnitude and anisotropy of the inter-atomic electron transfer in transition metal oxides and hence exerts a key influence on their chemical bonding and physical properties.1, 2 Atomic-scale modulations of the orbital occupation at surfaces and interfaces are believed to be responsible for massive variations of the magnetic and transport properties,3, 4, 5, 6, 7, 8, 9 but could thus far not be probed in a quantitative manner. Here we show that it is possible to derive quantitative, spatially resolved orbital polarization profiles from soft x-ray reflectivity data, without resorting to model calculations. We demonstrate that the method is sensitive enough to resolve differences of in the occupation of Ni eg orbitals in adjacent atomic layers of a LaNiO3-LaAlO3 superlattice, in good agreement with ab-initio electronic-structure calculations. The possibility to quantitatively correlate theory and experiment on the atomic scale opens up many new perspectives for orbital physics in d-electron materials.
The electronic properties of transition metal oxides (TMOs) are determined by the interplay of the spin, charge, and orbital degrees of freedom of the valence electrons. Progress in understanding and predicting these properties relies on quantitative experimental information about the spatial variation of all three observables on the atomic scale. Powerful probes of the spin and charge densities are already available. For instance, neutron diffractometry and reflectometry are routinely used to determine the magnetization profiles in the bulk and near surfaces and interfaces, respectively. The valence electron charge density is more difficult to investigate, because most scattering probes couple to the total charge that is dominated by the core electrons. Recently, however, spectroscopic methods such as electron energy-loss spectroscopy10 and soft x-ray reflectometry11 have yielded atomically resolved profiles of the valence electron charge.
The -orbital degree of freedom is the distinguishing characteristic of TMOs compared to materials with valence electrons in the - and -electron shells. In bulk TMOs, spatial alternation of the -orbital occupation (“orbital order”) is known to generate “colossal” variations of the macroscopic properties,1, 2 and the influence of “orbital reconstructions” on the physical properties of surfaces and interfaces is currently a subject of intense investigation.3, 4, 5, 6, 7, 8, 9 At present, however, only the spatial average of the orbital occupation can be determined in a facile and quantitative manner, by means of x-ray linear dichroism (XLD), a method that relies on the excitation of core electrons into the valence -orbitals by linearly polarized photons.12 Despite its obvious scientific interest, quantitative experimental information about spatial variations of the -orbital polarization is very limited. Methods used to determine the amplitude of staggered orbital order in the bulk are mostly qualitative and/or require extensive model calculations that add substantial uncertainties.2 Even less information is available on orbital polarization profiles near surfaces and interfaces. Some evidence of orbital reconstructions near single TMO interfaces has been derived from comparison of XLD measurements in different detection modes3 and from comparison to corresponding bulk data,6, 7, 8 but these methods do not provide depth resolution.
Here we focus on TMO interfaces, which are currently in the center of a large-scale research effort driven by prospects to control and ultimately design their electronic properties.13 Since the orbital occupation determines the electronic bandwidth and the magnetic exchange interactions at and near the interfaces, detailed experimental information on the orbital polarization is essential for the design of suitable heterostructures. We show that quantitative, depth-resolved profiles of the orbital occupation in TMO heterostructures and superlattices can be derived from linearly polarized x-ray reflectometry with photon energies near transition-metal L-absorption edges. The orbital occupation is extracted by the application of sum rules, analogous to XLD, so that model calculations are not required. The method is broadly applicable to TMO surfaces, interfaces, and multilayers and can be readily generalized to bulk diffractometry, where it will allow quantitative measurements of staggered orbital order.
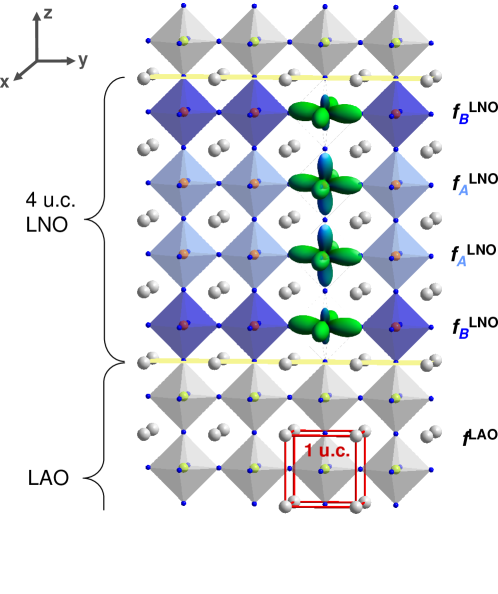
We demonstrate the method by investigating a superlattice comprised of the paramagnetic metal LaNiO3 (LNO) and the band insulator LaAlO3 (LAO). The Ni3+ ion in LNO has a electron configuration, and the nearly cubic crystal field of the perovskite structure splits the atomic orbital manifold into a lower-lying triply-degenerate level occupied by six electrons and a higher-lying doubly-degenerate level with a single electron. While in bulk LNO the two Ni orbitals (with - and - symmetry) are equally occupied, model calculations have suggested that the - (in-plane) orbital can be stabilized by epitaxial strain and confinement in a superlattice geometry (Fig. 1), and that the electronic structure of superlattices with fully polarized in-plane orbitals matches the one of the copper-oxide high-temperature superconductors.14, 15, 16 This system is thus a prime candidate for “orbitally engineered” superconductivity.
We have used pulsed laser deposition to grow a (4 u.c.//4 u.c.) 8 LNO-LAO superlattice on a SrTiO3 (STO) substrate (u.c.: pseudo-cubic unit cell; see Fig. 1). Since the lattice constant of cubic STO is somewhat larger than the pseudo-cubic lattice constants of LNO and LAO (mismatch 2 ), the superlattice is expected to be under tensile strain. The high crystalline quality and strain-state of the sample were verified by x-ray diffraction and reciprocal-space mapping (see the Supplementary Information). Transport17 and optical ellipsometry measurements in combination with low-energy muon spin rotation18 show that 4 u.c. thick LNO layer stacks in TMO superlattices are metallic and paramagnetic. The total thickness of 247 8 Å of the superlattice was chosen to ensure that the sample is thin enough to clearly resolve total-thickness fringes, but thick enough to minimise contributions of Ni2+ that might occur in the vicinity of the polar layer-substrate interface.19
The reflectivity measurements were performed at room temperature in specular geometry, i.e. the momentum transfer was parallel to the surface normal (see the Methods section). The resulting data for photon energy 8047 eV, far from resonance in the hard x-ray range (Fig. 2a) reflect the high quality of the investigated superstructure. At energies corresponding to the Ni L2,3 resonances at 854.7 eV and 872.2 eV, we observe superlattice peaks up to the third order, denoted by SL (00), = 1, 2, 3 in Fig. 2. To obtain the layer thickness and interface roughness of our superlattice, we fitted the -dependent data using our newly developed reflectivity analysis program ReMagX20 in a mode based on the Parratt formalism21 (for details see Supplementary Information). The resulting profiles are shown in Fig. 2, and the structural parameters are given in the table below. The best fit is obtained when allowing the first LNO layer stack (buffer layer) grown on STO and the last LAO layer stack (cap layer) to be slightly thicker and different in roughness. We stress that our structural model is simple and gives an excellent description for the full set of data, measured for different energies and polarization geometries.
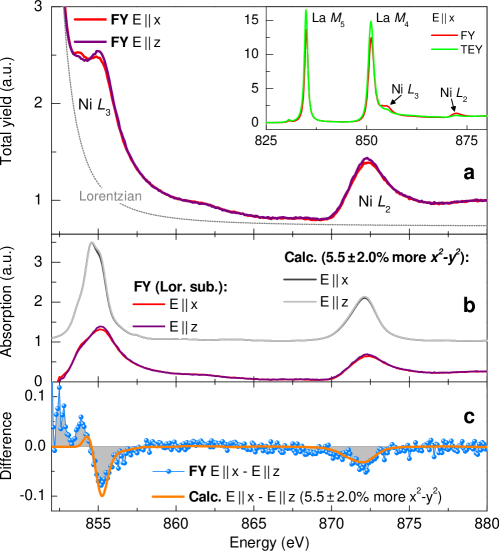
The x-ray absorption spectra (XAS) measured in total-electron yield (TEY) and fluorescence-yield (FY) modes are shown in Fig. 3a. Due to the vicinity of the strong La M4 white lines, the Ni L3 line is only seen as a shoulder around 855 eV (see inset), but the Ni L2 white line is clearly observed at 872 eV. The FY data show a smaller intensity at the La white lines and an enhanced contribution at the Ni lines compared to the TEY. This is explained by self-absorption effects, limited energy resolution, different probing depths of both methods, and the fact that the topmost layer of the superlattice is a LAO layer. However, the dichroic difference spectrum clearly shows dips at the Ni L3 and L2 white line energies, which we attribute to natural linear dichroism (Fig. 3c). We obtained nearly identical results from FY and TEY data (not shown for clarity).
In general, natural linear dichroism reflects an anisotropy of the charge distribution around a particular ion.12 To obtain a quantitative estimate of the imbalance in band occupation in our superlattice, we applied the sum rule for linear dichroism,22, 23 which relates the total integrated intensity of the polarized spectra () to the hole occupation and in the orbitals:
| (1) |
By integrating the spectra in the range 853 -877 eV, after subtracting the La M4 contribution estimated by a Lorentzian profile (Fig. 3b), we obtain / = 1.030(5), independent of covalency. We define the orbital polarization
| (2) |
with and being the numbers of electrons and finally obtain 5 , neglecting covalency. In order to compare the lineshape of the polarized XAS spectra directly, we performed a cluster calculation for a Ni3+ ion in an almost-cubic crystal field of six oxygen ions (=10 meV) (see Fig. 3b). While the cluster calculation is expected to give good results for localized electrons in insulators, we expect some deviations in the calculated lineshape of the XAS spectra in the case of our metallic nickelate layers. Indeed, although we included reasonable line broadening (due to the finite temperature and experimental resolution) the measured lineshape is not fully reproduced, and we show the best result scaled to the experimental data in such a way that the integrated spectral weight is conserved. However, as pointed out above, the polarization-dependence of the spectra is independent of details in lineshape. To reproduce the measured dichroic difference, = 5.52 higher - band occupation is needed, in good agreement with the result obtained from the sum rule. In particular, we stress that a higher occupation of the - band would result in a sign change of the XLD signal and can be excluded.
While in XAS the averaged absorption of the LNO layers is measured, i.e. for LNO layer stacks composed of two inner layers with scattering factor and two interface layers with (see Fig. 1), the intensity of the (002) superlattice reflection of a symmetric superlattice is mainly determined by the difference . Taking advantage of this relation, we studied the polarization dependence of the reflected intensity across the Ni L edge for momentum transfers in the vicinity of the (002) superlattice peak (Fig. 4). First, one notices that the lineshape of the scattering profiles is rather different compared to the XAS profiles and strongly depends on . Second, there is a pronounced polarization dependence, which only occurs at the Ni (L3 and L2) edge energies. In particular, the single-peak profile observed for -polarization is split into a double-peak profile for -polarized photons. Although the relative intensities change somewhat with , nearly identical difference spectra are observed for both values. A qualitative comparison with the dichroic signal observed in the absorption spectra already shows a clear enhancement, which indicates a modulation of orbital occupancy within the LNO layer stack.
In order to confirm this conclusion and extract quantitative information about the orbital occupation, we used the newly developed analysis tool20 to simulate the constant- scans (right panels of Fig. 4), based on the structural parameters derived from -dependent reflectometry and the optical constants obtained from FY-XAS (see Supplementary Information for details). To model the observed polarization dependence, a dielectric tensor of at least tetragonal symmetry has to be taken into account. Within the framework of the optical approach for multilayers, we implemented formulae from the magneto-optical formalism derived in Ref. 24. We modeled our data with LNO layer stacks split into four unit-cell thick layers, labeled A and B in the following (Fig. 1). For each layer A and B we assumed a dielectric tensor with tetragonal symmetry of the form
| (6) |
with complex entries () calculated from the optical constants by and . In the case of a homogeneous LNO stack with B and A layer having the same dichroism, the measured averaged dichroism was taken as input, i.e. and obtained from the XAS for and , respectively. The simulated constant- scans for the homogeneous LNO stack cannot reproduce the large anisotropy observed in the experiment (see light blue/orange lines in the right panels of Fig. 4). We therefore considered the case of a modulated LNO stack with different - band occupation in layers A and B, keeping the averaged dichroism of 5.52 obtained from XLD fixed. To model the optical constants, we parameterized them in the following way: for the cubic case the tensor has diagonal entries . Using this and the parameter we can write the tensor elements:
| (7) |
with upper signs for layer A and lower ones for layer B. By varying the parameter and comparing the normalized difference spectra of the constant- scans, we found the best agreement of simulations and experiment for = 0.300.05 and a stacking sequence BAAB. This corresponds to a = 73 higher - population in the interface layers B and a = 41 higher - population in the inner layers A. There is a clear difference to the solution with stacking ABBA (not shown for clarity).
In order to compare our results to the predictions of ab-initio electronic-structure calculations,14, 15, 16 we have performed LDA+U calculations for the particular superlattice geometry studied in this work with 4 u.c. LNO (for details see the Supplementary Information). Using equation (2), we obtain an orbital polarization of 6 (3) for the outer (inner) NiO2 layers B (A), in excellent agreement with the experimental result. The correspondence between the theoretical and experimental data also confirms that the orbital population in our system is not significantly influenced by structural or chemical disorder.
We conclude that polarized resonant x-ray reflectometry in combination with the analysis method we have presented here is a powerful tool to accurately map out the orbital-occupation profile in TMO multilayers. The quantitative correspondence between theoretical predictions and experimental measurements we have demonstrated opens up new perspectives for the synthesis of TMO interfaces and superlattices with designed electronic properties, including but not limited to the nickelate system we have investigated here. Potential tuning parameters for a systematic design effort include epitaxial strain from the substrate and the constituents of the superlattice, the thicknesses of the individual layers, and the covalency of the chemical bonds across the interface. Finally, we note that the methodology introduced here can be readily generalized to other systems with nonuniform orbital occupation, such as surfaces and bulk systems with staggered orbital order, and thus has the potential to bring orbital physics in TMOs to a new level of quantitative accuracy.
Methods High-quality superlattices with atomic-scale precision have been grown by pulsed-laser deposition from LaNiO3 and LaAlO3 stoichiometric targets using a KrF excimer laser with 2 Hz pulse rate and 1.6 J/cm2 energy density. Both compounds were deposited in 0.5 mbar oxygen atmosphere at 730∘C and subsequently annealed in 1 bar oxygen atmosphere at 690∘C for 30 min. Here we investigated a (4 u.c.//4 u.c.) x 8 LNO-LAO superlattice grown on an atomically flat [001]-oriented single-crystalline STO substrate. The crystallinity, superlattice structure and sharpness of the interfaces (roughness 1 u.c.) were verified by high-resolution hard x-ray diffraction along the specular rod. Reciprocal space mapping around the (103) STO peak shows that the strain induced by the substrate is partially relaxed within a total thickness of 247Å (see Supplementary Information for details).
The resonant x-ray reflectivity and XAS measurements were carried out at UE56/2-PGM1 soft x-ray beam line at BESSY II in Berlin, Germany, using the advanced 3-axis UHV reflectometer described in Ref. 25. The undulator beamline supplies 90 % linearly and polarized light (for the notation see sketch in Fig. 2a). Beamline settings have been chosen to result in a bandwidth of 0.57 eV at 840 eV (optimized intensity). The x-ray absorption have been measured with and polarization of the incident light at an angle of incidence of = 30∘. While for polarization the measured intensity corresponds directly to , the intensity for is deduced from = 4/3-1/3, with being the measured intensity with polarization.26 Reflected intensities have been measured with a diode and were corrected by the fluorescence background, measured independently with a second diode. All intensities have been normalized by the incoming intensity measured with a gold mesh.
Density functional calculations were performed using the Vienna ab-initio simulation package (VASP) code. The projector augmented-wave27, 28 method was used in the framework of the generalized gradient approximation (GGA).29, 30, 31, 32 The orbital occupation numbers were obtained by integrating the projected density of state within a fixed sphere on Ni - or - orbitals (see Supplementary Information for details).
References
- 1 Tokura, Y. Nagaosa, N. Orbital Physics in Transition-Metal Oxides. Science 288, 462-468 (2000).
- 2 Maekawa, S. et al. Physics of Transition Metal Oxides (Springer, 2004).
- 3 Chakhalian, J. et al. Orbital Reconstruction and Covalent Bonding at an Oxide Interface. Science 318, 1114-1117 (2007).
- 4 Rata, A.D. et al. Strain-induced insulator state and giant gauge factor of La0.7Sr0.3CoO3 films. Phys. Rev. Lett. 100, 076401 (2008).
- 5 Jackeli, G. & Khaliullin, G. Spin, Charge, and Orbital Order at the Interface between Correlated Oxides. Phys. Rev. Lett. 101, 216804 (2008).
- 6 Tebano, A. et al. Evidence of Orbital Reconstruction at Interfaces in Ultrathin La0.67Sr0.33MnO3 Films. Phys. Rev. Lett. 100, 137401 (2008).
- 7 Aruta, C. et al. Orbital occupation, atomic moments, and magnetic ordering at interfaces of manganite thin films. Phys. Rev. B 80, 014431 (2009).
- 8 Salluzzo, M. et al. Orbital Reconstruction and the Two-Dimensional Electron Gas at the LaAlO3/SrTiO3 Interface. Phys. Rev. Lett. 102, 166804 (2009).
- 9 Yu, P. et al. Interface Ferromagnetism and Orbital Reconstruction in BiFeO3–La0.67Sr0.33MnO3 Heterostructures. Phys. Rev. Lett. 105, 027201 (2010).
- 10 Muller, D.A. Structure and bonding at the atomic scale by scanning transmission electron microscopy. Nature Materials 8, 263-270 (2009).
- 11 Smadici, S. et al. Superconducting Transition at 38 K in Insulating-Overdoped La2CuO4-La1.64Sr0.36CuO4 Superlattices: Evidence for Interface Electronic Redistribution from Resonant Soft X-Ray Scattering. Phys. Rev. Lett. 102, 107004 (2009).
- 12 Stöhr, J. Siegmann, H. C. Magnetism. From Fundamentals to Nanoscale Dynamics (Springer, Berlin, 2007).
- 13 Mannhart, J. & Schlom, D.G. Oxide Interfaces – an Opportunity for Electronics. Science 327, 1607-1611 (2010).
- 14 Chaloupka, J. Khaliullin, G. Orbital Order and Possible Superconductivity in LaNiO3/LaMO3 Superlattices. Phys. Rev. Lett. 100, 016404 (2008).
- 15 Hansmann, P. et al. Turning a Nickelate Fermi Surface into a Cupratelike One through Heterostructuring. Phys. Rev. Lett. 103, 016401 (2009).
- 16 Han, M. J., Marianetti, C. A. Millis, A. J. Chemical Control of Orbital Polarization in Artificially Structured Transition Metal Oxide Materials: the case of La2NiXO6. arXiv:1004.4678v1 (2010).
- 17 May, S. J., Santos, T. S. Bhattacharya, A. Onset of metallic behavior in strained (LaNiO3)n/(SrMnO3)2 superlattices. Phys. Rev. B 79, 115127 (2009).
- 18 Boris, A. V. et al. unpublished (2010).
- 19 Liu, J. et al. Effect of polar discontinuity on the growth of LaNiO3/LaAlO3 superlattices. Appl. Phys. Lett. 96, 133111 (2010).
- 20 Macke, S., Brück, S. Goering, E. ’ReMagX x-ray magnetic reflectivity tool,’ www.mf.mpg.de/remagx.html
- 21 Parratt, L.G. Surface Studies of Solids by Total Reflection of X-Rays. Phys. Rev. 95, 359-369 (1954).
- 22 Thole, B. T. van der Laan, G. Sum Rules for Magnetic Dichroism in Rare Earth 4f Photoemission. Phys. Rev. Lett. 70, 2499-2502 (1993).
- 23 van der Laan, G. Sum Rules and Fundamental Spectra of Magnetic X-Ray Dichroism in Crystal Field Symmetry. J. Phys. Soc. Japan 63, 2393-2400 (1994).
- 24 Višňovský, Š. Magneto-optical polar kerr effect and birefringence in magnetic crystals of orthorhombic symmetry. Czech. J. Phys. B 34, 155-162 (1984).
- 25 Brück, S., Bauknecht, S., Ludescher, B., Goering, E. Schütz, G. An advanced magnetic reflectometer. Rev. Sci. Instrum. 79, 083109 (2008).
- 26 Wu, W. B. et al. Orbital polarization of LaSrMnO4 studied by soft X-ray linear dichroism. J. Electron Spectroscopy 137-140, 641-645 (2004).
- 27 Blöchl, P. E. Projector augmented-wave method. Phys. Rev. B 50, 17953-17979 (1994).
- 28 Kresse, G. Joubert, D. From ultrasoft pseudopotentials to the projector augmented-wave method. Phys. Rev. B 59, 1758-1775 (1999).
- 29 Perdew, J. P., Burke, K. Ernzerhof, M. Generalized Gradient Approximation Made Simple. Phys. Rev. Lett. 77, 3865-3868 (1996).
- 30 Perdew, J. P., Burke, K. Ernzerhof, M. Erratum: Generalized Gradient Approximation Made Simple [Phys. Rev. Lett. 77, 3865 (1996)]. Phys. Rev. Lett. 78, 1396 (1997).
- 31 Kresse, G. Hafner, J. Ab initio molecular-dynamics simulation of the liquid-metal-amorphous-semiconductor transition in germanium. Phys. Rev. B 49, 14251-14269 (1994).
- 32 Kresse, G. Furthmüller, J. Efficient iterative schemes for ab initio total-energy calculations using a plane-wave basis set. Phys. Rev. B 54, 11169-11186 (1996).
Supplementary Information accompanies this paper on www.nature.com/nmat
Acknowledgements We acknowledge financial support from the DFG within the framework of the TRR80, Proj. C1. The authors thank G. Khaliullin and G. A. Sawatzky for very fruitful discussions. We gratefully acknowledge the provision of synchrotron radiation and the assistance from W. Mahler and B. Zada at the UE562-PGM1 beamline at Helmholtz-Zentrum Berlin - BESSY II. We thank M. Dudek for performing the hard x-ray reflectivity measurements, and S. Heinze for taking the AFM image.
Author contributions E.B. carried out the experiments and analyzed the data. M.W.H. made substantial contributions to the data analysis and performed the cluster calculations. S.B. and E.G. designed and set the experiment up. S.B., E.G., and S.M. developed the analysis tool ReMagX. G.C. and U.H. grew the superlattices by PLD. A.F., E.B., A.B., and P.W. characterized the samples by high-resolution x-ray diffraction. X.Y. and O.K.A. performed the LDA+U calculations. I.Z. and H.J.K. assisted in the experiments. V.H. worked on the data collection and analysis. E.B., M.H., V.H., and B.K. wrote the paper. V.H. and B.K. coordinated the project.
Author Information Correspondence and requests for materials should be addressed to V. H. (v.hinkov@fkf.mpg.de) or B. K. (b.keimer@fkf.mpg.de).

| Fit parameters | thickness (Å) | roughness (Å) |
|---|---|---|
| 7 bilayer LAO/LNO (coupled) | 15.2/15.4 | 3.5/2.0 |
| STO substrate | 1.7 | |
| LNO buffer layer | 18.5 | 3.3 |
| LAO cap layer | 18.3 | 3.0 |