The Far-Ultraviolet “Continuum” in Protoplanetary Disk Systems I: Electron-Impact H2 and Accretion Shocks**affiliation: Based on observations made with the NASA/ESA , obtained from the data archive at the Space Telescope Science Institute. STScI is operated by the Association of Universities for Research in Astronomy, Inc. under NASA contract NAS 5-26555.
Abstract
We present deep spectroscopic observations of the classical T Tauri stars DF Tau and V4046 Sgr in order to better characterize two important sources of far-ultraviolet continuum emission in protoplanetary disks. These new Hubble Space Telescope-Cosmic Origins Spectrograph observations reveal a combination of line and continuum emission from collisionally excited H2 and emission from accretion shocks. H2 is the dominant emission in the 1400 1650 Å band spectrum of V4046 Sgr, while an accretion continuum contributes strongly across the far-ultraviolet spectrum of DF Tau. We compare the spectrum of V4046 Sgr to models of electron-impact induced H2 emission to constrain the physical properties of the emitting region, after making corrections for attenuation within the disk. We find reasonable agreement with the broad spectral characteristics of the H2 model, implying 1018 cm-2, = 3000 K, and a characteristic electron energy in the range of 50 – 100 eV. We propose that self-absorption and hydrocarbons provide the dominant attenuation for H2 line photons originating within the disk. For both DF Tau and V4046 Sgr, we find that a linear fit to the far-UV data can reproduce near-UV/optical accretion spectra. We discuss outstanding issues concerning how these processes operate in protostellar/protoplanetary disks, including the effective temperature and absolute strength of the radiation field in low-mass protoplanetary environments. We find that the 912 – 2000 Å continuum in low-mass systems has an effective temperature of 104 K with fluxes 105-7 times the interstellar level at 1 AU.
Subject headings:
accretion — protoplanetary disks — stars: pre-main sequence — stars: individual (DF Tau, V4046 Sgr)1. Introduction
Classical T Tauri stars (CTTSs) are characterized by broad H emission lines and ultraviolet (UV) spectra dominated by atomic and molecular features that are attributed to gas-rich disks (Furlan et al., 2006). The ages of CTTS disks (0.1 – 12 Myr; Isella et al. 2009; Kastner et al. 2008) indicate that the gaseous processes contributing to their observational characteristics are contemporaneous with and likely intimately connected with giant planet formation, which is thought to be mostly completed on similar timescales (Alibert et al., 2005). Terrestrial planet formation is thought to occur on timescales of 10 – 100 Myr (Kenyon & Bromley, 2006), when the majority of the primordial gas is in the disk has been dissipated. Observations of the gas and dust in CTTS disks therefore probe the physical and chemical state of gas giant forming protoplanetary systems.
Multi-wavelength spectroscopy is a powerful tool for making quantitative measurements of the dust and gas in these systems. Dust in protoplanetary disks is seen most clearly through the mid- and far-infrared (IR) excess flux produced by warm grains (Furlan et al., 2006), which overwhelms the narrow molecular lines when observed at low-resolution (Najita et al., 2010). Emission from hot gas is produced by magnetic activity in the atmospheres of the central stars and the accretion shocks near the stellar surface (Johns-Krull et al., 2000; Ardila et al., 2002), while the protoplanetary material itself can be probed through molecular observations of these systems. Protoplanetary disks have a multi-phase physical structure (see, e.g., the reviews by Woitke et al. 2009 and Dullemond & Monnier 2010) seen in molecular line observations from the far-UV to the millimeter. Dutrey (2001) reviewed the mm-wave CO measurements of outer protoplanetary disks, but understanding the complex CO excitation structure with radius requires additional tracers of the bulk molecular material within 100 AU of the star (Greaves, 2004). Emission from OH, CO, CO2, H2O, and other biologically important species have been used to trace warm gas ( few 102 – 2000 K) in the inner disk (Najita et al., 2003; Salyk et al., 2008; Bethell & Bergin, 2009).
Metal-bearing molecules trace molecular hydrogen (H2), the primary constituent of gas giant planets. However, H2 can be observed best in the far-UV (912 – 1650 Å) bandpass, where the dipole-allowed molecular emission spectrum is primarily photo-excited (“pumped”) by stellar Ly photons (Ardila et al., 2002; Herczeg et al., 2002). The Ly-pumping route requires that the second excited vibrational level ( = 2) of H2 have an appreciable population, which requires that the molecules reside in a warm ( 2000 K) gas layer close to the star (Herczeg et al., 2006). Most likely, this photoexcited H2 is not physically associated with the bulk of the colder H2 that goes into planet formation. The homonuclear nature of H2 means that rovibrational transitions are dipole forbidden, making direct detection of the cool-H2 component observationally challenging. Electron-impact excitation has been suggested as a means of directly probing the H2 in the planet-forming regions of the disk (Bergin et al., 2004). This mechanism requires stellar X-rays to create a distribution of photoelectrons that pump the molecules into excited electronic states. The H2 then relaxes, producing a characteristic far-UV cascade spectrum of discrete emission lines and quasi-continuous spectral features during the dissociation of H2 (Ajello et al., 1984; Abgrall et al., 1997). Ingleby et al. (2009) proposed this mechanism to explain a portion of the low-resolution far-UV spectra from a sample of classical and weak-lined (low gas content) T Tauri stars observed with the Hubble Space Telescope-ACS and -STIS. Low-resolution and intermediate S/N in existing far-UV observations make it difficult to separate the electron-impact H2 signal from Ly-pumped H2, atomic emission, CO, and the underlying accretion continuum. We lump these emissions together under the term “continuum” due to their mostly unresolved structure in previous studies. Fortunately, the observational picture has improved dramatically with the installation of the Cosmic Origins Spectrograph (COS) on . -COS combines very low detector backgrounds with moderate spectral resolution ( 17 km s-1). The low background permits measurements of the true continuum shape, including an assessment of the contribution from a hot accretion continuum. The resolution of COS also permits the identification and separation of the spectral components, enabling a more robust comparison with models of the processes that govern the planet-forming regions of CTTS disks.
In this paper, we use COS to study in detail the far-UV continuum emission from these objects for the first time. We focus on two objects that we propose are prototypes for electron-impact H2 emission (V4046 Sgr) and continuum emission produced in the hot accretion shock (DF Tau). CO – band emission also contributes to the far-UV line and continuum spectrum in these systems. First results on CO emission will be presented in Paper II (K. France – in preparation). In §2, we describe the COS observations and data reduction. In §3, we describe empirical fits to the data and compare these fits with model H2 spectra. §4 describes our measurements of the collisionally excited H2 and accretion continua. We also discuss discrepancies between the new COS observations and predictions of our electron-impact H2 models. We then discuss in §5 the relevance of these processes to the physical state of the disk and the local far-UV radiation field. Finally, we present a brief summary of our work in §6.
2. Targets and Observations
DF Tau and V4046 Sgr are both binary pre-main sequence systems with gas-rich disks. DF Tau is composed of two early M stars (0.68 and 0.51 ; White & Ghez 2001) with an age estimated to be between 0.1 – 2 Myr (see Ghez et al. 1997 for a discussion). DF Tau A is thought to be the stronger contributor to the far-UV output from the system with a mass accretion rate approximately an order of magnitude greater than DF Tau B (Herczeg et al., 2006). The DF Tau disk is observed approximately edge-on ( 80 – 85°; Johns-Krull & Valenti 2001; Ardila et al. 2002). Emission from hot gas lines and Ly-pumped H2 have been studied using existing -STIS echelle and spectra (Ardila et al., 2002; Herczeg et al., 2006), and detailed analysis of the radiative transfer interplay between H I and H2 using COS will be presented by H. Yang (submitted). The 0.1 – 4.5 keV luminosity of DF Tau is 9 1029 erg s-1 (Walter & Kuhi, 1981). The outer disk has a dust mass 130 (Andrews & Williams, 2005) and mm-wave CO has been detected (Greaves, 2005). DF Tau shows evidence of a gas-rich inner disk (Najita et al., 2003), although a search for extended near-IR inner dust disk has returned a null detection (Karr et al., 2010).

| Object | R. A. (J2000) | Dec. (J2000) | Date | COS Mode | Texp (s) |
|---|---|---|---|---|---|
| DF Tau | 04h 27m 02.81s | +25° 42′ 22.1″ | 2010 January 11 | G130M | 4828 |
| DF Tau | 04h 27m 02.81s | +25° 42′ 22.1″ | 2010 January 11 | G160M | 5549 |
| V4046 Sgr | 18h 14m 10.49s | -32° 47′ 34.2″ | 2010 April 27 | G130M | 4504 |
| V4046 Sgr | 18h 14m 10.49s | -32° 47′ 34.2″ | 2010 April 27 | G160M | 5581 |
V4046 Sgr is a close binary comprised of two mid-K stars (0.91 and 0.87 ; Stempels & Gahm 2004) with a circumbinary disk at an intermediate inclination angle ( 35°, Quast et al. 2000; Rodriguez et al. 2010). It has an age between 4 – 12 Myr, depending on its possible membership in the Pic moving group (Quast et al., 2000; Kastner et al., 2008). It was studied as part of the pre-main sequence star atlas (Johns-Krull et al., 2000). While data reveal H2 emission from the Lyman and Werner levels, a search for mid-IR emission from cooler H2 has returned only upper limits (Carmona et al., 2008). The 0.45 – 6.0 keV luminosity is estimated to be 1 – 5 1030 erg s-1 (Günther et al. 2006; and §4.3). V4046 Sgr has a molecule-rich outer disk ( 110 , 40 ; Rodriguez et al. 2010), although the inner disk shows evidence of dust clearing (Jensen & Mathieu, 1997). The lack of near-IR excess categorizes V4046 Sgr as a “transitional” disk, although the ongoing accretion and far-UV molecular emission suggest that a molecular gas reservoir is present in the inner disk.
DF Tau and V4046 Sgr were observed with the medium resolution, far-UV (G130M and G160M) modes of COS on 11 January and 27 April 2010, respectively. They were each observed for a total of four orbits, with two orbits per grating. In order to achieve continuous spectral coverage and minimize fixed pattern noise, observations in each grating were made at four central wavelength settings (1291, 1300, 1309, and 1318 for G130M and 1589, 1600, 1611, and 1623 for G160M) in the default focal plane position (FP-POS = 3). This combination of grating settings covers the complete 1136 1796 Å bandpass at a resolving power of 18,000111The COS LSF experiences a wavelength dependent non-Gaussian form due to mid-frequency wave-front errors produced by the polishing errors on the primary and secondary mirrors; http://www.stsci.edu/hst/cos/documents/isrs/. Near-UV imaging target acquisitions were performed through the COS primary science aperture using MIRRORB. Table 1 provides a log of the COS observations acquired as part of this study. Table 2 summarizes relevant system parameters, including accretion diagnostics measured in this work. The data have been reprocessed with the COS calibration pipeline, CALCOS222We refer the reader to the cycle 18 COS Instrument Handbook for more details: http://www.stsci.edu/hst/cos/documents/handbooks/current/cos_cover.html v2.12, and combined with the custom IDL coaddition procedure described by Danforth et al. (2010). Figure 1 displays the combined 1140 – 1760 Å spectra of both systems. The flux units used on this and subsequent figures are FEFUs333see §1.1.2 of the Cycle 17 COS Instrument Handbook (1 FEFU = 1 10-15 ergs cm-2 s-1 Å-1) . We use multi-epoch archival optical data spectra as supporting observations of the spectral region around the Balmer break.
| Object | Spectral Type | Age | Inclination | log10 ()aaFor DF Tau, is the total 0.1 – 4.5 keV luminosity (Walter & Kuhi, 1981). For V4046 Sgr, is estimated for the total 0.45 – 6.0 keV luminosity (see §4.3). | Ref. | log10 (/)bb is the strength of the average interstellar radiation field, evaluated over the 912 – 2000 Å bandpass ( = 1.6 10-3 erg cm-2 s-1; Habing 1968). | log10() | log10(acc) |
|---|---|---|---|---|---|---|---|---|
| (Myr) | (erg s-1) | ( = 1 AU) | (erg s-1) | ( yr-1) | ||||
| DF Tau | M0.5 + M3 | 0.1 – 2 Myr | 80° | 29.9 | 1,2,3,4 | 6.8 | 30.26 | -7.1ccDetermined from the empirical relationship between C IV emission and the mass accretion rate, Eqn. (2) of Johns-Krull et al. (2000).
References: (1) Ardila et al. (2002), (2) Johns-Krull & Valenti (2001), (3) Ghez et al. (1997), (4) White & Ghez (2001), (5) Quast et al. (2000), (6) Stempels & Gahm (2004), (7) Kastner et al. (2008), (8) Rodriguez et al. (2010) |
| V4046 Sgr | K5 + K5 | 4 – 12 Myr | 35° | 30.0 – 30.7 | 5,6,7,8 | 5.6 | 29.25 | -7.9ccDetermined from the empirical relationship between C IV emission and the mass accretion rate, Eqn. (2) of Johns-Krull et al. (2000).
References: (1) Ardila et al. (2002), (2) Johns-Krull & Valenti (2001), (3) Ghez et al. (1997), (4) White & Ghez (2001), (5) Quast et al. (2000), (6) Stempels & Gahm (2004), (7) Kastner et al. (2008), (8) Rodriguez et al. (2010) |
3. Analysis
3.1. Emission from H2 and the Inner Accretion Disk
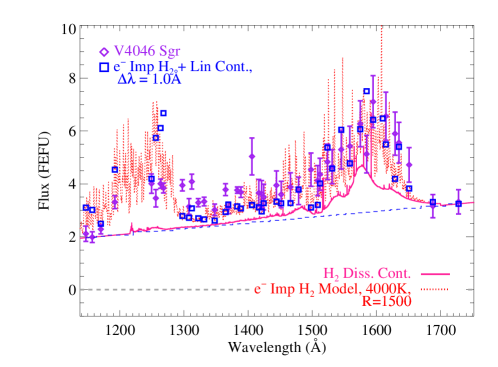
The strongest features in the far-UV spectra of DF Tau and V4046 Sgr are the emission lines from hot gas and photoexcited H2 (Figure 1). The hot gas lines (e.g., N V, Si IV, C IV, etc) are produced in the magnetically active atmospheres (Bouvier et al., 2007) of the central stars and at (or near) the shock interface where the accretion stream impacts the stellar surface (Günther & Schmitt, 2008). The strong, discrete Lyman and Werner band H2 lines are mostly fluoresced by H2 pumping transitions that coincide with the broad Ly profiles in the these systems, although coincidences with other stellar lines also contribute (Wilkinson et al., 2002; France et al., 2007). We see that the hot gas and photoexcited H2 lines are superimposed upon a mostly continuous, faint underlying emission spectra. Ingleby et al. (2009) argued that this emission is a combination of accretion luminosity from near the hot accretion spots and emission from electron-impact excited H2. The electron-impact H2 can be further decomposed into discrete bound-bound emission and quasi-continuous emission from dissociative transitions to the ground electronic state, which is characteristic of the electron impact process for electron distributions with energies 15 eV (Ajello et al., 1991). In both systems, there is also a contribution from CO emission which will be addressed in Paper II. In Figure 2, we show a breakdown of these components for V4046 Sgr. The accretion continuum is represented as the blue dashed line, and a model H2 spectrum is shown superimposed as a dotted red line. Because the vast number (several hundreds) of photoexcited H2 lines complicate the comparison of the broad band spectral characteristics of the data with the model, we isolate spectral regions that are free of known photoexcited H2 lines. These “continuum bins” have widths of 0.6 – 1 Å, and are shown as purple diamonds in Figure 2.
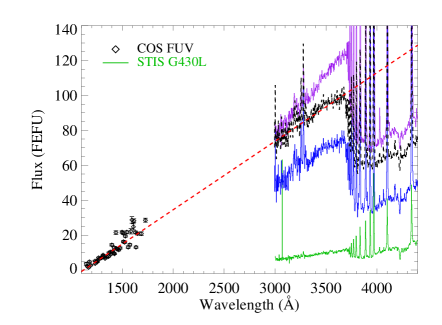
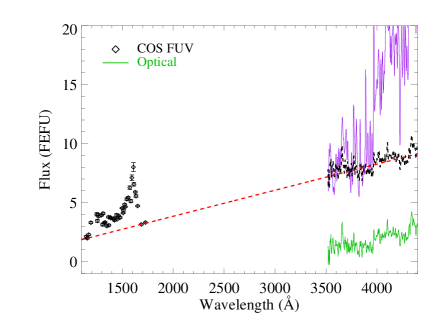
The “continuum” spectra of the two systems are qualitatively different. Figure 3 () shows the continuum spectrum of DF Tau, corrected for reddening ( = 0.6; Herczeg & Hillenbrand 2008) using the interstellar curve of Cardelli et al. (1989). The far-UV data show a mostly linear rise with wavelength that we attribute to accretion emission. We show a linear fit to the data as the dashed red line and several optical spectra of DF Tau, representative of the high (purple), intermediate (blue), and low (green) states of the object. We include a scaled version of the intermediate spectrum as the dashed black line to illustrate that the linear fit to the far-UV data could account for the observed continuous spectrum of DF Tau below the Balmer break (see §4.2 for a discussion of the spectral shape of this emission). We attribute the dispersion of the far-UV points at 1500 Å to contamination by unresolved H2 lines (both photo- and electron-excited), CO band emission, and the lower S/N data at the red end of the far-UV bandpass where the COS effective area decreases. The V4046 Sgr spectrum includes emission with a shape qualitatively similar to that expected for electron-impact excited H2 (see Figure 3, ). As we illustrated in Figure 2, this emission is superimposed upon an underlying linear continuum. We do not make an extinction correction for V4046 Sgr because is negligible (Stempels & Gahm, 2004). We consider DF Tau as an example of a CTTS with hot accretion emission and V4046 Sgr as representative of a CTTS with electron-excited H2. In the following subsections, we describe the modeling procedure we used to develop synthetic H2 spectra for a quantitative analysis of the electron-impact spectrum. The characteristics of each process are considered in more detail in §4.
3.2. Synthetic Electron-Impact H2 Spectra
We created synthetic electron-impact H2 spectra for comparison with the COS observations following the formalism described by Liu & Dalgarno (1996) and Wolven et al. (1997). Our spectral synthesis code includes emission from photoexcited H2 (France et al., 2010b), but we have decoupled the various emission components in order to study separately the discrete and quasi-continuous emission spectrum from collisionally excited H2. We describe the calculation of electron-impact spectra here. The model includes emission from the – , – , – , – , – , and – electronic transitions, including Lyman band populations coming from – cascades. We explicitly include transitions to predissociating states and vibrational states that result in dissociation ( 14, the vibrational continuum) and independently save the dissociation spectra. Transition probabilities and wavelengths for the , , , and were taken from the literature (Abgrall et al., 1993a, b, 1994), the and parameters were calculated by combining the branching ratios of the and states with the appropriate energy level spacings (Kwok et al., 1985; Glass-Maujean, 1984; Huber & Herzberg, 1979). We computed transition probabilities for the and cascades using the Franck-Condon factors presented by Lin (1974). The emission rate from level of to level of the ground electronic state is given by
| (1) |
where is the excitation rate into the excited electronic level, is the efficiency for predissociation in the excited electronic state, and the ratio of transition probabilities () is the branching ratio (Liu & Dalgarno, 1996).
The excitation rate, , is proportional to the column density in the ground electronic state, , the cross-section connecting the ground state to the rovibrational level of the excited electronic state, , and the electron flux, (Liu et al., 1998),
| (2) |
Given the uncertainties about the source of the free electrons and their geometry with respect to the spatial distribution of the H2, we do not attempt to reproduce the absolute flux of the electron-impact emission in this work. Thus the electron flux can be assumed to be a scale factor.
The cross-sections can be measured experimentally, but as we are not solving for the absolute flux of the electron-impact emission lines in the spectra of V4046 Sgr, we follow the procedure described by Liu et al. (1998) and calculate relative excitation rates described by the equation
| (3) |
where is the electron energy, is the degeneracy of the ground electronic state, and is the collision strength given by the analytic expression presented in Eqn (4a) of Liu et al. (1998).
For simplicity, we assume a single population of collisionally excited gas. We input the ground state thermal temperature [], the column density [], and the electron energy. We created a grid of models in [,,]-space, including ten temperatures between 300 – 5000 K, five column densities in the range 1016 – 1020 cm-2, and ten electron distributions in the range 14 – 5000 eV. The lower limit at 14eV is set by the minimum energy needed to populate the , , and levels in our model. Numeric errors occur when these states are not appreciably populated. Physically, the absolute cross-sections for electron excitation into the Lyman and Werner bands are very low at 14eV, with 3 10-18 cm2 at 12eV (compared to 2 10-16 cm2 at 20 200eV; Liu et al. 1998).
| Line IDaa denotes a Lyman band ( – ) transition, denotes a Werner band ( – ) transition. | Pumping TransitionbbH2 lines excited by the broad stellar H I Ly emission line, unless otherwise noted. | |||
|---|---|---|---|---|
| (Å) | (Å) | (Å) | ||
| (1 – 4) P(10) | 1193.37 | 1193.34 | (1 – 5) R(8) | 1214.62 |
| (4 – 1) P(14) | 1197.15 | 1197.14 | (4 – 2) R(12) | 1213.68 |
| (1 – 4) P(11) | 1198.00 | 1197.99 | (1 – 5) R(9) | 1217.00 |
| (1 – 2) R(3) | 1202.44 | 1202.45 | (1 – 2) P(5) | 1216.07 |
| (3 – 0) P(17) | 1203.24 | 1203.24 | (3 – 1) R(15) | 1214.47 |
| (1 – 5) R(3) | 1205.53 | 1205.53 | (1 – 5) P(5) | 1216.99 |
| (1 – 5) Q(3) | 1208.90 | 1208.93 | (1 – 1) Q(3)ccPumped through a coincidence with the stellar O VI 1032 Å resonance line. | 1031.86 |
| (3 – 6) P(17) | 1249.99 | 1250.00 | (3 – 5) P(17) | 1216.74 |
| (4 – 8) R(12) | 1252.05 | 1252.10 | (4 – 7) R(12)ddThe observed line may contain additional H2 fluorescence excited through coincidence with H I Ly and/or Si III 1206.50 Å. | 1220.47 |
| (4 – 4) R(3) | 1253.63 | 1253.67 | (4 – 3) P(5) | 1214.78 |
| (1 – 6) Q(3) | 1254.11 | 1254.11 | (1 – 1) Q(3)ccPumped through a coincidence with the stellar O VI 1032 Å resonance line. | 1031.86 |
| (4 – 8) P(8) | 1255.55 | 1255.56 | (4 – 7) P(8) | 1219.95 |
| (1 – 3) R(3) | 1257.81 | 1257.83 | (1 – 2) P(5) | 1216.07 |
3.3. Comparing the H2 Models with the V4046 Sgr Spectra
The model spectra computed on a 0.01 Å grid are convolved with the appropriate COS linespread function (LSF) for comparison with our spectroscopic observations. The electron-impact spectrum of H2 consists of both discrete and quasi-continuous emission features. The continuum features are strongest at 1350 Å (Abgrall et al., 1997), while the electron-impact spectral energy distribution is mostly discrete at the blue end of the COS bandpass ( 1300 Å). Figure 2 shows the qualitative agreement of the V4046 Sgr data with the H2 model, and we anticipate that a broad-band minimization approach can be used to estimate the H2 parameters of the system.
In order to explore what additional processes should be included in the models prior to fitting the data, we compare the broad spectral colors with the intrinsic color ratio () used to characterize electron penetration into gas giant atmospheres, Å)/ Å) 1.1 (Yung et al., 1982; Gustin et al., 2006), where
| (4) |
and is the electron-impact H2 flux. Confusion from the overlap with hundreds of strong photoexcited H2 emission lines in the CTTS spectra forced us to evaluate the data in 1 Å bins, as described in §3.1. Using this binning, we find an intrinsic model color ratio of 1.3444However, when our models are evaluated over the entire “blue” and “red” bandpasses for reasonable input parameters, we find that the total integrated flux is actually slightly greater is the sub-1400 Å band [ Å) Å)], which is a consequence of the large contribution from discrete features. This qualitative result is true for our model spectra over a wide range of physical parameters, that is, the “blue” and “red” fluxes are approximately equal. . The observed color ratio in V4046 Sgr is = 2.1 0.2, indicating that the observations are significantly redder than their intrinsic colors. Jovian color ratios in this range are typically interpreted as internal reddening in the upper atmosphere (Dols et al., 2000; Gustin et al., 2006).
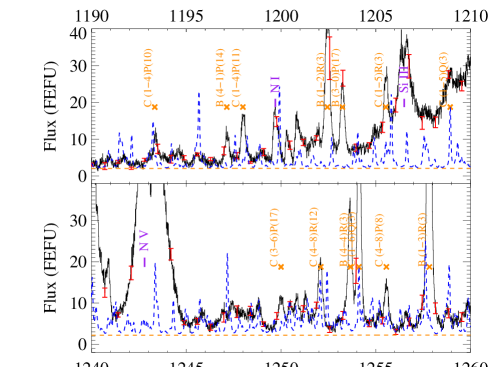
The model predicts the spectrum of the discrete lines that have been observed in short-wavelength far-UV spectra of the gas giant planets (Gustin et al., 2004, 2009). As a first-order check on the discrete lines, we compare in Figure 4 a section of the full-resolution COS G130M data with an electron-impact H2 model. The model, overplotted as the dashed blue line, assumes parameter values typical of previous electron-impact studies of CTTS disks [(H2) = 1019 cm-2, (H2) = 4000K, = 20eV], although this electron distribution has a slightly higher energy than those favored by Ingleby et al. (2009). We discuss the electron energy distribution in §4.3. Figure 4 shows that many discrete features predicted by the model are not seen in the data. Because of this disagreement and the reddening of the broad-band colors, we conclude that calculations of electron-impact spectra taken from the literature are alone inadequate for direct comparison with the COS observations. In the following subsections, we therefore develop a more detailed physical picture that produces agreement with both constraints provided by the observed H2 spectrum. Table 3 presents a list of the photoexcited H2 lines identified in Figure 4.
3.3.1 H2 Self-Absorption
A strong motivation for studying the electron-impact excited H2 spectrum in protoplanetary disks is that the more easily observable Ly-pumped H2 emission is likely produced on the surface of the disk (Herczeg et al., 2006), whereas the X-rays needed to produce the non-thermal electron population can penetrate deeper into the planet forming region (Bergin et al., 2004; Ingleby et al., 2009). Thus, the electron-impact excited gas may be a useful probe of the molecules that are in the actively planet-forming regions of the disk. The role of radiative transfer in determining the resulting UV spectrum measured at Earth has been considered for radiative excitation of H2 in the disk surface (Herczeg et al., 2004) but not for the collisionally excited H2 in the inner disk. We first consider reddening by dust. We discount strong internal reddening because grains in the disk have likely grown appreciably during the few Myr age typical of CTTS disks (Furlan et al., 2005; Apai et al., 2005), and there is evidence that large grains produce a relatively “gray” extinction across the far-UV bandpass (Fitzpatrick & Massa, 1988; Cardelli et al., 1989). Grain growth and settling has also been shown to significantly reduce the overall opacity to UV photons in disks older than 1 Myr (Vasyunin et al., 2010). Also, if these inner disk grains play a large role, they must also extinguish stellar emission in edge-on systems, which is clearly not the case (e.g., the strong continuum and hot gas lines are observed in DF Tau).
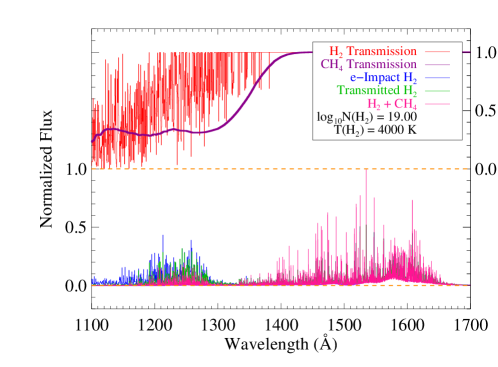
An effect that must be considered is self-absorption by H2 in the outer layers of the disk. At first consideration, it seems plausible that H2 photons emitted in the disk plane are re-absorbed before they can escape. This would naturally explain both the red and the absence of discrete emission features because self-absorption would remove individual lines from the resultant emission spectrum, thereby reddening the model spectrum. As cool H2 [(H2) 700 K] has appreciable optical depth only in the first few rotational levels ( 6), this gas will not produce significant absorption out of excited vibrational levels. This cool H2 resembles the well-studied spectrum of H2 in interstellar clouds (e.g., Rachford et al. 2002; Burgh et al. 2007) and cannot provide appreciable opacity in the COS bandpass ( 1150 Å). A population of hot H2 [(H2) 2000 K] would be required. We have tested this hypothesis by creating a tunable absorbing “screen” of H2 that will attenuate the radiation produced by the electron-impact model. We created H2 absorption spectra for 2000 (H2) 5000 K by calculating the Boltzmann distribution for the ground electronic state and used the H2 optical depth templates from McCandliss (2003) to compute transmission functions as a function of temperature and column density. We included all rovibrational states in the range (0 14) and (0 3). Even larger temperatures would be required to thermally populate higher states, but we do not consider such temperatures because they are significantly above the 4500 K H2 dissociation temperature (Lepp & Shull, 1983). Figure 5 shows the transmission function of H2 in red at the top, while the intrinsic () and transmitted () H2 emission spectra are shown at the bottom.
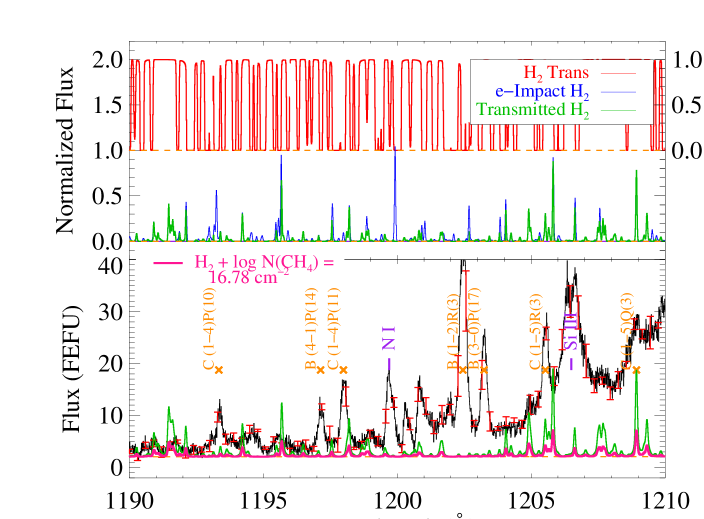
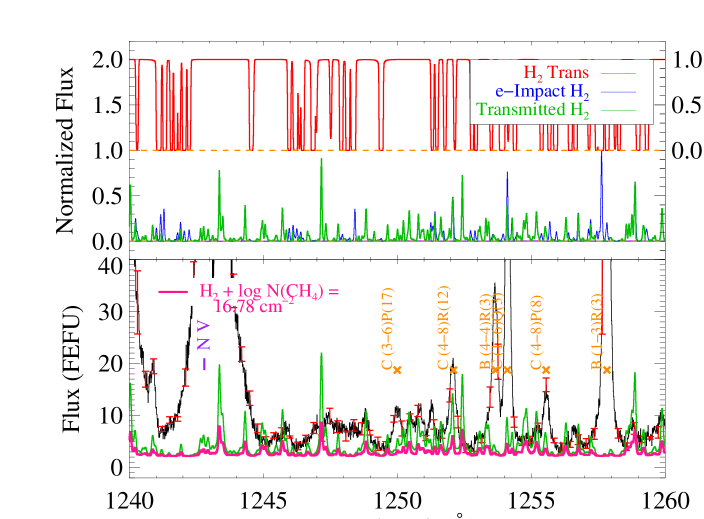
In general, we find that H2 self-absorption is insufficient to account for the color and discrete feature discrepancies described in §3.3. Our results for H2 self-absorption of discrete lines are shown as illustrative examples in Figure 6 for typical temperatures [(H2) = 4000K] and column densities [(H2) = 1019 cm-2] obtained by Ingleby et al. (2009). The top panels of Figure 6 show the computed H2 transmission spectrum in red, the unattenuated electron-impact model in blue, and the transmitted H2 spectrum in green. We find that while several of the transitions are indeed completely absorbed, many of the strongest transitions are transmitted. It is these emission lines that we would expect to observe. The lower panels of Figure 6 show that these emissions are not observed, even though the COS sensitivity curve peaks in the 1250 Å window displayed in Figures 4 and 6. The primary reason that self-absorption alone cannot explain the discrepancy is that the H2 population created by electron-impact is highly non-thermal, whereas upper layers of the disk are mostly described by a warm thermal distribution (2000 (H2) 3000 K; Herczeg et al. 2006) with deviations caused by UV photoexcitation. We conclude that while H2 self-absorption must be included, it is not the dominant factor in determining the shape of the emitted electron-impact H2 spectrum in V4046 Sgr.
3.3.2 Hydrocarbon Absorption
In the previous section, we discussed the contribution of dust and H2 self-absorption to the spectral characteristics of the observed spectrum of V4046 Sgr; in particular, that the long-wavelength ( 1450 Å) continuum could be described by emission from H2 excited by non-thermal electrons, but there is a lack of discrete emission lines at shorter wavelengths. We have determined that neither dust nor H2 self-absorption can attenuate synthetic electron-impact H2 spectra to the extent observed.
We now consider absorption by more complex molecules, CO, H2O, and hydrocarbons. We first assume that the electron-excited H2 is located in the disk and that the H2 emission must pass through a “screen” of these more complex molecules to reach an external observer. We require that the attenuating screen removes the short-wavelength H2 emission, but not the flux at longer wavelengths. While CO is observed in UV spectra of CTTS disks (e.g., Paper II), the – spectrum that is the most prominent CO feature at far-UV wavelengths has a characteristic band structure. Even for very high temperatures, the interband spectral regions have low opacity. As a simple quantitative test for the importance of CO absorption within the disk, we created a template CO optical depth spectrum for column density (CO) = 1017 cm-2 at = 1000 K, with spectral binning of 0.05 Å. Even for this warm, high column density medium, we find that only approximately 7% of the spectral bins have 0.1. Thus, there are ample low-opacity windows through which the underlying H2 spectrum can escape. A similar argument can be made for the spectrum of water. Laboratory studies have identified individual vibrational modes of the H2O Rydberg series in the 6 – 11 eV energy region (Mota et al., 2005). The far-UV cross-sectional spectrum is characterized by strong bands in the 9.9 – 10.8 eV (1250 1150 Å) region where we require substantial attenuation of the H2 electron-impact spectrum. However, because the interband spectral regions have cross-sections of 2 10-18 cm-2, very large column densities of water would be required for attenuation of the electron-impact H2 emission which is thought to be produced in the inner disk (Bergin et al., 2004). The required column densities needed to reach 1 are larger than those found in observational and model studies of H2O in the mid-IR spectra of protoplanetary disk systems (Carr & Najita, 2008; Bethell & Bergin, 2009). Finally, H2O has a prominent absorption band in the 7 – 8 eV range (Diercksen et al., 1982; Mota et al., 2005), which is coincident with the broad 1575, 1608 Å spectral features characteristic of electron-impact excitation of H2. This dissociative H2O absorption feature has absolute cross-sections that are comparable to or stronger than those in the short-wavelength windows described above. Thus water column densities high enough to attenuate the bluest wavelengths in our data would also eliminate the flux at 1600 Å, which is not observed.
We suggest that a more likely scenario involves the absorption of H2 emission by hydrocarbons in the planet-forming disk. This scenario is analogous to what has long been observed in far-UV auroral spectra of gas giant planets: a mostly electron-impact H2 spectrum that is “reddened” by hydrocarbon absorption, mostly from methane, ethane, and acetylene (CH4, C2H6, and C2H2; Clarke et al. 1980; Yung et al. 1982). In particular, CH4 and C2H6 have absorption cross-sections that meet the required criteria: () strong ( 10-17 cm-2), quasi-continuous absorption below = 1400 Å, and () negligible effect on the output spectrum ( 10-18 cm-2) at the long-wavelength end of the COS bandpass. In the Jovian atmosphere, methane is often assumed to be the most important species regulating the broad-band far-UV spectral signature of H2 (Kim et al., 1997; Grodent & Gérard, 2001). We compute the total methane opacity required to match the observed flux limits from the non-detection of discrete H2 electron-impact features in the COS data at 1300 Å. We first scaled the 1575 – 1608 Å model emission spectrum to match the observed flux. We then included self-absorption following the procedure described above, and then applied a methane transmission function to the data. We find that (CH4) 6 1016 cm-2 is sufficient to attenuate the short-wavelength discrete features within the errors of the observed V4046 Sgr data. The relative abundances of the hydrocarbons in the disk are unknown, and a similar exercise assuming a purely ethane screen requires (C2H6) 4 1016 cm-2. The difference is due to the somewhat larger cross-sections of ethane in the 1140 – 1300 Å bandpass.
We caution the reader that our assumption of pure methane absorption in the disk was chosen by analogy to planetary atmospheres. Although protoplanetary disks are the building blocks of these atmospheres, the analogy is uncertain. We do not have a strong observational constraint on the choice of methane over ethane, although the former is almost always found to be the dominant source of far-UV attenuation in the Jovian atmosphere (Dols et al., 2000). A combination of hydrocarbons is undoubtedly a more likely model, and there may also be additional species that we have not considered in the present analysis. Whatever the exact makeup of the disk, some sort of absorbing screen is required if the usual assumption that H2 electron-impact emission is a combination of bound-bound and dissociative transitions is valid in these disks. Modeling the far-UV radiative transfer in these disks is required to obtain a more quantitative understanding of the spectra we now routinely observe with -COS.
4. Discussion
4.1. Electron-Impact H2 Emission in V4046 Sgr
In §3.3, we described how the 1400 Å discrete emission lines from the electron-impact H2 excitation cascade are absorbed and/or scattered out of the line-of-sight. In order to measure the properties of the collisionally excited H2 spectrum, we performed a minimization analysis to compare the binned V4046 Sgr data at 1400 Å with the grid of electron-impact H2 models described in §3.2. The free parameters are [(H2), (H2), ] and a linear fit to the underlying continuum, which we will discuss in the following subsection. We find that the electron-impact excited H2 has a temperature of = 3000 K, a column density of (H2) 1018 cm-2, an electron energy of 50 – 100 eV, but the only firm constraint is on the temperature. By restricting the fits to 1400 Å, we avoid the 1200 – 1300 Å region where our models predict a dependence on (H2). We find a minimum near 50 – 100 eV, but higher energies are generally consistent with the data for (H2) = 1016-19 cm-2. In Figure 7, we show representative fits to the 1400 Å data. We find that the best fit parameters not only display the lowest reduced , but they also show reasonable fits to the eye. For comparison, we also display a low energy case ( = 14 eV).

A major complication to all of these fits is the spectral overlap between the electron-impact emission spectrum of H2 and CO – band emission. With our broad binned approach, we can avoid strong discrete lines from the stellar atmosphere and accretion shock, as well as photoexcited H2. The CO emission is distributed in wide vibrational band structures with non-zero intraband flux. Using the binned continuum bands described above, we necessarily include CO emission. We will present models of this emission in Paper II. For now, we note that the strongest contaminant to the pure H2 electron-impact spectrum is the CO (0 – 1) 1597 Å band that fills in the spectral valley between the H2 emission peaks at 1575 and 1608 Å. This excess emission tends to push the fits to higher temperatures, where the dissociation continuum broadens, or to very low electron energies ( 14 eV), where dissociation is less important. This may explain some of the discrepancies between our results and the best-fit parameters [ 5000 K; 12 eV] presented by Ingleby et al. (2009).
4.2. Accretion Continuum
Figure 3 shows the spectra of our targets from the far-UV to the optical. The black dotted optical spectrum has been scaled from an archival observation to show that the linear fit to the far-UV data alone (dashed red line) can plausibly also describe the shape of the 3600 Å Balmer continuum used to measure the accretion rates in low-mass pre-main sequence stars with disks (Calvet & Gullbring, 1998; Herczeg et al., 2009). We fit the far-UV spectra with both a power-law and a straight line. For both spectra a simple linear fit of the form = + produced the best match to the data. We find [,] = [0.0393, -44.0250] and [0.0026, 0.0918] for DF Tau and V4046 Sgr, respectively, where the units of and are FEFU Å-1 and FEFU, where 1 FEFU = 1 10-15 erg cm-2 s-1 Å-1. The linear slope for DF Tau is 15 times that found for V4046 Sgr. While DF Tau is known to have a much larger accretion rate (2 acc 1300 10-9 yr-1; Hartigan et al. 1995; Herczeg et al. 2006; Herczeg & Hillenbrand 2008) than V4046 Sgr (acc 3 10-11 yr-1; Günther and Schmitt 2007) a direct comparison between accretion rates from the literature and the far-UV accretion continuum slopes is unreliable given the different measurement methods and temporal variability.
We can estimate the mass accretion rates directly from the COS observations using empirical scaling relations between the C IV luminosity () and acc. The largest systematic source of uncertainty to this approach is the relative contribution from the stellar transition region emission to the observed C IV profile. We use equation 2 from Johns-Krull et al. (2000) to estimate the mass accretion rate in these systems at the time of our continuum observations, assuming that the C IV surface flux in excess of a saturated stellar component ( 106 erg cm-2 s-1) is produced at the accretion shock.
We fit the C IV profiles with a multi-component line-profile employing the appropriate COS LSF. Assuming distances of 140 and 70 pc for DF Tau and V4046 Sgr, respectively, we find total = 1.81 0.09 1030 erg s-1 and 1.76 0.04 1029 erg s-1. The error bars are the measurement errors, which are very small for these bright lines. These are the time-averaged luminosities over the total G160M observing time. The C IV fluxes were found to be slowly varying over the 3 hours of G160M exposures. We measure C IV count rate changes of +7.0 and -13.6% for DF Tau and V4046 Sgr from the COS microchannel plate two-dimensional spectrograms, evaluated in 50s time intervals.
These C IV luminosities can be explained by mass accretion rates of 7.8 10-8 yr-1 and 1.3 10-8 yr-1 for DF Tau and V4046 Sgr, respectively. While our accretion rate for DF Tau is only slightly larger than the range quoted by Herczeg & Hillenbrand (2008), our measurement for V4046 Sgr is considerably larger than the value quoted by Günther & Schmitt (2007). The large discrepancy with the Günther & Schmitt (2007) accretion rate may be attributable to a larger contribution from transition region C IV in V4046 Sgr, however it seems unlikely that values of the mass accretion rate as low as acc 3 10-11 yr-1 are consistent with our observations of V4046. This is not entirely surprising as CTTS mass accretion rates based on X-ray observations typically differ from optical/UV determinations by more than an order of magnitude due to absorption in the high-density regions where shock X-rays are produced (see e.g., Sacco et al. 2010 and references therein). The relevant accretion measurements are given in Table 2.
We suggest that future observations for which far-UV, near-UV, and optical observations are obtained in close time proximity are required to measure accurately both the far-UV continuum and the accretion rate from the Balmer continuum. These observations will tie together the observed far-UV accretion continuum in these objects with the well-calibrated accretion rate diagnostic.
4.3. Outstanding Issues Regarding Electron-Impact Excitation of H2
There is some uncertainty in the assumption that electron-excited H2 is the dominant molecular continuum emission mechanism for V4046 Sgr and other young circumstellar disks. Our models and analysis support a picture in which intermediate energy electrons excite H2 in the inner disk, which then radiates and is observed superimposed upon an underlying continuum from the accretion shock. Since X-rays are invoked to create the photoelectrons (Draine, 1978) needed to collisionally excite the H2, we must ask if X-rays are sufficient for this mechanism to operate. We can measure the total flux from electron-excited H2 in V4046 Sgr, 8 4 10-13 erg cm-2 s-1 (approximately 2 the integrated 1400 – 1660 Å H2 flux shown in Figure 7 in order to account for the implied 1400 Å emission, §3.3). If we assume an inner disk electron-impact H2 emitting region (0.2 0.5 AU; see §5.2 for additional discussion), the collisionally excited H2 luminosity is 9 5 1028 erg s-1, or 6 3 1039 photons s-1 for a fiducial H2 wavelength of 1400 Å.
High resolution spectra of V4046 Sgr show that the accretion shock flux is approximately half of the observed value in TW Hya (Günther et al., 2006; Güdel & Telleschi, 2007). Scaling from the observed 0.45 – 6.0 keV X-ray luminosity () of TW Hya (Kastner et al., 2002), we estimate the total X-ray luminosity for V4046 Sgr is 1 – 5 1030 erg s-1, or 0.6 – 3 1039 photons s-1 for a fiducial X-ray energy of 1 keV. 1 keV is the approximate peak energy of the V4046 Sgr X-ray spectral energy distribution (Günther & Schmitt, 2007). The grain photoelectric yields for the sub-micron sized grains that are present at the inner edge of transitional dust disks (Eisner et al., 2006) are of order unity for photons with 1 keV (Weingartner et al., 2006). Thus, we find that V4046 Sgr produces sufficient X-ray luminosity to create enough photoelectrons to excite the observed H2 emission from the inner disk.
While this electron-impact H2 interpretation is energetically plausible for the observed emission, it may not be adequate to describe the full far-UV emission spectrum of V4046 Sgr. Absorption by a hydrocarbon screen appears to reproduce both the observed absorption of the short-wavelength discrete lines and the unobscured H2 emission at 1400 Å, but verification of this result requires additional study. A more speculative scenario involves a very high column density, high temperature self-absorbing screen of H2 that could produce nearly continuous absorption in the COS G130M band while not absorbing the long wavelength emission arising from dissociative transitions. Another possible scenario is a “non-traditional” electron-impact H2 emission process in which dissociative yields of order unity are achieved. This process would produce the quasi-continuous long wavelength emission without most of the energy being distributed among the discrete states of the Lyman and Werner bands. As the canonical H2 dissociation fraction from the Lyman and Werner bands is 0.15 (Stecher & Williams, 1967; Shull & Beckwith, 1982; Abgrall et al., 1997), large dissociative yields would require substantially fine-tuned molecular and electron distributions. It seems unlikely that either of these scenarios are physically possible. The other prominent long-wavelength emission source in these disks is CO, although CO alone probably cannot account for the observed far-UV molecular spectra of CTTS disks.
We point out that a spectrograph such as COS is essential for a comprehensive analysis of such systems. The low background and high-sensitivity are both important because the continua in these systems have characteristic flux levels of a few 10-15 erg cm-2 s-1 Å-1 or less. Moderate spectral resolution is also required for the detection of individual discrete lines predicted by electron-impact models. Moreover, when protoplanetary systems are observed heavy internal reddening, spectral coverage at 1300 Å is important because this region probes the discrete line emission from the Werner bands of H2 whose spectrum is a more sensitive diagnostic of the electron energy distribution. Without this wavelength region, spectral fits to the data will not account for the Werner lines, biasing the results toward very low energy electron distributions. As the threshold energies for the Lyman and Werner bands are 11.37 and 12.41 eV (Ajello et al., 1984), respectively, Lyman band continuum emission in the absence of discrete Werner band lines requires a highly-tuned electron distribution. Because Ly production from the dissociation of H2 drops sharply at 14.7eV (Ajello et al., 1991), discrete lines should be even more important relative to the continuum at very low electron energies.
Herczeg et al. (2006) presented high-quality -STIS E140M observations of DF Tau. While the spectral resolution of these data is sufficient to analyze the brighter Ly pumped H2 emission, the accretion and H2 continua are too confused by the instrumental noise floor to make a clear separation. Conversely, Ingleby et al. (2009) presented a large sample of CTTS targets using the ACS-SBC, but the low spectral resolution makes the detection of discrete molecular features impossible. Neither of these instruments has sufficient throughput in the 1300 Å band to measure the Werner emission lines of H2.
5. Probing the Far-UV Radiation Environment and Molecular Gas of Inner CTTS Disks
5.1. The 912 – 2000 Å Radiation Field and Molecular Dissociation
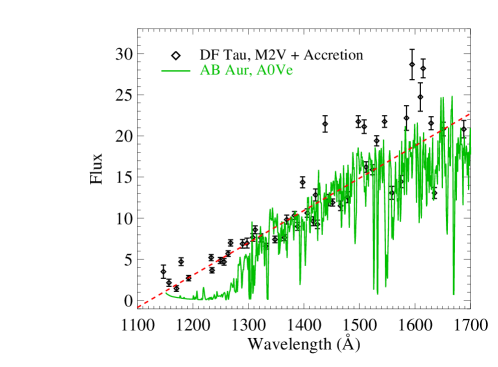
The high sensitivity and spectral resolution of COS allows us to isolate the accretion shock continuum in pre-main sequence circumstellar disk systems. This higher temperature continuum radiation field is similar to that discussed for longer wavelengths by Calvet & Gullbring (1998) and the multi-component fit to the UV spectrum of TW Hya by Costa et al. (2000). In Figure 8, we show the continuum spectrum of DF Tau, whose central object is an M2 binary system (see §2), with a photospheric temperature of 3500 K (Hartigan et al., 1995; Johns-Krull et al., 2000). The effective temperature of the accretion emission in DF Tau is 104 K, which creates a local radiation field in the planet-forming region of the disk with a shape similar to that of a Herbig Ae star. To illustrate this point, we compare the scaled -STIS spectrum of AB Aur in Figure 8 () with the binned DF Tau continuum spectrum. AB Aur and DF Tau have similar ages. AB Aur is known to be surrounded by a molecule-rich disk (H2 and CO; Roberge et al. 2001), and there is evidence that planets are forming in the system (Oppenheimer et al., 2008). A critical difference between DF Tau and AB Aur (spectral type A0Ve, 104 K) is the temperature of the UV radiation field.
The accretion radiation detected down to = 1147 Å with high confidence provides strong evidence for continuum emission at wavelengths down to the Lyman limit555The fit to the DF Tau data reaches zero at 1122 Å, but this is clearly an artificial cut-off imposed by the simple linear model. The data show appreciable continuum flux above the linear fit at 1200 Å. . The shape and intensity of this far-UV radiation field have a significant impact on the evolution of a protoplanetary disk (van Dishoeck et al., 2008). In particular, dissociation of the most abundant species is controlled by photons in this critical 912 – 1150 Å wavelength region. H2 is photodissociated through a two-step process (Stecher & Williams, 1967) starting with absorption into the Lyman bands at 1108 Å (Carruthers, 1970), extending to longer wavelengths for rovibrationally excited molecules. The first strongly predissociating CO absorption system is the – band at 1076 Å (van Dishoeck & Black, 1988), with shorter wavelength far-UV transitions dominating the dissociation as radiative transfer effects become important deeper into the disk. The dissociation of H2 and CO molecules produce species that can catalyze the chemistry throughout the inner disk, including neutral H, vibrationally excited H2 (H), neutral and ionized C, and O. This suggests that the boundary regions where the far-UV continuum penetrates the higher density molecular disk could be considered photodissociation regions (PDRs). Far-UV continuum emission will contribute to the dissociation of water (as discussed in §3.3.2), which is relevant for both giant planet formation and the terrestrial planet formation stages that follow. Further out in the disk, this emission will control the photodissociation rate of C2H and H2CO, which modify the molecular abundances at larger radii (van Zadelhoff et al., 2003).
Far-UV continuum emission has been considered before in low-mass protoplanetary disk models, but some models assume that the 1400 Å flux is dominated by the interstellar radiation field (ISRF) and stellar emission lines. We present, however, evidence that the absolute flux of the far-UV continuum is several orders of magnitude greater than the ISFR. Integrating the continuum fits (shown in Figure 3) over the far-UV bandpass (912 – 2000 Å), we find that the absolute strength of the far-UV continua are 105-7 times the interstellar value ( 1.6 10-3 erg cm-2 s-1; Habing 1968). Assuming distances of 140 and 70 pc for DF Tau and V4046 Sgr, we find log10() = 6.8 and log10() = 5.6, respectively, at 1 AU. We note that this is only 912 – 2000 Å accretion continuum radiation field strength, not including the flux from atomic emission lines. Our radiation field estimates are consistent with the CTTS UV intensities calculated for 100 AU by Bergin et al. (2004).
One caveat is that this A-star-like accretion emission may not be present at all times, or at least not at the flux levels we observe. Figure 3 shows that optical activity may be a good proxy for the level of far-UV continuum. Thus the far-UV accretion emission is most likely variable, while the external field provided by the ISRF is constant.
5.2. Physical Conditions of the Molecular Gas in the Inner Disk
We find that the electron-impact excited H2 population in V4046 Sgr is characterized by (H2) 1018 cm-2 and (H2) 3000 K. This temperature is high but is not unreasonable for the inner region of an X-ray irradiated disk (Meijerink et al., 2008). These authors find that this temperature can be maintained in the inner 20 AU of the disk, consistent with H2 emission excited by photoelectrons produced by the X-rays (Bergin et al., 2004). While the outer radius of the collisionally excited H2 may be as large as 20 AU, we suggest that this process operate much closer to the central object, most likely 1 AU (Ingleby et al., 2009). The average width of the photo-excited H2 lines listed in Table 3 is 52 8 km s-1, with evidence of double peaked structure in the highest S/N lines. While some of this width may be due to turbulent motions within the disk, this suggests a concentration of photoexcited H2 at 0.19 AU, for = 35° and the simple assumption of a Keplerian disk where = (/)1/2.
If this is the inner edge of the warm molecular disk, it is co-spatial with the inner edge of the warm dust disk (0.18 AU; Jensen & Mathieu 1997), similar to the photo-excited H2 distribution around the accreting brown dwarf 2M1207 (France et al., 2010a). While we cannot determine the spatial origin of the electron-impact excited H2 emission conclusively, we favor an origin in the 0.2 – 2 AU inner disk. While the electron-impact H2 emission may be present at the disk midplane where planets are actively forming, the observed H2 emission most likely originates between the disk midplane and the the disk surface. This radiation is being emitted from planet forming radii in the disk, but the collisionally excited H2 is not tracing the cold ( 30 K), high column ( 1022 cm-2), low electron fraction ( 10-6) disk midplane.
The far-UV continuum and the “PDR-like” environment of the inner disk call into question the assumption that non-thermal electrons are the only excitation source for the broad-band H2 emission that we observe in V4046 Sgr. We note that the best fit column density and temperature values for the collisionally excited H2 are similar to those found for the Ly-pumped H2 in other CTTS disks [(H2) 2500 K, (H2) 1018-19 cm-2] (Ardila et al. 2002; Herczeg et al. 2004), even though these states are not fully thermalized. At moderate spectra resolution, the spectrum of H2 excited by the far-UV continuum of a hot star is qualitatively very similar to the far-UV electron-impact spectrum (compare, e.g., Witt et al. 1989 and France et al. 2005 with Gustin et al. 2006).
Finally, in §3.3.2 we suggested that hydrocarbons are responsible for the selective reddening of the observed H2 electron-impact spectrum. Methane, the most important opacity source for electron-impact H2 emission in giant planet atmospheres, is difficult to observe at radio wavelengths owing to its lack of permanent dipole moment. However, methane has been observed in higher mass protostellar disks at abundances 10-6 that of hydrogen (Boogert et al., 2004). Furthermore, Carr & Najita (2008) presented infrared spectra of acetylene emission in the disk of the CTTS AA Tau. They posited that the large observed abundance of C2H2 is a sign of vertical mixing within the disk, bringing the hydrocarbons up from the midplane. An analogous scenario fits our methane assumption. If we assume that the CH4 is 10-6 times as abundant as hydrogen in the planet forming region ( 1022-23 cm-2) and that this gas can be transported vertically towards the disk surface, then (CH4) is sufficient to attenuate the discrete H2 line emission in V4046 Sgr [(CH4) 6 1016 cm-2]. Thus, we may have found indirect evidence for a reservoir of hydrocarbons in the inner disk, where they are expected to become important components of extrasolar giant planet atmospheres (Sudarsky et al., 2003).
6. Summary
We have presented here the highest-quality observations of the far-UV continuum in CTTSs acquired to date. Because the gas-rich CTTS phase is roughly co-temporal with the epoch of giant planet formation, our observations represent an important portion of the energetic radiation environment present during the formation of exoplanetary systems. We characterize the spectra of hot accretion emission and electron-excited H2 in two prototypical CTTSs. We find that the far-UV accretion continuum can be described by a simple linear fit, which connects to the optical Balmer continuum given assumptions about the optical activity level at the time of the far-UV observations. Accretion introduces an additional source of far-UV continuum emission that is 5 – 7 orders of magnitude stronger than the ISRF and has an effective temperature of 104 K in DF Tau. We also find that the electron-impact H2 spectrum in V4046 Sgr is characterized by (H2) = 3000 K and (H2) 1018 cm-2, with 50 – 100 eV. Finally, we propose that hydrocarbon absorption is the most likely explanation for the differential reddening inferred from the attenuation of collisionally produced H2 emission lines below 1400 Å.
References
- Abgrall et al. (1994) Abgrall, H., Roueff, E., Launay, F., & Roncin, J. 1994, Canadian Journal of Physics, 72, 856
- Abgrall et al. (1993a) Abgrall, H., Roueff, E., Launay, F., Roncin, J. Y., & Subtil, J. L. 1993a, A&AS, 101, 273
- Abgrall et al. (1993b) —. 1993b, A&AS, 101, 323
- Abgrall et al. (1997) Abgrall, H., Roueff, E., Liu, X., & Shemansky, D. E. 1997, ApJ, 481, 557
- Ajello et al. (1991) Ajello, J. M., James, G. K., & Shemansky, D. E. 1991, ApJ, 371, 422
- Ajello et al. (1984) Ajello, J. M., Shemansky, D., Kwok, T. L., & Yung, Y. L. 1984, Phys. Rev. A, 29, 636
- Alibert et al. (2005) Alibert, Y., Mordasini, C., Benz, W., & Winisdoerffer, C. 2005, A&A, 434, 343
- Andrews & Williams (2005) Andrews, S. M. & Williams, J. P. 2005, ApJ, 631, 1134
- Apai et al. (2005) Apai, D., Pascucci, I., Bouwman, J., Natta, A., Henning, T., & Dullemond, C. P. 2005, Science, 310, 834
- Ardila et al. (2002) Ardila, D. R., Basri, G., Walter, F. M., Valenti, J. A., & Johns-Krull, C. M. 2002, ApJ, 566, 1100
- Bergin et al. (2004) Bergin, E., Calvet, N., Sitko, M. L., Abgrall, H., D’Alessio, P., Herczeg, G. J., Roueff, E., Qi, C., Lynch, D. K., Russell, R. W., Brafford, S. M., & Perry, R. B. 2004, ApJ, 614, L133
- Bethell & Bergin (2009) Bethell, T. & Bergin, E. 2009, Science, 326, 1675
- Boogert et al. (2004) Boogert, A. C. A., Blake, G. A., & Öberg, K. 2004, ApJ, 615, 344
- Bouvier et al. (2007) Bouvier, J., Alencar, S. H. P., Harries, T. J., Johns-Krull, C. M., & Romanova, M. M. 2007, Protostars and Planets V, 479
- Burgh et al. (2007) Burgh, E. B., France, K., & McCandliss, S. R. 2007, ApJ, 658, 446
- Calvet & Gullbring (1998) Calvet, N. & Gullbring, E. 1998, ApJ, 509, 802
- Cardelli et al. (1989) Cardelli, J. A., Clayton, G. C., & Mathis, J. S. 1989, ApJ, 345, 245
- Carmona et al. (2008) Carmona, A., van den Ancker, M. E., Henning, T., Pavlyuchenkov, Y., Dullemond, C. P., Goto, M., Thi, W. F., Bouwman, J., & Waters, L. B. F. M. 2008, A&A, 477, 839
- Carr & Najita (2008) Carr, J. S. & Najita, J. R. 2008, Science, 319, 1504
- Carruthers (1970) Carruthers, G. R. 1970, ApJ, 161, L81+
- Clarke et al. (1980) Clarke, J. T., Moos, H. W., Atreya, S. K., & Lane, A. L. 1980, ApJ, 241, L179
- Costa et al. (2000) Costa, V. M., Lago, M. T. V. T., Norci, L., & Meurs, E. J. A. 2000, A&A, 354, 621
- Danforth et al. (2010) Danforth, C. W., Keeney, B. A., Stocke, J. T., Shull, J. M., & Yao, Y. 2010, ApJ, 720, 976
- Diercksen et al. (1982) Diercksen, G. H. F., Kraemer, W. P., Rescigno, T. N., Bender, C. F., McKoy, B. V., Langhoff, S. R., & Langhoff, P. W. 1982, J. Chem. Phys., 76, 1043
- Dols et al. (2000) Dols, V., Gérard, J. C., Clarke, J. T., Gustin, J., & Grodent, D. 2000, Icarus, 147, 251
- Draine (1978) Draine, B. T. 1978, ApJS, 36, 595
- Dullemond & Monnier (2010) Dullemond, C. P. & Monnier, J. D. 2010, ARA&A, 48, 205
- Dutrey (2001) Dutrey, A. 2001, in Astronomical Society of the Pacific Conference Series, Vol. 235, Science with the Atacama Large Millimeter Array, ed. A. Wootten, 215–+
- Eisner et al. (2006) Eisner, J. A., Chiang, E. I., & Hillenbrand, L. A. 2006, ApJ, 637, L133
- Fitzpatrick & Massa (1988) Fitzpatrick, E. L. & Massa, D. 1988, ApJ, 328, 734
- France et al. (2005) France, K., Andersson, B.-G., McCandliss, S. R., & Feldman, P. D. 2005, ApJ, 628, 750
- France et al. (2010a) France, K., Linsky, J. L., Brown, A., Froning, C. S., & Béland, S. 2010a, ApJ, 715, 596
- France et al. (2007) France, K., Roberge, A., Lupu, R. E., Redfield, S., & Feldman, P. D. 2007, ApJ, 668, 1174
- France et al. (2010b) France, K., Stocke, J. T., Yang, H., Linsky, J. L., Wolven, B. C., Froning, C. S., Green, J. C., & Osterman, S. N. 2010b, ApJ, 712, 1277
- Furlan et al. (2005) Furlan, E., Calvet, N., D’Alessio, P., Hartmann, L., Forrest, W. J., Watson, D. M., Uchida, K. I., Sargent, B., Green, J. D., & Herter, T. L. 2005, ApJ, 628, L65
- Furlan et al. (2006) Furlan, E., Hartmann, L., Calvet, N., D’Alessio, P., Franco-Hernández, R., Forrest, W. J., Watson, D. M., Uchida, K. I., Sargent, B., Green, J. D., Keller, L. D., & Herter, T. L. 2006, ApJS, 165, 568
- Ghez et al. (1997) Ghez, A. M., White, R. J., & Simon, M. 1997, ApJ, 490, 353
- Glass-Maujean (1984) Glass-Maujean, M. 1984, Atomic Data and Nuclear Data Tables, 30, 301
- Greaves (2004) Greaves, J. S. 2004, MNRAS, 351, L99
- Greaves (2005) —. 2005, MNRAS, 364, L47
- Grodent & Gérard (2001) Grodent, D. & Gérard, J. 2001, J. Geophys. Res., 106, 12933
- Güdel & Telleschi (2007) Güdel, M. & Telleschi, A. 2007, A&A, 474, L25
- Günther et al. (2006) Günther, H. M., Liefke, C., Schmitt, J. H. M. M., Robrade, J., & Ness, J. 2006, A&A, 459, L29
- Günther & Schmitt (2007) Günther, H. M. & Schmitt, J. H. M. M. 2007, Mem. Soc. Astron. Italiana, 78, 359
- Günther & Schmitt (2008) —. 2008, A&A, 481, 735
- Gustin et al. (2006) Gustin, J., Cowley, S. W. H., Gérard, J., Gladstone, G. R., Grodent, D., & Clarke, J. T. 2006, Journal of Geophysical Research (Space Physics), 111, 9220
- Gustin et al. (2004) Gustin, J., Feldman, P. D., Gérard, J., Grodent, D., Vidal-Madjar, A., Ben Jaffel, L., Desert, J., Moos, H. W., Sahnow, D. J., Weaver, H. A., Wolven, B. C., Ajello, J. M., Waite, J. H., Roueff, E., & Abgrall, H. 2004, Icarus, 171, 336
- Gustin et al. (2009) Gustin, J., Gérard, J., Pryor, W., Feldman, P. D., Grodent, D., & Holsclaw, G. 2009, Icarus, 200, 176
- Habing (1968) Habing, H. J. 1968, Bull. Astron. Inst. Netherlands, 19, 421
- Hartigan et al. (1995) Hartigan, P., Edwards, S., & Ghandour, L. 1995, ApJ, 452, 736
- Herczeg et al. (2009) Herczeg, G. J., Cruz, K. L., & Hillenbrand, L. A. 2009, ApJ, 696, 1589
- Herczeg & Hillenbrand (2008) Herczeg, G. J. & Hillenbrand, L. A. 2008, ApJ, 681, 594
- Herczeg et al. (2002) Herczeg, G. J., Linsky, J. L., Valenti, J. A., Johns-Krull, C. M., & Wood, B. E. 2002, ApJ, 572, 310
- Herczeg et al. (2006) Herczeg, G. J., Linsky, J. L., Walter, F. M., Gahm, G. F., & Johns-Krull, C. M. 2006, ApJS, 165, 256
- Herczeg et al. (2004) Herczeg, G. J., Wood, B. E., Linsky, J. L., Valenti, J. A., & Johns-Krull, C. M. 2004, ApJ, 607, 369
- Huber & Herzberg (1979) Huber, K. P. & Herzberg, G. 1979, Molecular Spectra and Molecular Structure. IV. Constants of Diatomic Molecules (Van Nostrand Reinhold Company)
- Ingleby et al. (2009) Ingleby, L., Calvet, N., Bergin, E., Yerasi, A., Espaillat, C., Herczeg, G., Roueff, E., Abgrall, H., Hernández, J., Briceño, C., Pascucci, I., Miller, J., Fogel, J., Hartmann, L., Meyer, M., Carpenter, J., Crockett, N., & McClure, M. 2009, ApJ, 703, L137
- Isella et al. (2009) Isella, A., Carpenter, J. M., & Sargent, A. I. 2009, ApJ, 701, 260
- Jensen & Mathieu (1997) Jensen, E. L. N. & Mathieu, R. D. 1997, AJ, 114, 301
- Johns-Krull & Valenti (2001) Johns-Krull, C. M. & Valenti, J. A. 2001, ApJ, 561, 1060
- Johns-Krull et al. (2000) Johns-Krull, C. M., Valenti, J. A., & Linsky, J. L. 2000, ApJ, 539, 815
- Karr et al. (2010) Karr, J. L., Ohashi, N., Kudo, T., & Tamura, M. 2010, AJ, 139, 1015
- Kastner et al. (2002) Kastner, J. H., Huenemoerder, D. P., Schulz, N. S., Canizares, C. R., & Weintraub, D. A. 2002, ApJ, 567, 434
- Kastner et al. (2008) Kastner, J. H., Zuckerman, B., Hily-Blant, P., & Forveille, T. 2008, A&A, 492, 469
- Kenyon & Bromley (2006) Kenyon, S. J. & Bromley, B. C. 2006, AJ, 131, 1837
- Kim et al. (1997) Kim, Y. H., Fox, J. L., & Caldwell, J. J. 1997, Icarus, 128, 189
- Kwok et al. (1985) Kwok, T. L., Dalgarno, A., & Posen, A. 1985, Phys. Rev. A, 32, 646
- Lepp & Shull (1983) Lepp, S. & Shull, J. M. 1983, ApJ, 270, 578
- Lin (1974) Lin, C. S. 1974, J. Chem. Phys., 60, 4660
- Liu & Dalgarno (1996) Liu, W. & Dalgarno, A. 1996, ApJ, 462, 502
- Liu et al. (1998) Liu, X., Shemansky, D. E., Ahmed, S. M., James, G. K., & Ajello, J. M. 1998, J. Geophys. Res., 103, 26739
- McCandliss (2003) McCandliss, S. R. 2003, PASP, 115, 651
- Meijerink et al. (2008) Meijerink, R., Glassgold, A. E., & Najita, J. R. 2008, ApJ, 676, 518
- Mota et al. (2005) Mota, R., Parafita, R., Giuliani, A., Hubin-Franskin, M., Lourenco, J. M. C., Garcia, G., Hoffmann, S. V., Mason, N. J., Ribeiro, P. A., Raposo, M., & Limao-Vieira, P. 2005, Chemical Physics Letters, 416, 152
- Najita et al. (2003) Najita, J., Carr, J. S., & Mathieu, R. D. 2003, ApJ, 589, 931
- Najita et al. (2010) Najita, J. R., Carr, J. S., Strom, S. E., Watson, D. M., Pascucci, I., Hollenbach, D., Gorti, U., & Keller, L. 2010, ApJ, 712, 274
- Oppenheimer et al. (2008) Oppenheimer, B. R., Brenner, D., Hinkley, S., Zimmerman, N., Sivaramakrishnan, A., Soummer, R., Kuhn, J., Graham, J. R., Perrin, M., Lloyd, J. P., Roberts, Jr., L. C., & Harrington, D. M. 2008, ApJ, 679, 1574
- Quast et al. (2000) Quast, G. R., Torres, C. A. O., de La Reza, R., da Silva, L., & Mayor, M. 2000, in IAU Symposium, Vol. 200, IAU Symposium, 28P–+
- Rachford et al. (2002) Rachford, B. L., Snow, T. P., Tumlinson, J., Shull, J. M., Blair, W. P., Ferlet, R., Friedman, S. D., Gry, C., Jenkins, E. B., Morton, D. C., Savage, B. D., Sonnentrucker, P., Vidal-Madjar, A., Welty, D. E., & York, D. G. 2002, ApJ, 577, 221
- Roberge et al. (2001) Roberge, A., Lecavelier des Etangs, A., Grady, C. A., Vidal-Madjar, A., Bouret, J., Feldman, P. D., Deleuil, M., Andre, M., Boggess, A., Bruhweiler, F. C., Ferlet, R., & Woodgate, B. 2001, ApJ, 551, L97
- Rodriguez et al. (2010) Rodriguez, D. R., Kastner, J. H., Wilner, D., & Qi, C. 2010, ApJ, 720, 1684
- Sacco et al. (2010) Sacco, G. G., Orlando, S., Argiroffi, C., Maggio, A., Peres, G., Reale, F., & Curran, R. L. 2010, A&A, 522, A55+
- Salyk et al. (2008) Salyk, C., Pontoppidan, K. M., Blake, G. A., Lahuis, F., van Dishoeck, E. F., & Evans, II, N. J. 2008, ApJ, 676, L49
- Shull & Beckwith (1982) Shull, M. & Beckwith, S. 1982, Annual Reviews of Astronomy and Astrophysics, 30, 163
- Stecher & Williams (1967) Stecher, T. P. & Williams, D. A. 1967, ApJ, 149, L29+
- Stempels & Gahm (2004) Stempels, H. C. & Gahm, G. F. 2004, A&A, 421, 1159
- Sudarsky et al. (2003) Sudarsky, D., Burrows, A., & Hubeny, I. 2003, ApJ, 588, 1121
- van Dishoeck & Black (1988) van Dishoeck, E. F. & Black, J. H. 1988, ApJ, 334, 771
- van Dishoeck et al. (2008) van Dishoeck, E. F., Jonkheid, B., & van Hemert, M. C. 2008, ArXiv e-prints
- van Zadelhoff et al. (2003) van Zadelhoff, G., Aikawa, Y., Hogerheijde, M. R., & van Dishoeck, E. F. 2003, A&A, 397, 789
- Vasyunin et al. (2010) Vasyunin, A. I., Wiebe, D. S., Birnstiel, T., Zhukovska, S., Henning, T., & Dullemond, C. P. 2010, ArXiv e-prints
- Walter & Kuhi (1981) Walter, F. M. & Kuhi, L. V. 1981, ApJ, 250, 254
- Weingartner et al. (2006) Weingartner, J. C., Draine, B. T., & Barr, D. K. 2006, ApJ, 645, 1188
- White & Ghez (2001) White, R. J. & Ghez, A. M. 2001, ApJ, 556, 265
- Wilkinson et al. (2002) Wilkinson, E., Harper, G. M., Brown, A., & Herczeg, G. J. 2002, AJ, 124, 1077
- Witt et al. (1989) Witt, A. N., Stecher, T. P., Boroson, T. A., & Bohlin, R. C. 1989, ApJ, 336, L21
- Woitke et al. (2009) Woitke, P., Dent, B., Thi, W., Sibthorpe, B., Rice, K., Williams, J., Sicilia-Aguilar, A., Brown, J., Kamp, I., Pascucci, I., Alexander, R., & Roberge, A. 2009, in American Institute of Physics Conference Series, Vol. 1094, American Institute of Physics Conference Series, ed. E. Stempels, 225–233
- Wolven et al. (1997) Wolven, B. C., Feldman, P. D., Strobel, D. F., & McGrath, M. A. 1997, ApJ, 475, 835
- Yung et al. (1982) Yung, Y. L., Gladstone, G. R., Chang, K. M., Ajello, J. M., & Srivastava, S. K. 1982, ApJ, 254, L65