Phase diagram of superconductivity and antiferromagnetism in single crystals of Sr(Fe1-xCox)2As2 and Sr1-yEuy(Fe0.88Co0.12)2As2
Abstract
We report magnetic susceptibility, resistivity and heat capacity measurements on single crystals of the Sr(Fe1-xCox)2As2 and Sr1-yEuy(Fe0.88Co0.12)2As2 series. The optimal Co concentration for superconductivity in Sr(Fe1-xCox)2As2 is determined to be . Based on this we grew members of the Sr1-yEuy(Fe0.88Co0.12)2As2 series so as to examine the effects of well defined, local magnetic moments, on the superconducting state. We show that superconductivity is gradually suppressed by paramagnetic Eu2+ doping and coexists with antiferromagnetic ordering of Eu2+ as long as . For , crosses and the superconducting ground state (as manifested by zero resistivity) abruptly disappears with evidence for competition between superconductivity and local moment antiferromagnetism for up to 0.72. It is speculated that the suppression of the antiferromagnetic fluctuations of Fe sublattice by coupling to the long range order of Eu2+ sublattice destroys bulk superconductivity when .
pacs:
74.25.Dw, 74.25.Fy, 74.25.Ha, 74.62.DhI Introduction
The interplay between superconductivity (SC) and magnetism has been of a long standing interest in condensed matter physics. SC and magnetism were originally considered to be mutually exclusive in conventional superconductors because magnetism breaks the time reversal symmetry of the singlet Cooper pairs. The influence of paramagnetic impurities on SC was first studied theoretically by Abrikosov and Gor’kov (AG).Abrikosov It was shown that SC is drastically suppressed by dilute magnetic moments due to the spin-flip scattering. Early experimental investigations were limited to superconducting systems without long-range magnetic order.Matthias -Williams The coexistence of SC and long-range magnetism was realized in several families of ternary and quaternary rare-earth compounds discovered later, also referred to as magnetic superconductors, e.g. RMo6S8 , RRh4B4 and RNi2B2C.Machida -Canfield2 In these compounds, the localized electrons of the rare-earth ions are indirectly coupled via conduction electrons by the Ruderman-Kittel-Kasuya-Yosida interaction (RKKY) and responsible for various magnetic orderings. The conduction electrons, often primarily from the transition metal, give rise to SC. The coexistence is more favorable for antiferromagnetism (AF), since the AF molecular field exerted on SC electrons may be averaged out on the scale of SC coherence length.
Another type of magnetic superconductor is the one where the moment is itinerant. In itinerant electron systems long range order may be carried by the same electrons that become superconducting, leading to competition (sometime strong) between the two states. The recently discovered iron arsenic based superconductors appear to be one such example. The parent compounds (RFeAsO 1111 series, R=La, Ce, Pr, Nd, Sm or Gd, and AFe2As2 122 series, alkali earth A=Ca, Sr, Ba) are semimetals and show either closely spaced, or a simultaneous AF ordering and tetragonal to orthorhombic (ortho) structural transition. With electron or hole doping, the magnetic and structural transitions are suppressed to low temperature and SC, with up to 55 KKamihara , is induced. Ba1-xKxFe2As2 Rotter exhibits a maximum of K, or by substitution of transition metal for Fe, e.g. Ba(Fe1-xCox)2As2, can reach 22 KSefat -Ni1 or for Sr(Fe1-xCox)2As2, can reach 18 K.Jasper Unlike the 1111 series for which the magnetic/structural transition was suggested to disappear abruptly prior to the emergence of SC, the 122 series show a gradual suppression of the AF/ortho transition, which coexists with SC for a range of dopings.Canfield3 ,Ni1 For the Co doped Ba-122 series neutron scattering shows a suppression of the magnetic order parameter on entering the superconducting state, indicating strong coupling between AF and SC.Canfield3 ,Pratt In addition, both SRBernhard ,Khas and 75As NMRLaplace measurements unambiguously indicate that AF order is present in all of the sample volume when the sample is in the superconducting state, i.e. that the magnetic order and SC coexist homogeneously at the atomic scale. Whereas Fe-based AF coexists with SC and Fe based AF fluctuations may well be vital to FeAs based superconductors, a systematic study of effects of well defined, local magnetic moments on this SC is lacking. Starting from optimally Co-doped SrFe2As2, we can have Eu2+ substituting for Sr2+ without introducing extra electrons/holes and assess the sensitivity of this SC to the large local moment.
The Eu end compound, EuFe2As2, exists as an isostructural member of the 122 series. Therefore a continuous substitution can be expected between EuFe2As2 and AFe2As2. EuFe2As2, in addition to the AF order of the iron sublattice at about 189 K, exhibits an A-type AF order of Eu2+ ions at 19 K.Jeevan On suppression of the AF order of iron with pressure or Co dopingMiclea -Nicklas , the onset of SC was observed, which was then followed by a resistive reentrance attributed to the magnetic order of Eu2+. Given the sensitivity of the 122 compounds to strain/pressureMilton -Park , we choose SrFe2As2 as host, owing to the similar size of Sr2+(118 pm) and Eu2+ (117 pm)Shannon , so as to minimize the steric effects of the doping.
In order to perturb the SC of the Sr 122 phase by isoelectronic substitution of Eu and establish phase diagrams systematically using the same growth technique for Co and Eu doping, the phase diagram of Sr(Fe1-xCox)2As2 as a function of Co substitution is constructed first. The optimal Co doping level of is then kept the same across the whole range of Eu doping. We present the magnetic susceptibility, resistivity and heat capacity measurements on Sr1-yEuy(Fe1-xCox)2As2. Superconductivity of the optimally Co doped SrFe2As2 is suppressed gradually by Eu doping (), crosses over a region with coexistence of SC and Eu based AF () with increasing linearly with . For , cuts across the line and SC suddenly disappears leaving just the Eu2+, AF ordered state. An initial study of EuFe2As2 doped with both Sr and Co was recently published, but using samples with nominal doping values and focusing on the Eu-rich side.He We will compare the results of our systematic study with Ref. 32 in the discussion section.
II Experiment
Single crystal samples of both Sr(Fe1-xCox)2As2 and Sr1-yEuy(Fe0.88Co0.12)2As2 were grown via a self flux method.Ni1 ,Paul The FeAs and CoAs precursors were first synthesized by solid state reaction. Elemental Sr and Eu were mixed with FeAs and CoAs in the stoichiometry of and respectively in an alumina crucible and sealed into an amorphous silica tube. The sealed ampoule was heated to 1180 ∘C and then cooled slowly to 1000 ∘C; finally the excess liquid flux was decanted.Paul The as-grown crystals were annealed under a static Ar atmosphere at 500 ∘C for 24 hours (as discussed below in Section III).Saha
Powder x-ray diffraction, with Si standard, was performed using a Rigaku Miniflex X-ray diffractometer with Cu K radiation (). The lattice parameters were refined by Rietica software.Rietica Chemical composition was determined by wavelength dispersive x-ray spectroscopy (WDS) in a JEOL JXA-8200 electron microscope. The actual composition of the single crystals was taken as the average of 10 spots measured on the crystal and the error bar was taken as the standard deviation of the 10 values.
Magnetic susceptibility was measured in a Quantum Design MPMS, SQUID magnetometer. The in-plane AC resistivity was measured by a standard four-probe method using an LR-700 resistance bridge with an excitation of 60 on samples of typical size . Electrical contacts were made using Dupont 4929N silver paint. Heat capacity data were collected using a Quantum Design PPMS.
All the samples were found to slowly degrade in air. Over a period of four months, a ferromagnetic background on the order of 10-2 emu/mol develops, although no obvious change in appearance of the crystal and no impurity phase in powder XRD pattern can be observed. Elemental analysis indicates significant presence of oxygen in the surface layer of the aged samples, implying the formation of oxides. In addition, the superconducting transition of the aged sample broadens and Tc decreases as measured by low field magnetization. Therefore all the measurements reported in this paper were performed shortly after the samples were prepared. It should be noted that whereas the Sr-based 122 compounds are known to be susceptible to chemical changesHidenori , as well as strainSaha1 , we observed no sample quality change over time in the well studiedCanfield3 ,Ni1 Ba(Fe1-xCox)2As2 samples.
III Results and discussions
III.0.1 Sr(Fe1-xCox)2As2
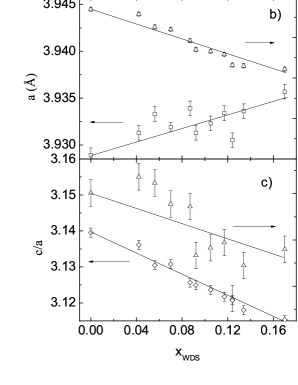
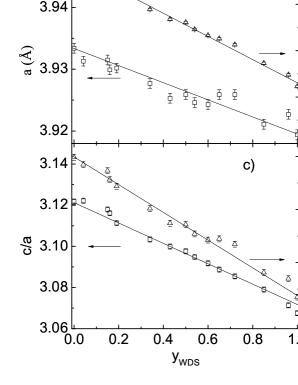
The results of elemental analysis and lattice parameter determined from the powder X-ray measurements on Sr(Fe1-xCox)2As2 are shown in Fig. 1. The nearly linear dependence in Fig. 1(a), with a slope of 0.94, indicates good agreement between the actual Co concentration, , and the nominal concentration, . The compositional spread over a wide area on the sample surface for each concentration is less than 0.02. These results demonstrate the relative homogeneity of the Co doping in the single crystal samples. Figures 1(b) and (c) show that the lattice parameters a and c, as well as the c/a ratio and unit cell volume as a function of . The parameter c, and c/a, change linearly with and the values are in good agreement with the previous report.Jasper By substitution of Co for Fe the lattice is changed more along c axis than in the ab plane. The lattice parameter c decreases by 0.6% () for , whereas the lattice parameter a increases by only about 0.2% (). The random error of lattice parameter determined by our Miniflex X-ray diffractometer is about 0.02%, for the a lattice parameter, which is about the same order as the average deviation from a linear variation . Thus lattice parameters can be regarded to vary linearly with , within experimental errors, in accordance with Vegard’s law.
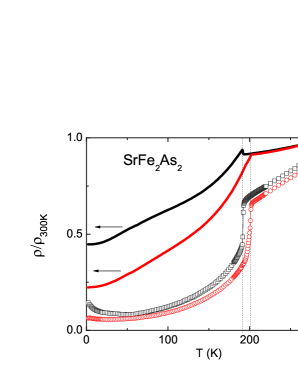
Annealing can have clear effect on samples and has been shown to remove extrinsic effects associated with strain induced defects.Saha As shown in Fig. 2, the magnetic/structural transition of pure SrFe2As2 is increased from 192 K, for the as grown sample to 201 K, for the annealed sample, which is very close to the previous reported values for polycrystalline (205 K)Jasche and Sn flux-grown single crystalline (198 K)JQ Yan SrFe2As2. Based on these observations, our samples are heat treated under the conditions described in Section II above.
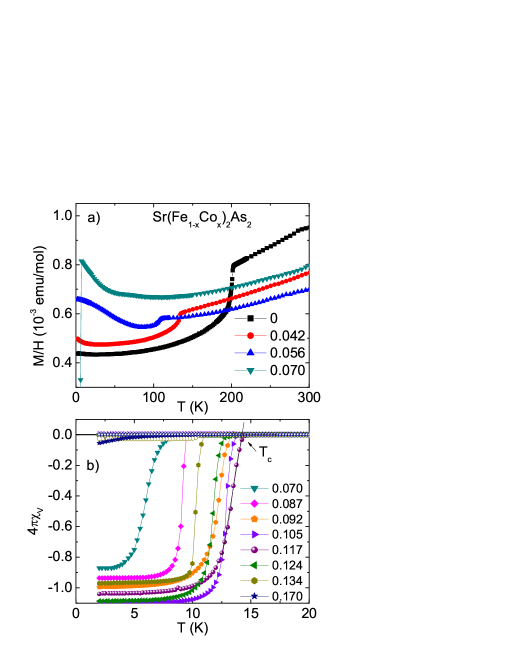
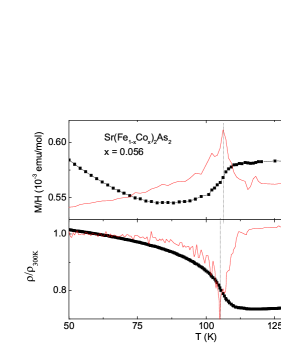
The magnetic susceptibility for H ab of the Sr(Fe1-xCox)2As2 series was measured in a magnetic field of 10 kOe for (Fig. 3 (a)). The parent compound SrFe2As2 manifests a sharp drop at 201 K in magnetic susceptibility, due to the magnetic/structural transition.Jasche ,JQ Yan With increasing Co doping, this transition is suppressed to lower temperature and becomes undetectable for . For , SC is induced and is manifested in low field (H = 100 Oe) zero-field-cooled (ZFC) and field-cooled (FC) measurements below 20 K (Fig. 3 (b)). The data are compared to 1/4 to give a rough estimate of the superconducting volume fraction. Although, as discussed in Ref. 39, the FC curves are routinely close to zero in these materials, due to pinning or surface barrier effects, the ZFC curves approaching -1 suggest bulk SC. The superconducting transitions remain very sharp for except for which becomes broad and barely visible, consistent with a reduced to a value close to our base temperature. The transition temperature increases from 7.4 K for , maximizes at 14.8 K for and then diminishes to 5.7 K for .
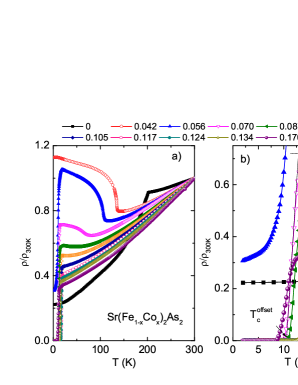
Fig. 4(a) shows the temperature dependence of the electrical resistivity of Sr(Fe1-xCox)2As2, normalized to the room temperature values. Similar to the case of Ba(Fe1-xCox)2As2 seriesNi1 , the magnetic/structural transition of Sr(Fe1-xCox)2As2 manifests itself as a sudden drop for and as an increase in resistivity for and nearly disappears for . After the magnetic/structural transition is completely suppressed for , the series shows featureless, metallic temperature dependence. Fig. 4(b) shows an expanded view for low temperatures. At , a broad and incomplete superconducting transition is observed; zero resistance is only reached for , this agrees with the bulk SC observed in magnetic measurements.
In order to establish the phase diagram for the Sr(Fe1-xCox)2As2 series, the transition temperatures were inferred in the same manner as used in Ref. 16. from magnetic susceptibility is determined from the intersection of the steepest slope and the linear extrapolation of normal magnetic susceptibility, shown in Fig. 3 (b). Resistive onset and offset of values are inferred from the intersects of the steepest slope with the normal state and zero resistance respectively, shown in Fig. 4 (b). is inferred from the peak of and ; data for is shown in Fig. 5 as an example. It is argued by Gillett et alGillett that only a single, first-order-like, transition occurs in the heat capacity of Sr(Fe1-xCox)2As2 with coincidence of magnetic and structural transitions. Our magnetization and resistance data also do not show a discernible splitting between and , Fig. 5, further supports this observation.
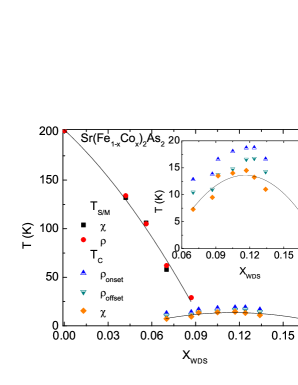
Based on our magnetization and electrical resistance measurements, the phase diagram of Sr(Fe1-xCox)2As2 is mapped out in Fig. 6. A superconducting dome is found: SC is first stabilized for at about 7.4 K, reaches a maximum of 14.5 K for , then decreases to 5.7 K for . Our phase diagram is in good agreement with earlier ones. The phase diagram for polycrystalline Sr(Fe1-xCox)2As2 showed a complete suppression of magnetic/structural transition and appearance of SC at with the highest of 19 K.Jasper The difference between maximum of the polycrystalline and our single crystalline samples is probably due to strain effect. As it has been demonstratedMilton -Park , strain can affect Sr122 profoundly, especially when there is a high surface area to volume fraction (as in powders). Results consistent with our single crystal Sr(Fe1-xCox)2As2 work, with highest K were reported by Kasinathan et al.Deepa The more recent one based on self-flux grown single crystals, having larger density of data points, showed more clearly a coexistence of and SC transition for and the superconducting dome with optimal of 16 K at .Gillett The differences between our phase diagram and the published ones, in terms of transition temperature and optimal doping concentration, may be associated with differences in both sample preparation and uncertainties of concentration. For our self-flux grown samples, we can choose Co concentration , with the highest and suppressed AF/ortho transition as the starting point for our study of the effects of local moments of FeAs based superconductor via Eu substitution for Sr.
III.0.2 Sr1-yEuy(Fe1-xCox)2As2
For our Sr1-yEuy(Fe1-xCox)2As2 series, the Co concentration was kept at and the series was doped by Eu for . Fig. 7(a) shows the elemental analysis results for the actual Eu and Co concentrations as a function of nominal Eu concentration. The actual concentration of Eu agrees well with the nominal, with a slope of 1.03, and the Co concentration is essentially constant. The lattice parameters a, c and unit cell volume are plotted in Figs. 7(b) and (c). Compared to Sr(Fe0.883Co0.117)2As2 ( ), the smaller Eu2+ ion leads to a decrease in c axis by 2% () and a decrease in a axis by 0.4% (). The small concentration error and linear dependence on indicate a homogeneous substitution of Sr by Eu across the whole series.
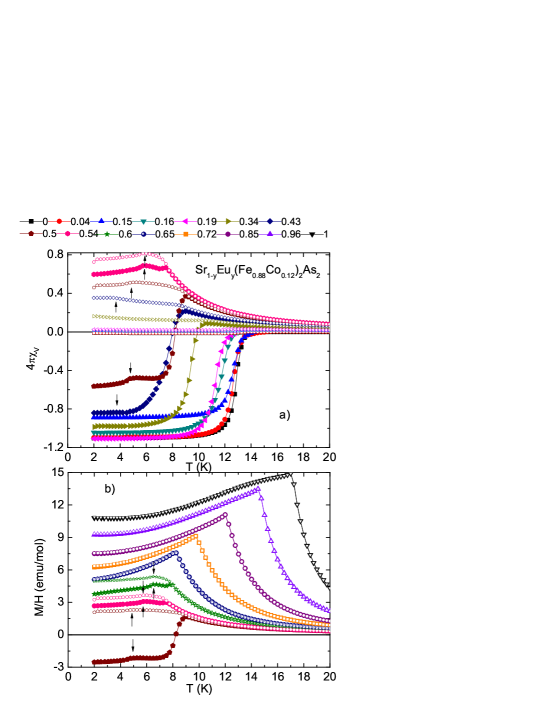
The in-plane magnetic susceptibility of Sr1-yEuy(Fe0.88Co12)2As2 is shown in Fig. 8. Both ZFC and FC curves are measured in a magnetic field of 100 Oe. The data clearly indicate that there are three regions of low temperature behavior across the series: i) , SC is gradually suppressed by Eu doping but remains a simply identifiable transition; ii) in this intermediate range, the Curie-Weiss paramagnetic background due to Eu2+ moments gradually becomes large enough to shift the diamagnetic signal to positive values. In addition a second feature appears and as increases it rises in temperature leading to a double-peak feature, which can be ascribed to the coexistence of SC and lower temperature AF associated with the Eu2+ sublattice. The upper transition shows a splitting between ZFC and FC curves consistent with SC. The lower transition of AF origin is present on both ZFC and FC curves at the same temperature, indicated by arrows. These transitions are further confirmed by heat capacity measurement as shown below; iii) , clear AF transitions manifest as cusps and continues to increase with Eu2+ doping up to 17 K for . It is worth noting that FC and ZFC curves collapse on each other for these higher values, suggesting long range antiferromagnetic order, similar to EuFe2As2Ren , instead of other magnetic origin, e.g. spin glass or ferrimagnetic order.
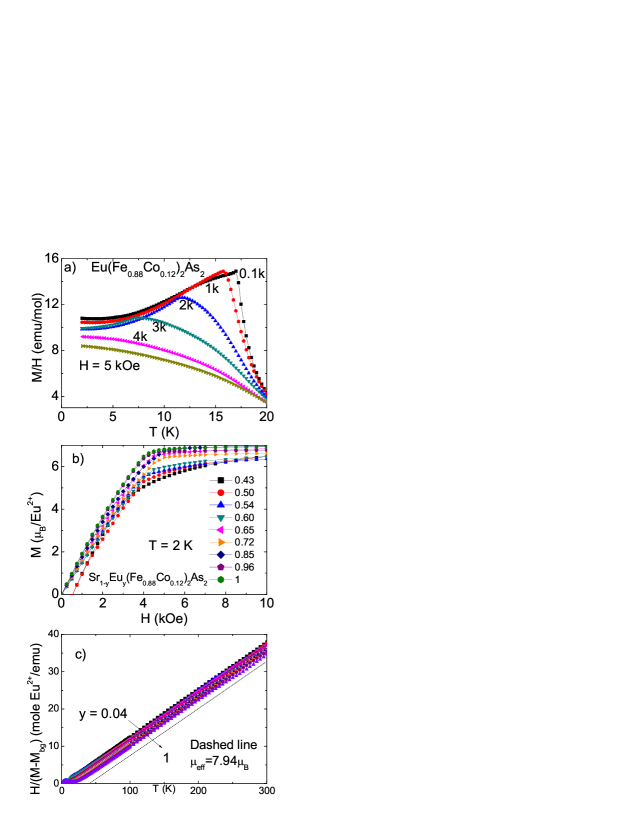
Fig. 9(a) shows M(T)/H as a function of temperature data measured in various fields for . The cusp initially shifts to lower temperature with higher field and then becomes saturated paramagnetic-like for fields above 4 kOe. Neutron scattering experiments on pure EuFe2As2 revealed that the long range order of Eu2+ is of A-type AF, namely the Eu2+ moments are parallel in ab plane and antiparallel along c axis with an ordering wavevector of .Xiao Therefore the meta-magnetic transition for is most likely due to the spin flip along the field direction between Eu2+ layers, similar to EuFe2As2.Jiang Our results are in good agreement with the reported magnetic field dependence of M/H for EuFe1.715Co0.285As2, where meta-magnetic transition occurs at a lower field of 3.5 kOe than that of pure EuFe2As2 (8.5 kOe).Jiang Because of this meta-magnetic transition, the series for all show similar field dependence (Fig. 9(b)), i.e. the slope of magnetization changes around 4 kOe and shows a saturation moment of 7/Eu2+ in high field. For and , diamagnetic contribution of SC can be seen below 500 Oe. Given the meta-magnetic transition, the AF transition temperature was inferred from the cusp of measured in .Fisher1
In Fig. 9(c) we examine the high temperature behavior of the magnetic susceptibility. Since the Hund’s rule ground state for Eu2+ is the same as Gd3+ (), there is no spin-orbital coupling and thus the crystal field effect is absent and well defined magnetic moments of Eu2+ exhibiting Curie-Weiss law at high temperatures are expected. We are able to estimate the concentration of Eu2+ from magnetic measurements by assuming each Eu2+ carries an effective magnetic moment of 7.94. The magnetic background of Sr(Fe0.883Co0.117)2As2 in a magnetic field of 10 kOe is subtracted from all the datasets and the inverse magnetic susceptibility normalized to a fitted Eu concentration is plotted in Fig. 9(c) as a function of temperature. The magnetic susceptibility above 100 K is fitted by the Curie-Weiss law:
where N is Avogadro constant, is the Boltzmann constant and is Curie-Weiss temperature. As can be seen in Table I, and agree well with each other and follow the same trend with the nominal concentration. The positive Curie-Weiss temperature is consistent with an overall predisposition to ferromagnetic coupling between Eu2+ moments, at least in the magnetic field of 10kOe.
The low temperature ( ) heat capacity divided by temperature, , vs of Sr1-yEuy(Fe0.88Co0.12)2As2 is presented in Fig. 10(a). A very pronounced discontinuity can be seen for . The transition temperature , defined by this discontinuity, decreases with decreasing Eu2+ concentration and is in excellent agreement with the cusp of of magnetic susceptibility. These data confirm that AF is the lower transition in the intermediate range . For the data this discontinuity appears to be at or just below our base temperature of 2.0 K. For the complete transition can not be detected. It is worth noting that the low temperature below 5 K for show a linear dependence on T, i.e. . This temperature dependence of heat capacity is consistent with the low temperature AF magnon excitations of a two dimensional magnetic lattice.Jongh
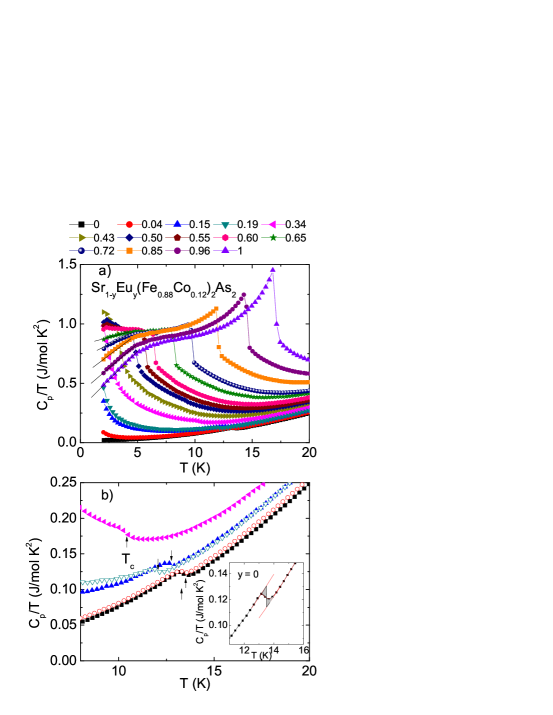
Figure 10(b) shows that starting from the low side, SC can be identified as a weak jump for , but becomes hard to detect for because of the large background associated with the AF transition. Fig. 10(b) inset shows a representative heat capacity jump for . The SC transition temperature is inferred by isoentropic construction, i.e. the two shaded areas have the same size. For , is taken as the middle point of the jump.
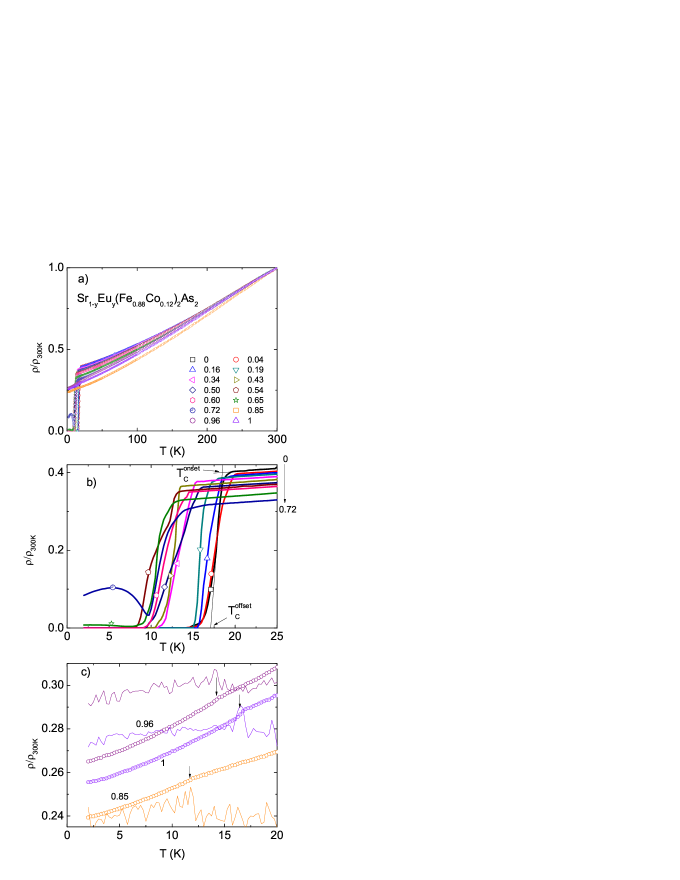
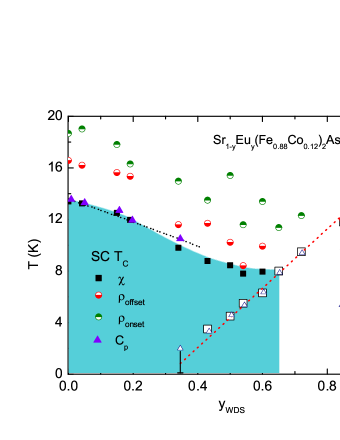
Figure 11 shows the temperature dependence of the normalized resistivity of Sr1-yEuy(Fe0.88Co12)2As2. Given the Co-doping level (near optimal), it is not surprising that the series remains metallic and featureless above 20 K. In Fig. 11(b) it can be seen that superconducting transition temperature is gradually lowered by Eu2+ doping for . The transition becomes broader for e.g. is 4 K for and 6 K for . This wide transition is similarly observed in Ni doped SrFe2As2.Saha For and , a resistivity reentrance is observed as a broad peak below a local minimum in resistivity at 7.8 and 9.8 K respectively. The minimum coincides with the AF order temperature measured by magnetic susceptibility and heat capacity, indicating that the bulk SC transition is interrupted by AF order. Such incomplete resistive transitions have been observed in Sr0.3Eu0.7(Fe0.86Co0.14)2As2 and EuFe2As2 under pressure,Miclea ,He
The superconducting transition temperature, , is inferred in the same way as in Fig. 4. For and , only is extracted. For , Fig. 11(c), the series remains a normal metal and manifests a very small change in slope at (corresponding to the peak in ), due to the loss of spin disorder scattering. We must note that the change in resistivity at is very small, even smaller than that of EuFe2As2.Ren It implies very weak coupling between Eu2+ moments and conduction electrons. A recent detailed transport studies of EuFe2As2 under high pressure showed that electron scattering due to Eu2+ has minor contribution to both resistivity and Hall effect, thus consistent with our conclusion.Taichi1
III.0.3 Analysis and discussion
Based on the transport and thermodynamic measurements, a phase diagram as a function of Eu doping can be constructed and is shown in Fig. 12. Starting from the Eu-rich side of the phase diagram, we can see that decreases with decreasing Eu content and crosses through the line, near , without any resolvable change in slope (). This is fairly standard behavior for an intermetallic compound with a local moment antiferromagnetic phase transition that is being reduced via site dilution with a non-magnetic ion (i.e. Sr2+ for Eu2+).Canfield2 ,Wiener Starting from the Sr-rich side of the phase diagram we can see that when Eu2+ is a paramagnetic impurity, it suppresses SC monotonically, but rather weakly. The weakness of the paramagnetic Eu2+ as a pair breaker is not unexpected, given the rather weak coupling of the Eu2+ moments to the conduction electrons, as most clearly manifested by the small loss of spin-disorder scattering seen in Fig. 11(c). The suppression of by magnetic impurities in a nonmagnetic superconductor has been discussed by Abrikosov and Gor’kov.Abrikosov The fit to AG theory for data gives a critical concentration , implying SC could survive in Eu(Fe0.88Co0.12)2As2 if the Eu2+ sublattice were to remain in the disordered paramagnetic state (which it does not). For , both SC and AF states are clearly detected. As long as , the advent of AF order does not lead to any re-entrance or other clear features in the phase diagram. This is in agreement with early findings that EuFe2Asbecomes a bulk superconductor with K and SC coexists with AFM order with K.Taichi2 The remarkable feature revealed in Fig. 12 is the sudden disappearance of bulk SC when the line intercepts the line. Superconductivity, as defined by a state, suddenly disappears for . This sudden truncation of the superconducting region is quite remarkable and demands further analysis.
As has been shown in this work and discussed beforeSaha1 ,Saha , the resistivity data associated with pure and doped SrFe2As2 samples is complicated, manifesting superconducting transition temperatures that appear to be higher than those determined by bulk, thermodynamic measurements such as magnetic susceptibility and specific heat. On the other hand, in both figures 6 and 12 the superconducting transition inferred from resistivity roughly tracks those inferred from magnetization and specific heat (in Fig. 12 even the data inferred from onset criterion drop by a similar amount as the values inferred from thermodynamic data, just with an offset by a few degrees). This is consistent with the idea that a small portion of the sample has an enhance associated with some strain/damage. Similar difference of between that inferred from resistivity and magnetic susceptibility, as well as transition width , were observed in Fig. 6 and in Sr(Fe1-xNix)2As2Saha This being said, the absence of any hint of superconducting drop in the data (Fig. 11 (c)) is a conclusive evidence that there is not even trace superconductivity in these samples. For the and samples there appears to be an onset of filamentary superconductivity that is interrupted by the bulk AF.
In comparison to Ref. 32, whereas the above discussion and data show that AF appears to be very detrimental to the formation of the superconducting state when , there is no evidence of the AF leading to dramatic re-entrance of the normal state when (i.e. for ). The resistivity data, as well as the susceptibility data do not show any feature that can be associated with the re-establishment of the normal state below the line as it cuts under the superconducting state.
These observations have several implications and also suggest several directions for future research. First, although dilute, paramagnetic, Eu2+ only weakly suppresses SC, antiferromagnetically ordered Eu2+ appears to prevent its formation. As has been the case for other magnetic superconductors, specifically the RNi2B2C materialsCanfield2 , a dramatic difference in the effects of local moments on SC can be observed when comparing disordered, single ions in paramagnetic state, and an antiferromagnetically ordered sublattice. In the case of (Ho1-xDyx)Ni2B2CCanfield2 ,Cho as crosses from above to below it, the cause of pair breaking changes from spin-flip scattering off of single impurities to interactions with magnetic excitations of the order state. In the case of Sr1-yEuy(Fe0.88Co0.12)2As2 the sudden loss of superconductivity as rises above implies that somehow long range antiferromagnetic order of the Eu sublattice strongly suppresses (or removes) necessary ingredients for the establishment of the superconducting state. If antiferromagnetic fluctuations of the Fe-sublattice (associated with the orderingZhao ) are associated with the pairing in the superconducting state, then long range order of the large () Eu sublattice with an ordering wave vector of could easily be related to a dramatic change in the Fe sublattice fluctuation spectrum. Such a dramatic change in the fluctuations could easily be the suppressed, missing ingredient for superconductivity invoked above. So, unlike DyNi2B2C, which apparently requires antiferromagnetic ordering of the Dy sublattice to suppress pair breaking of the individual Dy momentsCanfield2 , Sr1-yEuy(Fe0.88Co0.12)2As2 requires the Eu sublattice to remain in the disordered, paramagnetic state in order to establish the FeAs-based superconducting state.
Although this hypothesis readily explains the sudden loss of SC when , it also would imply that the SC state below , when , should be modified; although figures 8, 11, and 12 show that there is no effect of on the low field magnetization and zero field resistivity when , it is reasonable to anticipate that there will be changes in other superconducting parameters such as the superfluid density and penetration depth.
IV Conclusions
Transport and thermodynamic measurements were performed on Sr(Fe1-xCox)2As2 and Sr1-yEuy(Fe0.88Co0.12)2As2 single crystals. A superconducting dome is identified in Sr(Fe1-xCox)2As2 as a function of Co doping and the optimal Co concentration is determined to be . The SC of the optimal Co doping is gradually suppressed by paramagnetic Eu2+ following AG theory and found to coexist with AF of Eu2+ for . For higher Eu2+ doping, bulk SC disappears suddenly when . We speculate that the long range order of Eu2+ sublattice is coupled to the AF fluctuations of Fe sublattice and the suppression of the Fe fluctuations required for FeAs-based SC is what gives rise to the abrupt loss of bulk SC when surpasses .
V Acknowledgements
The authors acknowledge Alex Thaler for experimental assistance, Cedomir Petrovic, Jörg Schmalian and Rafael M. Fernandes for helpful discussions. This work was carried out at the Iowa State University and supported by the AFOSR-MURI grant #FA9550-09-1-0603 (Rongwei Hu, Paul C. Canfield). Part of this work was performed at Ames Laboratory, US DOE, under contract # DE-AC02-07CH 11358 (Sergey L. Bud’ko, Warren E. Straszheim and Paul C. Canfield). Sergey L. Bud’ko was also partially supported by the State of Iowa through the Iowa State University.
References
- (1) A.A. Abrikosov, L.P. Gor’kov, Sov. Phys. JETP 16, 1575 (1962)
- (2) B.T. Matthias, H. Suhl, E. Corenzwit, Phys. Rev. Lett, 1, 92 (1958)
- (3) Matthias B T, Suhl H and Corenzwit E, Phys. Rev. Lett. 1 449 (1958)
- (4) L. J. Williams, W. R. Decker, and D. K. Finnemore, Phys. Rev. B 2, 1287 (1970)
- (5) K. Machida, Appl. Phys. A 35, 193 (1984)
- (6) K-H Müller and V N Narozhnyi, Rep. Prog. Phys. 64 943 (2001).
- (7) L. C. Gupta, Advances in Physics, 55, 691 (2006).
- (8) O Ø. Fischer, M. B. Maple, Superconductivity in Ternary Compounds I, Structural, Electronic and Lattice Properties, Springer (1982).
- (9) K. Buschow, E. Wohlfarth, Ferromagnetic Materials, Chap. 6, Elsevier, Amsterdam (1990).
- (10) Charles P. Poole Jr., Paul. C. Canfield, Arthur P. Ramirez, Handbook of superconductivity, Pages 71-108 (2000).
- (11) Paul C. Canfield, Peter L. Gammel and David J. Bishop, Physics Today, 51, 40 (1998).
- (12) Y. Kamihara, T. Watanabe, M. Hirano, and H. Hosono, J. Am. Chem. Soc. 130, 3296 (2008).
- (13) M. Rotter, M. Tegel, and D. Johrendt, Phys. Rev. Lett. 101, 107006 (2008).
- (14) A. S. Sefat, R. Jin, M. A. McGuire, B. C. Sales, D. J. Singh, and D. Mandrus, Phys. Rev. Lett. 101, 117004 (2008).
- (15) Paul C. Canfield and Sergey L. Bud’ko, Annual Review of Condensed Matter Physics, 1, 27 (2010).
- (16) N. Ni, M. E. Tillman, J.-Q. Yan, A. Kracher, S. T. Hannahs, S. L. Bud’ko, and P. C. Canfield, Phys. Rev. B 78, 214515 (2008).
- (17) A. Leithe-Jasper, W. Schnelle, C. Geibel, and H. Rosner, Phys. Rev. Lett. 101, 207004 (2008).
- (18) D. K. Pratt, W. Tian, A. Kreyssig, J. L. Zarestky, S. Nandi, N. Ni, S. L. Bud’ko, P. C. Canfield, A. I. Goldman, and R. J. McQueeney, Phys. Rev. Lett. 103, 087001 (2009).
- (19) C Bernhard, A J Drew, L Schulz, V K Malik, M Rossle, Ch Niedermayer, Th Wolf, G D Varma, G Mu, H-H Wen, H Liu, G Wu and X H Chen, New J. Phys., 11, 055050 (2009).
- (20) R. Khasanov, A. Maisuradze, H. Maeter, A. Kwadrin, H. Luetkens, A. Amato, W. Schnelle, H. Rosner, A. Leithe-Jasper, and H.-H. Klauss, Phys. Rev. Lett. 103, 067010 (2009).
- (21) Y. Laplace, J. Bobroff, F. Rullier-Albenque, D. Colson, and A. Forget, Phys. Rev. B 80, 140501 (2009).
- (22) H. S. Jeevan, Z. Hossain, Deepa Kasinathan, H. Rosner, C. Geibel and P. Gegenwart, Phys. Rev. B 78, 052502 (2008).
- (23) C. F. Miclea, M. Nicklas, H. S. Jeevan, D. Kasinathan, Z. Hossain, H. Rosner, P. Gegenwart, C. Geibel and F. Steglich, Phys. Rev. B 79, 212509 (2009).
- (24) M. Nicklas, M. Kumar, E. Lengyel, W. Schnelle, A. Leithe-Jasper, arXiv:1006.3471v1 (2010).
- (25) Milton S. Torikachvili, Sergey L. Bud’ko, Ni Ni, Paul C. Canfield, Phys. Rev. Lett. 101, 057006 (2008).
- (26) Patricia L. Alireza, Y. T. Chris Ko, Jack Gillett, Chiara M. Petrone, Jacqueline M. Cole, Gilbert G. Lonzarich, Suchitra E. Sebastian, J. Phys.: Condens. Matter 21, 012208 (2009).
- (27) S. R. Saha, N. P. Butch, K. Kirshenbaum, and Johnpierre Paglione, Phys. Rev. Lett. 103, 037005 (2009).
- (28) E. Colombier, S. L. Bud’ko, N. Ni, P. C. Canfield, Phys. Rev. B 79, 224518 (2009).
- (29) S. Kawasaki, T. Tabuchi, X. F. Wang, X. H. Chen and Guo-qing Zheng, Supercond. Sci. Technol. 23, 054004 (2010).
- (30) Tuson Park, Eunsung Park, Hanoh Lee, T. Klimczuk, E. D. Bauer, F. Ronning and J. D. Thompson, J. Phys.: Condens. Matter 20 322204 (2008).
- (31) R. D. Shannon, Acta Cryst., A32 751 (1976).
- (32) Y He, T Wu, G Wu, Q J Zheng, Y Z Liu, H. Chen, J J Ying, R H Liu, X F Wang, Y L Xie, Y J Yan, J K Dong, S Y Li and X H Chen, J. Phys.: Condens. Matter 22, 235701 (2010).
- (33) P. C. Canfield and Z. Fisk, Philos. Mag. B 65, 1117 (1992).
- (34) S. R. Saha, N. P. Butch, K. Kirshenbaum, and Johnpierre Paglione, Phys. Rev. B 79, 224519 (2009).
- (35) Hunter B., ”Rietica - A visual Rietveld program”,International Union of Crystallography Commission on Powder Diffraction Newsletter No. 20, (Summer) http://www.rietica.org (1998).
- (36) Hidenori Hiramatsu, Takayoshi Katase, Toshio Kamiya, Masahiro Hirano, and Hideo Hosono, Phys. Rev. B 80, 052501 (2009).
- (37) A. Jesche, N. Caroca-Canales, H. Rosner, H. Borrmann, A. Ormeci D. Kasinathan, H. H. Klauss, H. Luetkens, R. Khasanov, A. Amato, A. Hoser, K. Kaneko, C. Krellner, and C. Geibel, Phys. Rev. B 78, 180504 (2008).
- (38) J.-Q. Yan, A. Kreyssig, S. Nandi, N. Ni, S. L. Bud’ko, A. Kracher, R. J. McQueeney, R. W. McCallum, T. A. Lograsso, A. I. Goldman, and P. C. Canfield, Phys. Rev. B 78, 024516 (2008).
- (39) R. Prozorov, M. A. Tanatar, Bing Shen, Peng Cheng, Hai-Hu Wen, S. L. Bud’ko, P. C. Canfield, Phys. Rev. B 82, 180513(R) (2010).
- (40) Jack Gillett, Sitikantha D. Das, Paul Syers, Alison K. T. Ming, Jose I. Espeso, Chiara M. Petrone, and Suchitra E. Sebastian, arXiv:1005.1330 (2010).
- (41) Deepa Kasinathan, Alim Ormeci, Katrin Koch, Ulrich Burkhardt, Walter Schnelle, Andreas Leithe-Jasper and Helge Rosner, New J. Phys. 11 025023 (2009).
- (42) Zhi Ren, Zengwei Zhu, Shuai Jiang, Xiangfan Xu, Qian Tao, Cao Wang, Chunmu Feng, Guanghan Cao, and Zhu’an Xu, Phys. Rev. B 78, 052501 (2008).
- (43) Y. Xiao, Y. Su, M. Meven, R. Mittal, C. M. N. Kumar, T. Chatterji, S. Price, J. Persson, N. Kumar, S. K. Dhar, A. Thamizhavel, and Th. Brueckel, Phys. Rev. B 80, 174424 (2009).
- (44) Shuai Jiang, Yongkang Luo, Zhi Ren, Zengwei Zhu, Cao Wang, Xiangfan Xu, Qian Tao, Guanghan Cao and Zhu’an Xu, New Journal of Physics 11, 025007 (2009).
- (45) M. E. Fisher, Phil. Mag., 7, 1731 (1962).
- (46) L. J. de Jongh, A. R. Miedema, Adv. Phys., 23, 1 (1974).
- (47) Taichi Terashima, Nobuyuki Kurita, Akiko Kikkawa, Hiroyuki S. Suzuki, Takehiko Matsumoto, Keizo Murata, and Shinya Uji, J. Phys. Soc. Jpn. 79, 103706 (2010).
- (48) T. A. Wiener, I. R. Fisher, S. L. Bud’ko, A. Kracher, and P. C. Canfield, Phys. Rev. B 62, 15056 (2000).
- (49) Taichi Terashima, Motoi Kimata, Hidetaka Satsukawa, Atsushi Harada, Kaori Hazama, Shinya Uji, Hiroyuki S. Suzuki, Takehiko Matsumoto, and Keizo Murata, J. Phys. Soc. Jpn. 78 083701 (2009).
- (50) B. K. Cho, P. C. Canfield, D. C. Johnston, Phys. Rev. Lett., 77, 163 (1996).
- (51) J.Zhao, W. Ratcliff, J. W. Lynn, G. F. Chen, J. L. Luo, N. L. Wang, J. P. Hu, and P. C. Dai, Phys. Rev. B 78, 140504 (2008).