Chemical Influences on Ice Crystal Growth from Vapor
Kenneth Libbrecht and Robert Bell
Department of Physics, California Institute of Technology
Pasadena, California 91125
address correspondence to: kgl@caltech.edu
Abstract. We present an investigation of chemical influences on the growth of ice crystals from water vapor. In one set of experiments, we grew ice crystals in a vapor diffusion chamber, observing crystal morphologies at temperatures from 0 C to -25 C in different background gases and with a variety of gaseous chemical additives. In a second set of experiments, we measured ice crystal growth rates at -5 C and -15 C in a free-fall flow chamber, using normal laboratory air and ultra-clean nitrogen gas, both with and without chemical additives. Conclusions from these experiments include: 1) In nitrogen gas at a pressure of one atmosphere, no tested chemical additives at concentrations below 10 ppm produced any observable changes in ice crystal growth morphologies; 2) Growth in ultra-clean nitrogen gas was not significantly different from growth in ordinary laboratory air; 3) Chemical additives affected plate-like dendritic growth at -15 C more readily than growth at higher temperatures; 4) Chemical additives tended to promote the growth of columnar crystals over plate-like crystals; 5) Ice growth in air, nitrogen, helium, argon, hydrogen, and methane gases at a pressure of one atmosphere yielded essentially the same temperature-dependent crystal morphologies.
[The figures in this paper have been reduced in size to facilitate rapid downloading. The paper is available with higher resolution figures at http://www.its.caltech.edu/~atomic/publist/kglpub.htm, or by contacting the authors.]
1 Introduction
The formation of snow crystals – ice crystals that grow from water vapor in the atmosphere – is a remarkably complex process that produces a rich phenomenology of growth structures and patterns. Although researchers have documented snow crystal morphologies for centuries, and have studied ice growth under controlled conditions for over 75 years, our basic understanding of ice crystal growth dynamics remains poor [1]. For example, the observed change in ice growth rates and morphologies with temperature has yet to be explained at even a qualitative level.
One hindrance to the study of ice crystal growth dynamics is the influence of unwanted chemical impurities that are always present at some level in every experimental apparatus. Vapor impurities in the background gas surrounding a growing ice crystal can attach to the crystal surface and affect its growth in unanticipated ways. If the impurity concentrations are not known and are not controlled, then ice growth measurements may yield unreliable results.
Although much work has been done on the interaction of trace gases in the atmosphere with ice surfaces [2], relatively little systematic research has investigated how surface chemistry affects ice crystal growth. Nevertheless, it has been known for decades that chemical additives can dramatically change ice growth rates and morphologies. Vonnegut [3, 4, 5] found that while plates are the normal growth morphology at -20 C in air, the addition of 10 ppm of butyl alcohol yielded columnar growth instead. Schaefer [6, 4] further observed that vapors of ketones, fatty acids, silicones, aldehydes, and alcohols could all change ice growth morphologies to varying degrees. Nakaya, Hauajima, and Mugurama [7] observed that even trace silicone vapor in air caused columnar crystals to grow at -15C, while the usual habit at this temperature is plate-like. Hallett and Mason [5] found that the addition of camphor vapor in air could yield columnar ice crystals at all temperatures in the range C C. These authors also observed that isobutyl alcohol in air changed ice growth near -15 C from plates to columns and then back to plates again as the concentration was increased. Anderson, Sutkoff, and Hallett [8] found that Methyl 2-Cyanoacrylate in air could change the morphology from plate-like dendrites to needles at -15 C. Libbrecht, Crosby, and Swanson [9] found that acetic acid and other vapors promoted the c-axis growth of “electric” needle crystals in air near -5 C. And Knepp, Renkens and Shepson [10] observed various morphological changes caused by acetic acid vapor in air, even in concentrations as low as 1 ppm. Given our poor understanding of ice growth without the complicating effects of chemical additives, it should come as no surprise that there is essentially no theoretical understanding, even at a qualitative level, of how chemical additives alter growth rates and change growth morphologies.
The current investigation was undertaken in response to a speculative hypothesis put forth by Libbrecht [11], postulating that even the low levels of chemical impurities that are normally present in ordinary air could profoundly affect ice growth rates, and could explain the enigmatic snow crystal morphology diagram. This hypothesis predicted that ice growth rates would increase rather dramatically in extremely clean air, so we set out to test this prediction. In addition to producing an especially clean growth environment, we also examined ice growth as various chemical vapors were added to the background air, in an effort to produce a more quantitative survey of chemical influences on ice crystal growth.
2 Diffusion Chamber Experiments
In one set of experiments we observed ice growth in a water vapor diffusion chamber operating at a pressure of one atmosphere. We used this chamber to investigate morphological changes as a function of concentration for a variety of chemical additives in nitrogen gas, and to examine ice growth in other pure gases. The diffusion chamber has the advantage that one can simultaneously observe ice growth over a range of temperatures, in our case from C 0 C. One disadvantage, however, is that the supersaturation varies with location in the chamber and is thus is only approximately known.
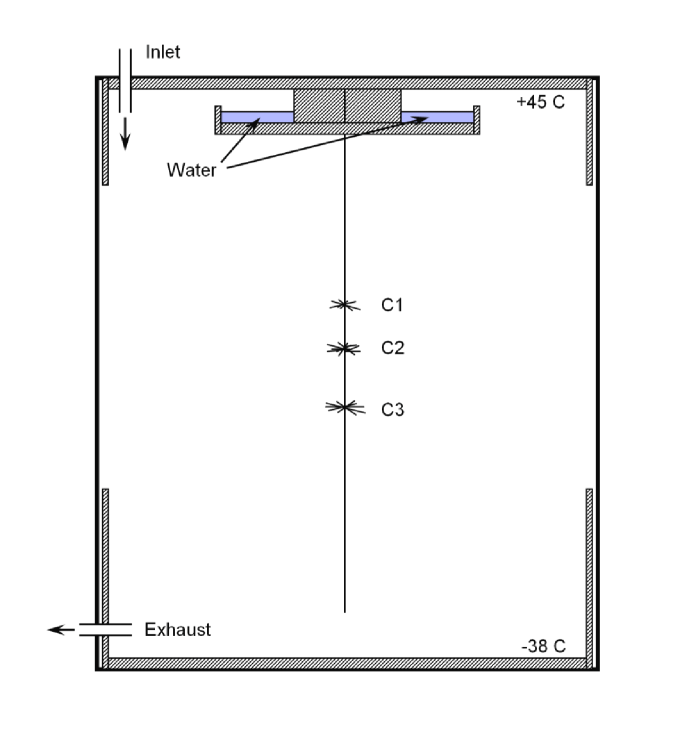
A schematic diagram of our diffusion chamber is shown in Figure 1. It is essentially a sealed cylindrical chamber with an inside height of 36 cm and an inside diameter of 20 cm (total volume 11.3 liters), with inside surfaces made primarily from acrylic, aluminum, and copper. During operation the top of the chamber was heated to 45 C while the bottom was cooled to -38 C, and the entire chamber was thermally insulated from its surroundings. Water vapor diffusing down from the water reservoir produced a highly supersaturated environment inside the chamber, and a removable monofilament nylon string with a diameter of 0.2 mm was placed along the axis of the chamber to nucleate the growth of ice crystals. A typical run with this chamber lasted ~10 hours, during which the string was wiped and replaced approximately every 60-90 minutes. After each run the chamber was opened and baked for 1-2 days to remove residual chemicals.
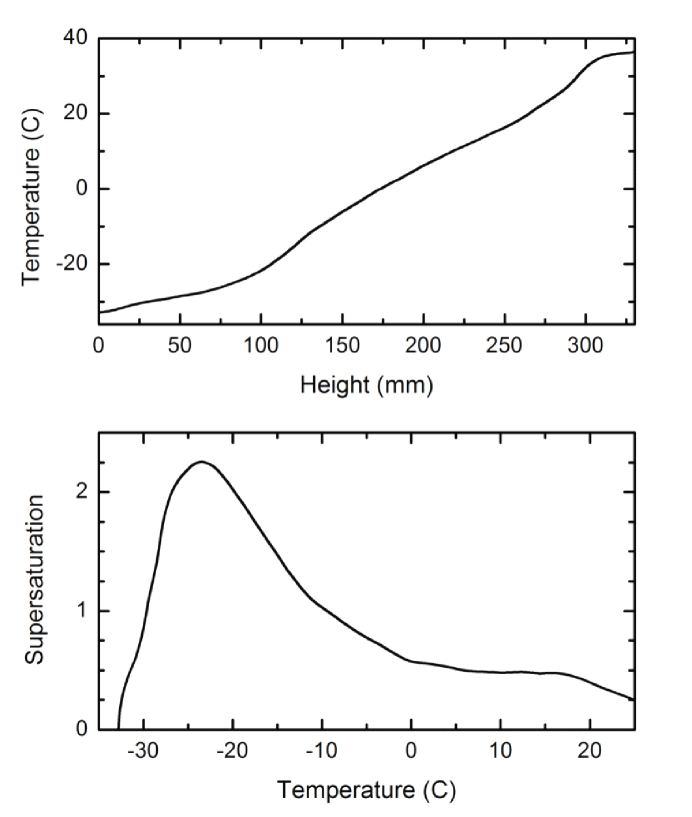
The measured on-axis temperature profile of the diffusion chamber (where is height above the base of the chamber) is shown in Figure 2. Metal plates (shaded in Figure 1) reduced condensation near the top of the chamber and produced an especially steep temperature gradient (and thus high supersaturation) at temperatures near C. A calculated on-axis water-vapor supersaturation in the chamber is also shown in Figure 2. Note that while the temperature profile was easily measured in situ, the supersaturation profile shown in Figure 2 was determined by modeling diffusion inside the chamber, and we expect that the modeled is only a rough approximation of the true supersaturation seen by the growing crystals.
The largest perturbation to the calculated supersaturation was the presence of ice crystals growing on the string, which substantially lowered the on-axis supersaturation. Comparing the growth velocities of needle crystals with [9], we estimate that crystals extending the farthest from the string experienced a supersaturation . Crystals growing closer to the string, which were shadowed by neighboring crystals, experienced substantially lower supersaturations. In addition to this effect, there were likely weak convection currents in the chamber that affected the supersaturation profile even in the absence of ice crystals. Because of this uncertainly in the supersaturation, our diffusion chamber observations were mainly qualitative in nature, as discussed below. We were able, however, to crudely examine ice crystal growth as a function of supersaturation in our experiments by observing morphological differences between shadowed and less shadowed crystals.
2.1 Baseline Crystal Morphologies
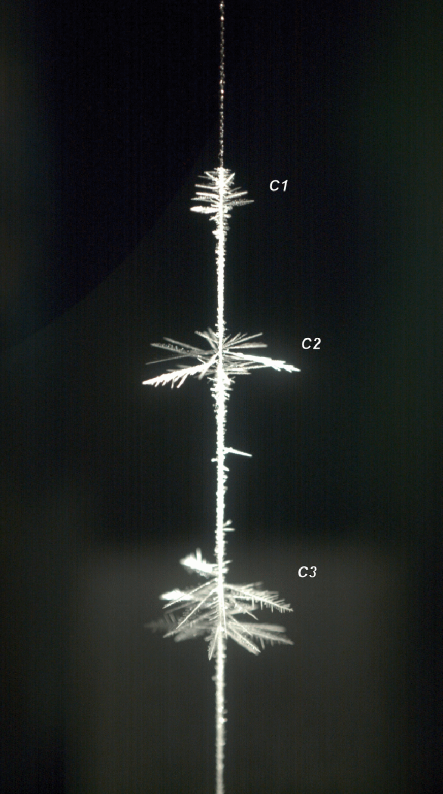
In the absence of any chemical additives, we observed the usual three dominant clusters of ice crystals growing on the string [5, 4] in air or nitrogen at one atmosphere, which we label C1, C2, and C3 in Figures 1 and 3. One hour after placing the string, we observed the following:
C1 – A small cluster of planer dendritic crystals growing at C. This cluster was typically first visible after 45-60 minutes of growth, and at one hour the longest crystals were about 2-3 mm in length. The morphology was mainly plate-like dendritic crystals with sidebranching, although crystals growing in lower- regions (shadowed by other crystals) exhibited a sectored-plate morphology. Condensed water droplets were observed above C1 on the string, while small sectored plates were seen immediately below C1.
C2 – A well defined cluster of needle-like crystals centered at C. This cluster was usually visible after 10-15 minutes, and the vertical width of the cluster was about 2 mm, implying a temperature range of about C. At one hour the longest crystals were about 6 mm in overall length. Crystals in the upper half of the cluster exhibited a “fishbone” morphology [12], while slender columnar crystals grew in the lower half of the cluster. Well developed hollow columns were seen immediately below C2.
Crystals growing between C2 and C3 (i.e. at temperatures in the range C C) were mainly small and blocky, although some “blocky spikes” were also seen. These spikes appeared to be equivalent to the fishbone morphology, except without distinct sidebranching. A blocky spike thus had the appearance of a thick needle-like crystal with stout blocky protrusions along its length.
C3 – A well-defined cluster of planer dendritic crystals growing at C. This cluster was usually visible after 10-15 minutes, with a vertical width of 5-6 mm, implying a temperature range of C. At one hour the longest crystals were about 10 mm in length, with tip growth velocities near 3 m/sec. These crystals exhibited a fern-like dendritic structure with much sidebranching. Sectored plate crystals without sidebranching appeared immediately above and below C3, and in low- regions.
Note that the baseline ice crystal morphologies and growth rates depend on the detailed temperature and supersaturation profiles in the diffusion chamber. From our experience working with diffusion chambers over many years, we have found that C2 and C3 are robust and clearly visible features as long as the supersaturation is sufficiently high and the chamber is clean. In other diffusion chambers with different temperature profiles, however, C1 is not always visible as a clearly defined cluster of large crystals.
2.2 Chemical Additives
Vaporous chemicals were added to the diffusion chamber by mixing with clean nitrogen gas, such that the total flow rate through the chamber was constant at 6.2 ml/sec, which replaced the gas in the chamber every 30 minutes. The flow entered the top of the chamber and exited the bottom, as shown in Figure 1. Tests with clean nitrogen gas showed that this flow rate moved the crystal peaks down about 3 mm, reflecting a shift in air temperature relative to the zero-flow profile, but otherwise did not noticeably change the crystal morphologies along the string. Thus flow with nitrogen gas only produced the baseline morphologies described above.
Two strategies were used to add vaporous chemicals to the flowing nitrogen gas. For the lowest concentrations, a measured volume of air saturated with chemical vapor (above the liquid phase) was injected into a 1.2 liter flask, and a flow of 0.4 ml/sec through this flask was mixed with a nitrogen flow of 5.8 ml/sec. The combined gas was then flowed through the diffusion chamber. Additional saturated air was injected into the flask as needed to keep the chemical concentration constant to within a factor of three. For higher concentrations, a small amount of liquid was added to the flask to saturate the air above it. Then the flow rates were adjusted to yield the desired vapor fraction, up to the saturated vapor pressure of the chemical being tested. Note that chemicals absorbed by the walls of the diffusion chamber were not factored into our analysis, and in situ chemical concentrations were not measured. With a replacement time of 30 minutes, however, we expect that absorption did not change the input concentrations appreciably.
During a typical run, we first observed the baseline crystal growth in the absence of any chemical additives to verify that the diffusion chamber was sufficiently clean. We then increased the concentration of the chemical additive being tested at roughly a factor of three per hour. We periodically cleaned and replaced the string during this time, thus observing the crystal morphologies as a function of vaporous chemical concentration in nitrogen gas. Detailed observations are given in Appendix I for the chemical additives tested, and conclusions from these experiments are discussed below.
3 Flow Chamber Experiments
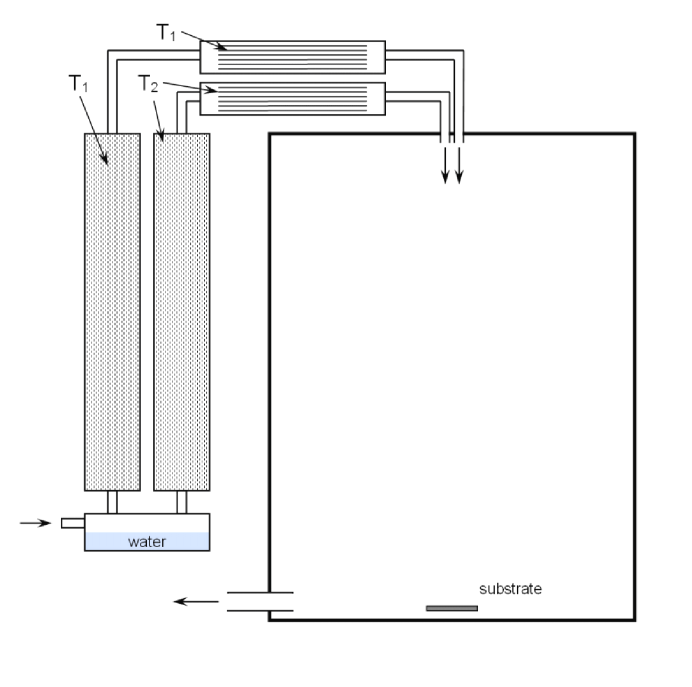
In a second set of experiments we observed ice crystal growth in a free-fall flow chamber, shown schematically in Figure 4. This experiment was designed primarily to produce a supersaturated environment that had the lowest achievable levels of chemical contaminants, in order to test whether very low-level contaminants played a significant role in ice growth. We used a high-pressure dewar of liquid nitrogen as the input gas source, as we expected the nitrogen boil-off to be relatively uncontaminated compared to other gas sources. (However, we did not measure the gas purity directly in our experiments.) Warm, dry nitrogen gas from the dewar first entered a water reservoir (see Figure 4), and tests showed that flow over the water surface provided sufficient hydration for our purposes. The hydrated gas then flowed through a series of heat exchangers that yielded two gas flows that were saturated with water vapor at known temperatures and shown in Figure 4.
The flows were then mixed in the main chamber (which was separately cooled) to produce supersaturated gas at an intermediate temperature. A nucleator created ice crystals that were observed as they fell onto a substrate at the bottom of the chamber, following [13, 14]. To reduce the effects of contaminants entering the chamber via outgassing from the chamber walls and heat exchangers, the total flow rate was kept at 1 liter/second – sufficient to replace all the gas in the chamber every three minutes.
The supersaturation in the main chamber was found to be substantially lower than that calculated from mixing of the two gas flows, and we attribute this to turbulent flow causing an especially rapid interaction with the walls of the main chamber. Since the chamber walls were coated with ice during the experiments, this interaction acted to reduce the supersaturation from the calculated value. Thus we used the crystal growth in air to estimate the supersaturation, comparing our results with data from [14].
3.1 Growth in Clean Nitrogen Gas
We compared ice growth in ultra-clean nitrogen gas and ordinary air by changing the input source while leaving everything else in the experiment fixed. The air source was laboratory air that had been first filtered and dehydrated, so the hydration step was the same for the two gas sources. Although the supersaturation was not independently known in these measurements, the similar gas paths and experimental protocols insured that the supersaturation in nitrogen and in air were nearly identical.
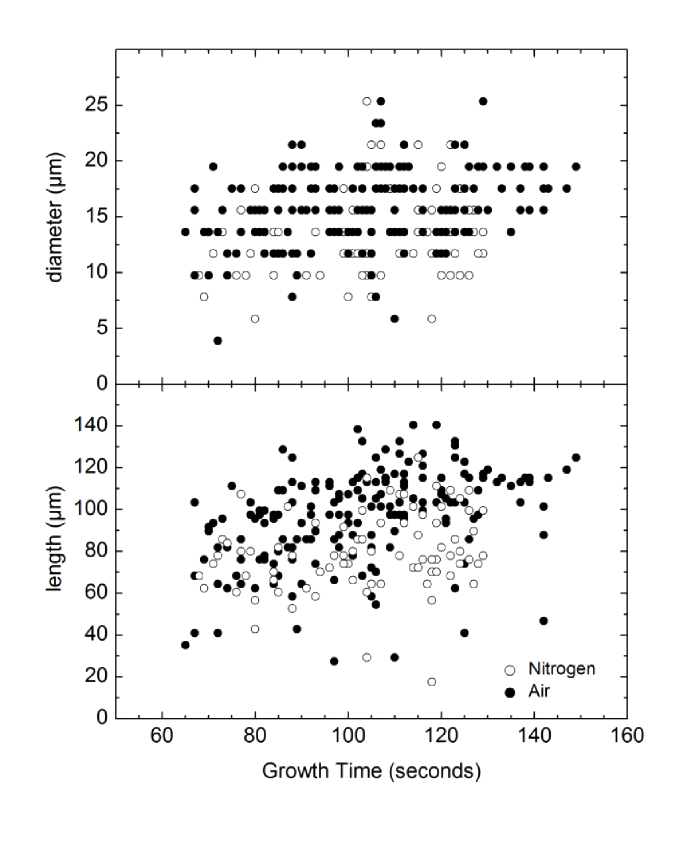
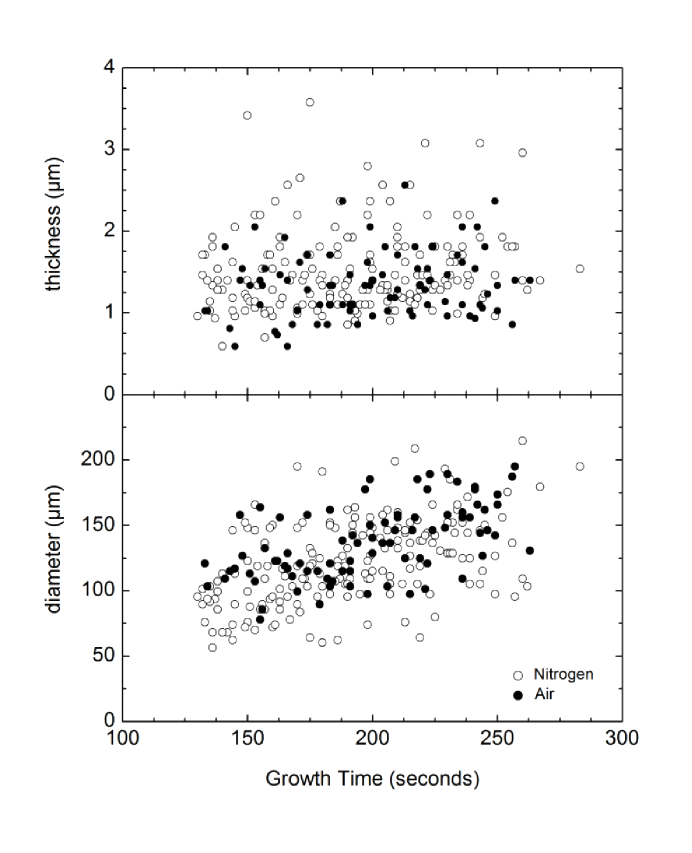
Data from runs at C and C are shown in Figures 5 and 6, respectively. From these data we see that the growth rates were indistinguishable to an accuracy of 10-20 percent at both temperatures. We estimate that changes in growth at this level could be brought about by residual systematic differences between the runs with air and with nitrogen gas.
3.2 Growth with Added Acetone
We further explored the growth of plate-like crystals at -15 C in our flow chamber as a function of added acetone vapor. A separate nitrogen gas flow was mixed with the main flow of liquid nitrogen boil-off to produce a known concentration of acetone in nitrogen. Although some acetone was likely absorbed in the heat exchangers, we expect that the high flow rate produced an acetone concentration inside the main chamber that was close to the calculated value.
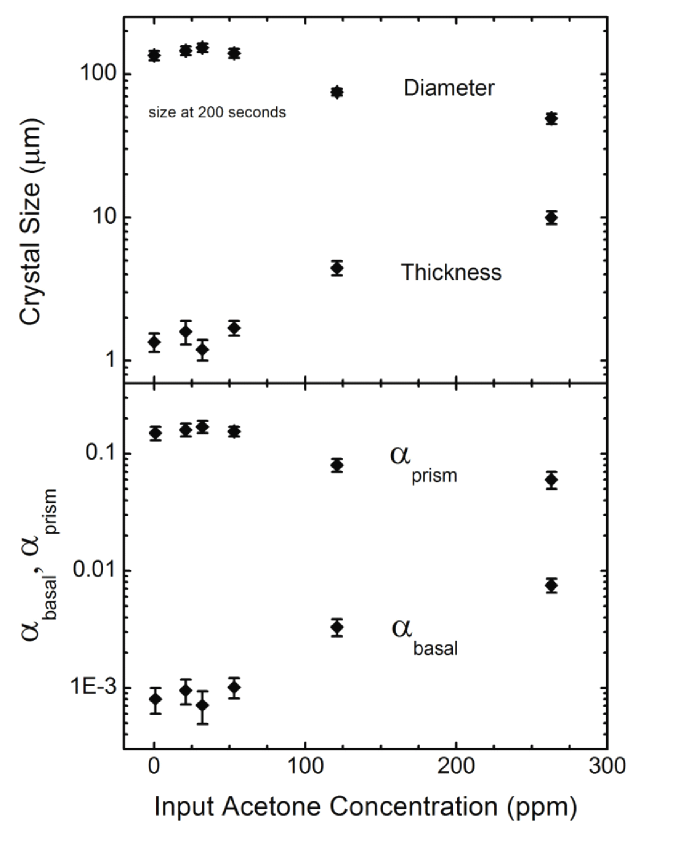
Results from these measurements are shown in Figure 7, which gives ice crystal diameters and thicknesses after 200 seconds of growth as a function of acetone concentration. Note that the crystals become more blocky with increased acetone concentration, consistent with the disappearance of the C3 peak in the diffusion-chamber data for acetone. The flow chamber data showed little change below 50 ppm, roughly consistent with the diffusion-chamber data, even though the water vapor supersaturation was substantially higher in the diffusion chamber. (The higher supersaturation in the diffusion chamber yielded dendritic crystals with many sidebranches, as opposed to the simple plate-like crystals seen in the flow chamber).
From the crystal sizes at low acetone concentration, along with prior data from [14], we estimated that the supersaturation was approximately 2 percent in the flow chamber data. Using this value, we then used cellular-automata modeling of diffusion-limited growth [15] to estimate the condensation coefficients as a function of acetone concentration, which are also shown in Figure 7. We see that shows the largest change with added acetone, but we also see that a decrease in accompanies the increase in
4 Conclusions and Discussion
From the experiments described above, we draw the following conclusions relating to the growth of ice crystals from water vapor in the presence of an inert background gas with added chemical vapors.
Chemical additives below 1-10 ppm have little effect on ice growth. In our experiments we found that even the most active chemical additives produced no significant changes in growth morphologies at concentrations below 10 ppm. Other authors (see above) have reported growth changes with as little as 1 ppm in some cases, but this may depend on supersaturation, observation time, and other experimental differences. From the preponderance of data, it seems reasonable to conclude that very low-level chemical impurities, below 1-10 ppm for any chemical, likely have little effect on ice growth under typical experimental conditions.
There are a number of caveats we must add to this conclusion. First, all substances have not been tested, by us or others, so there may exist some chemical vapors that affect ice growth below the 1 ppm level. Second, the observations to date have been done at fairly high supersaturations, in order to produce conveniently rapid growth, and we suspect that slower ice growth might be more sensitive to the chemical environment. Third, the observations to date have been done at fairly high temperatures, above -25 C, and we again suspect that ice growth at lower temperatures might be affected by surface chemistry to a greater degree.
The most active chemical additives we found were the butanols – Isobutanol and 2-Butanol – as both resulted in a disappearance of the C3 peak at 30 ppm. Acetone was almost as active, showing C3 disappearance at 100 ppm.
Ice growth in very clean nitrogen gas is no different than in ordinary air. The timescale to form a monolayer of a strongly absorbed chemical impurity on an ice surface can be orders of magnitude shorter than typical crystal growth times, even at vapor concentrations of 1 ppm or lower [11]. If ice growth was being changed by very low impurity levels, however, we would have expected to see some change in growth rates between ordinary air and clean nitrogen. The fact that no changes at all were seen in our flow chamber data, both at -5 C and -15 C, casts serious doubt on Libbrecht’s hypothesis [11]. Rejecting this hypothesis leads us to the conclusion that the presence of even a chemically inert gas at a pressure of one atmosphere greatly reduces the surface attachment coefficients in comparison to rates at lower pressures. We suspect that an examination of ice growth rates as a function of gas background pressure may yield insights that help explain the morphology diagram.
The growth of thin, plate-like dendrites at -15 C is especially sensitive to chemical additives. In all our diffusion-chamber data, the disappearance of C3 was the first observable change in growth morphology as the additive concentration was increased. The other clusters, by contrast, were more robust and did not change their appearance appreciably until higher concentrations were reached. In general we found that C3 was less robust than C2, which in turn was less robust than C1.
In one run with acetone we found that the disappearance of C3 was not proceeded by a change in the peak growth temperature. The C3 peak remained near -15 C as dendritic growth gave way to the growth of smaller plates, followed by the peak disappearing entirely.
This conclusion may portend a more general statement that chemical additives have greater effects on ice growth as the temperature is reduced, although at present we have no evidence to make this extrapolation. We did not observe ice growth at temperatures below -25 C in our experiments. The data do suggest, however, that it would be prudent in future experiments at very low temperatures to consider the effects of chemical impurities in the apparatus carefully, perhaps even at levels substantially below 1-10 ppm.
We note that in Knepp et al. [10] the authors did not observe the C3 peak in their diffusion chamber during clean air runs. The fact that C3 is particularly sensitive to impurities suggests possible contamination problems in the Knepp et al. experiments.
Chemical additives usually promote columnar morphologies over plate-like morphologies. In our diffusion-chamber observations (see the Appendix), we often observed blocky spikes and/or columns at temperatures near -15 C, where plate-like crystals are normally observed. In some cases, especially at lower temperatures, the chemically induced columns were long and thin enough to be called needles. In contrast, we never saw a set of circumstances for which chemical additives promoted the growth of large thin plates at any temperature. The largest, thinnest plate-like crystals appeared only near -15 C and only in inert gases with no chemical additives.
Chemical activity for affecting ice growth has little correlation with solubility in water. The two chemicals we tested with the lowest solubilities in water – Dichloromethane and Xylenes – also produced the smallest changes in ice growth (i.e., these chemicals required the highest vapor concentrations before C3 disappeared). On the other hand, the butanols have fairly low solubilities yet were the most active chemicals tested. From the relatively small number of chemical vapors tested, it appears that solubility in water is not a dominant factor in determining chemical activity for affecting ice growth.
Many inert gases yield similar ice growth morphologies. In our experiments with air, nitrogen, argon, helium, hydrogen, and methane we observed essentially identical ice growth characteristics. Carbon dioxide did affect ice growth to a small degree, as described in the Appendix.
In summary, we have observed the effects of vaporous chemicals on ice growth, yielding the set of conclusions above. Our main motivation for this study was to obtain a more quantitative knowledge relating to how chemical impurities can affect ice growth experiments, in order to reduce unforeseen systematic errors in future measurements. We believe that our observations will be quite useful in this regard, as a guide to designing better experiments investigating the molecular dynamics of ice crystal growth.
Although chemical additives exhibit some essentially universal behavior in their effects on ice growth, our theoretical understanding of the underlying mechanisms responsible for these growth changes is quite poor. Additional experiments measuring ice growth rates as a function of temperature, supersaturation, and chemical concentration may yield additional interesting behaviors and insights beyond those found in the present experiments.
5 Appendix I - Results from Diffusion Chamber Observations
What follows are descriptions of ice crystal morphologies in comparison to the baseline morphologies (described above) seen in our diffusion chamber after one hour of growth. Morphologies are the same as in the baseline unless otherwise noted. For each chemical additive, the concentration in nitrogen gas was increased slowly with time while the string was periodically cleaned and replaced. Concentration refers to the partial pressure of the additive vapor divided by one bar.
5.1 Acetic Acid
Vapor pressure at 25 C = 16 Torr; miscible in water
100 ppm or less – No observable change from normal growth
300 ppm – C3 dendrite cluster gone, replaced by sparse blocky spikes
normal growth for C C
C1 appeared more quickly than normal, with enhanced sidebranching
1000 ppm – same as 300 ppm, but C1 especially fernlike
3000 ppm – all fernlike dendrites (C1) for C
fishbone variants and blocky spikes at lower temperatures
10000 ppm – liquid drops for C
small C1 dendrites without prism facets near C
fernlike C1 dendrites for C C
fishbone variants for C, with no retrograde sidebranches
5.2 Acetone
Vapor pressure at 25 C = 240 Torr; miscible in water
10 ppm or less – No observable change from normal growth
30 ppm – C3 growth slower, with plate-like sidebranching
100 ppm – C1, C2 normal
C3 gone, replace with small plates for C, larger plates for C C
300 ppm – C1 growth slower than normal
C2 normal; some stout columns between C1 and C2
stout hollow columns below C2; thinner hollow columns for C
1000 ppm – roughly same as at 300 ppm
3000 ppm – same
10000 ppm – C1, C2 about same as at 300 ppm
single broad cluster for C C, including fishbones with thin, blade-like sidebranching
30000 ppm – liquid droplets nucleate at all temperatures
5.3 Dichloromethane
Vapor pressure at 25 C = 400 Torr; solubility 1.3%
30000 ppm or less – No observable change from normal growth
10 percent – C1 and C2 normal; C3 gone
stout hollow columns for C C
thin hollow columns for C
50 percent – blocky plates for C C
needle clusters and fishbones for C C
stout hollow columns for C C
thin hollow columns and needles for C
5.4 Ethanol
Vapor pressure at 25 C = 60 Torr; miscible in water
300 ppm or less – No observable change from normal growth
1000 ppm – C3 replaced by a broad cluster of sectored plates
C2 appears at C, with normal appearance
3000 ppm – same as 1000 ppm, but C3 gone, replaced by blocky spikes and small plates
10000 ppm – liquid droplets nucleate on string at all temperatures
on already nucleated ice, C1 dendrites show enhanced branching, reduced prism faceting
5.5 Isobutanol
Vapor pressure at 25 C = 10 Torr; solubility 9%
10 ppm or less – No observable change from normal growth
30 ppm – C1, C2 normal
C3 initially showed sectored-plate sidebranches; later gone, replaced by small blocky spikes and small sectored plates
100 ppm – C1, C2 clusters normal
stout hollow columns for C C
thin hollow columns and needles for C
300 ppm – C1 normal
C2 replaced by thin blocky spikes
columns and needles for C, as at 100 ppm
1000 ppm – small planer dendrites with no prism faceting for C C
otherwise same as at 300 ppm
3000 ppm – small planer dendrites with no prism faceting for C C
C1 and C2 merged into broad cluster of spikes
stout hollow columns for C (no longer thin needles at lower temperatures)
10000 ppm – small leafy planer dendrites for C C; droplets above
small spikes and sectored plates at lower temperatures
5.6 2-Butanol
Vapor pressure at 25 C = 13 Torr; solubility 29%
10 ppm or less – No observable change from normal growth
30 ppm – C1, C2 normal
C3 gone, replaced by shorter dendrites and plates
100 ppm – C1, C2 clusters normal
stout hollow columns for C C
thin hollow columns and needles for C
300 ppm – C1 normal
C2 crystals shorter than normal, with branching at smaller angular separation
same as 100 ppm for C
1000 ppm – C1 and C2 merged into single cluster of spikes for C C
shorter spikes with end-plates close to
same as 100 ppm for C
3000 ppm – small planer dendrites with no prism faceting for C C
C1 and C2 merged into broad cluster of spikes at C
small plates mixed with spikes and blocky crystals for C
10000 ppm – well developed planer dendrites for C C
most large spikes and smaller blocky crystals for C C
small sectored plates for C
5.7 Isopropanol
Vapor pressure at 25 C = 44 Torr; miscible in water
30 ppm or less – No observable change from normal growth
100 ppm – C3 shows smaller, fewer, more plated dendrites, with large plates between dendrites
300 ppm – C3 gone, replaced with spikes and small plates
C1 and C2 normal; thin hollow columns between C1 and C2
stout hollow columns and plates for C C
1000 ppm – As above for C
spikes and some small plates for C C
then hollow columns for C
3000 ppm – C1 and C2 gone
stout hollow columns for C C
needles and hollow columns for C C
narrow hollow columns for C
10000 ppm – spikes with fine dendrites for C C
blocky spikes and small plates for C C
small plates for C
30000 ppm – only droplets observed on string at all temperatures
5.8 Xylenes
Vapor pressure at 25 C = 9 Torr; solubility 0.02%
1000 ppm or less – No observable change from normal growth
3000 ppm – C3 weak; dendrites appear with sectored-plate branches
10000 ppm – C3 gone, replaced by blocky spikes
C1, C2 normal
5.9 Pure Gases
In several runs with air, nitrogen, argon, helium, hydrogen, and methane gases at essentially 100 percent concentration in the diffusion chamber we did not observe substantial changes in ice growth morphologies. With carbon dioxide in the chamber we found that C1 and C2 were normal, while C3 was gone, being replaced by spikes and other small crystals.
References
- [1] Libbrecht, K. G., “The physics of snow crystals,” Rep. Prog. Phys., 68, 855-895 (2005).
- [2] Abbatt, J. P. D., “Interactions of atmospheric trace gases with ice surfaces: adsorption and reaction,” Chem. Rev. 103, 4783-4800 (2003).
- [3] Vonnegut, B., G. E. Res. Lab., Project Cirrus Occas. Rep. no. 5 (1948).
- [4] Mason, B. J., “The Physics of Clouds, 2nd Edition” Clarendon Press (1971), and references therein.
- [5] Hallet, J., and Mason, B. J. “The influence of temperature and supersaturation on the habit of ice crystals grown from the vapour,” Proc. Roy. Soc. A247, 440-453 (1958).
- [6] Schaefer, V. J., “The formation of ice crystals in the laboratory and the atmosphere,” Chem. Rev. 44, 291 (1949).
- [7] Nakaya, U., Hanajima, M., and Mugurama, J., “Physical investigations of the growth of snow crystals,” J. Fac. Sci. Hokkaido Univ., Ser. II-5, 87 (1958).
- [8] Anderson, B. J., Sutkoff, J. D., and Hallett, J., “Influence of Methyl 2-Cyanoacrylate monomer on habit of ice crystals grown from vapor,” J. Atmos. Sci. 26, 673–674, (1969).
- [9] Libbrecht, K. G., Crosby, T., and Swanson, M. “Electrically enhanced free dendrite growth in polar and non-polar systems,” J. Cryst. Growth 240, 241-254 (2002).
- [10] Knepp, T. N., Renkens, T. L., and Shepson, P. B., “Gas phase acetic acid and its qualitative effects on snow crystal morphology and the quasi-liquid layer,” Atmos. Chem. Phys. 9, 7679–7690 (2009).
- [11] Libbrecht, K. G., “Crystal growth in the presence of surface melting and impurities: An explanation of snow crystal morphologies,” arXiv:0810.0689 (2008).
- [12] Libbrecht, K. G., “Identification of a novel ‘fishbone’ structure in the dendritic growth of columnar ice crystals,” arXiv:0912.2522v1 (2009).
- [13] Libbrecht, K. G. and Morrison, H. C., “A convection chamber for measuring ice crystal growth dynamics,” arXiv:0809.4869 (2008).
- [14] Libbrecht, K. G., Morrison, H. C., and Faber, B., “Measurements of snow crystal growth dynamics in a free-fall convection chamber,” arXiv:0811.2994 (2008).
- [15] Libbrecht, K. G., “Physically derived rules for simulating faceted crystal growth using cellular automata,” arXiv:0807.2616 (2008).