A Search for Radio Transients in VLA Archival Images of the 3C 286 Field
Abstract
We present a search for radio transients in the field of the bright radio source 3C 286 using archival observations from the Very Large Array. These observations span 23 years and include 1852 epochs at 1.4 GHz in the C and D configurations. We find no transients in the field. The sensitivity of the observations is limited by dynamic range effects in the images. At large flux densities ( Jy), single epoch observations provide a strong limit on the transient surface density. At flux densities near the dynamic range threshold, we use the requirement that transient sources must appear in consecutive epochs to be confirmed as real. This sets the sensitivity at low flux densities to transient durations of day, while minute for high flux densities. At 70 mJy, we find a 1- limit on the surface density deg-2. At 3 Jy, we find a 1- limit deg-2. A future systematic search of the VLA archives can provide one to two orders of magnitude more sensitivity to radio transients.
1 Introduction
Radio transient (RT) sources probe the high energy population of the Universe. Known hosts to transient radio emission include neutron stars, black holes, supernovae, gamma-ray bursts, and highly magnetized stars and planets. Most of what is known about RTs has been learned from follow-up of events discovered at high-energy or optical wavelengths or through serendipitous discovery (e.g., Brunthaler et al., 2009). Systematic searches for RTs have been conducted but vast parameter space remains unexplored.
Blind searches for RTs are an important scientific goal for major new radio telescope facilities such as the Allen Telescope Array (Croft et al., 2010b; Bower et al., 2010), LOFAR (Hessels et al., 2009), ASKAP (Macquart et al., 2010), and the Long Wavelength Array (Lazio et al., 2010). But there is significant opportunity to identify RTs through analysis of archival radio data. Bower et al. (2007) used nearly 1000 observations of a blank field observed by the Very Large Array (VLA) over 20 years to identify a set of RTs that have no apparent counterpart at radio or optical wavelengths. Ofek et al. (2010) have suggested that these may be due to neutron stars. Levinson et al. (2002) and Gal-Yam et al. (2006) conducted a search for RTs at 1.4 GHz through a comparison of the VLA NVSS and FIRST survey catalogs that identified a radio supernova in the nearby galaxy NGC 4216. Bannister et al. (2010) recently completed a search at 843 MHz of the Molongolo Observatory Synthesis Telescope (MOST) data archives that uncovered 15 RTs and a larger number of variable sources. Some of the sources discovered in the Molongolo search appear similar to the RTs found by Bower et al. (2007) in that they have no faint radio or optical counterpart. Becker et al. (2010) found a population of faint, variable radio sources in the galactic plane, the majority of which are without multi-wavelength counterparts.
We describe here a search for radio transients in the field of the quasar 3C 286 with analysis of 1.4 GHz archival data from the VLA. One of the standard flux calibrators for the VLA, 3C 286 has been observed thousands of times over the life time of the array. This search builds on the work of Bower et al. (2007); however, observations in the vicinity of the bright (15 Jy) source 3C 286 place limits on the sensitivity that can be achieved. The dynamic range of these observations is limited by calibration errors and other systematic effects rather than by statistical noise. These calibration and systematic errors can produce an apparent source in the image that is well above the theoretical detection threshold. Accordingly, we require stronger evidence (such as appearance in consecutive epochs and comparisons with other cataloged sources in the field) to demonstrate the existence of an RT. We present the data and its analysis in §2, a simulation demonstrating the ability to identify sources with these methods in §3, our source detections and transient identification efforts in §4, limits in transient surface density in §5, and a summary in §6.
2 Data and Analysis
All of the data used were archived VLA observations. We limited our search to 1.4-GHz continuum-mode observations in C and D configurations. Continuum mode has a bandwidth of 50 MHz in two separate intermediate frequency bands and in both circular polarizations. In the longer baseline VLA configurations (A and B), bandwidth smearing reduces the area that can be imaged without significant losses. We selected all observations between April 1984 and May 2007. After culling epochs with corrupt or too few data, there were 1852 observations to inspect. The median duration of the epochs is 2 minutes; 0.2% of epochs have a duration shorter than 20 seconds and 0.7% of epochs have a duration longer than 20 minutes. The total integration time included is 167 hours.
We used an automated flagging, calibrating and imaging pipeline within the AIPS package originally developed for another archival field (Bower et al., 2007). We self-calibrated each epoch assuming a point source at the field center. As demonstrated in §3, this method permits recovery of other sources over a wide range of flux densities. Each epoch was then imaged over a square area slightly larger than two times the primary beam diameter. The presence of a bright calibrator (3C 286) at the center of the field permits us to perform amplitude and phase self-calibration on the data.
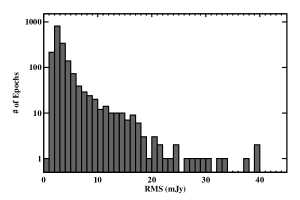
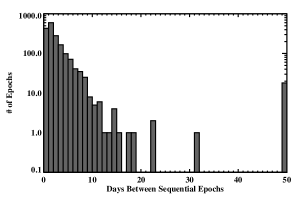
The median rms flux density of individual epoch images is 2 mJy, corresponding to a dynamic range of (Fig. 1). We also plot the histogram of separation between sequential epochs. The characteristic separation between epochs is day. Typical resolution in the C and D configurations is arcsec and 45 arcsec, respectively.
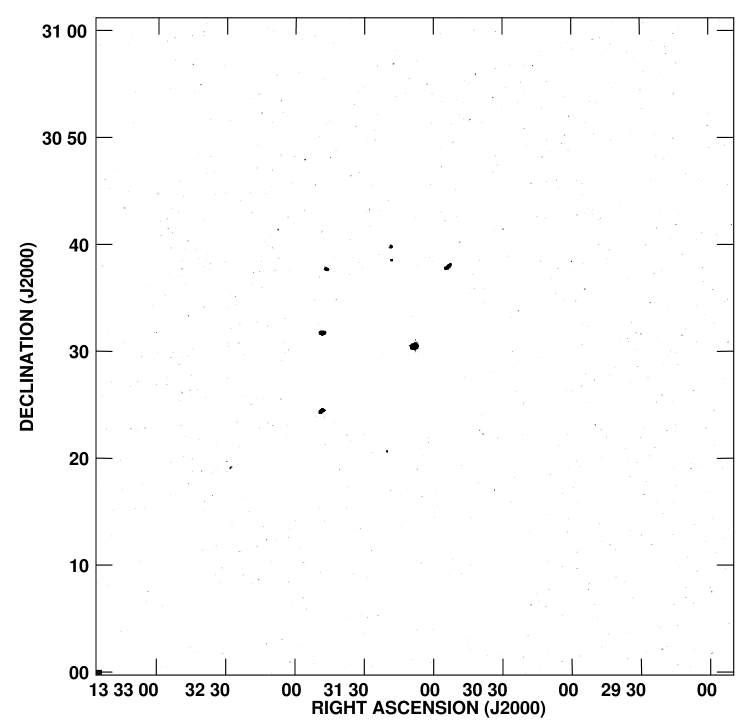
We created a deep image (Fig. 2) by combining 1517 of the epochs with the MIRIAD software package. The rms of the deep image excluding bright sources is 0.8 mJy and has a synthesized beam of arcsec2. The image is dynamic range limited and probably could be improved with a significant self-calibration effort. However, the image is very effective at identifying sources in the field that may show up in individual epoch images. We identify 10 sources in the field including 3C 286 (Table 1). As discussed below, we tabulate the detections of each of these sources in all of the epochs. We report the mean flux density over all the epochs, the modulation (i.e., root mean square variation) of that flux density, and the number of epochs in which sources are detected (). For sources with , we report the flux density from the deep image as the mean flux. The overdensity of strong sources in the vicinity of 3C 286 gives a useful benchmark against systematic errors.
3 Simulation
A concern in analysis of data of this kind is that self-calibration on the bright point source in the field will distort or disappear a transient source that is not included in the self-calibration model. The persistence of the other sources in the field demonstrates that self-calibration is robust against this problem for sources with fluxes between 30 and 200 mJy. We performed a simple simulation to explore the effect on sources with flux densities from 10 mJy to 25 Jy. The simulation creates fake data using the MIRIAD task UVGEN for the VLA D configuration of a 2-minute 1.4 GHz snapshot observation of 3C 286 at transit. The model sky is composed of the deep sources in Table 1 with an additional source at a separation of 700 arcsec from the field center with flux . Self-calibration is performed with a simple model of a point source at the phase center. The data are then imaged, cleaned, and restored. The flux density of the source at the phase center is consistent with the 3C 286 flux density until . The fake source is recovered consistently at the input flux density for Jy. This simulation confirms that we can recover RTs in the field over a wide range of flux densities.
4 RT Identification
The AIPS task SAD (Search And Destroy) was used to identify all sources in the fields brighter than over the full area imaged. We identified a total of 30067 sources in all epochs. We perform several exclusions to identify any transient sources. We reject any sources that are in the outer 2.5% of the image which may be affected by edge problems in the image. We reject any sources outside of the two times the primary beam radius. We reject any sources with a fitted size larger than 120 arcsec since we are only interested in point-like sources. We reject any sources within 0.08 deg of 3C 286. The latter step removes a large number of sidelobes associated with the bright point source. We also remove any sources that are matched (within a radius of 30″) to the known steady sources in Table 1; we tabulate the number of detections for each of these sources, . Three sources are detected in nearly all of the epochs; the faintest has a flux density of 73 mJy. Variations in the flux density indicate systematic uncertainty of . None of the sources show strong intrinsic variability.
After these cuts, we are left with 608 sources in the catalog. 186 of these sources are found to be repeating in different epochs and 3 are found to be repeating in consecutive epochs. Examination of the images reveals that many of these sources are associated with sidelobes of the synthesized beam. If we apply a higher threshold of , then we reduce the number of single epoch candidates to 78. Only 7 candidates are seen to repeat in any epoch and none are repeating in consecutive epochs. The repeating candidates all cluster near the brightest of the steady sources (J133148+303148) and are likely to be sidelobes.
Assuming purely Gaussian noise, the expected number of false positive sources given a statistical threshold for all epochs is , where erfc is the complementary error function. is the product of the number of epochs with the ratio of the search area to the synthesized beam area. For this experiment, . For , we expect . For , . Thus, the remaining candidates are either real RTs or they are systematic errors. Establishing the reality of any single epoch candidate is very difficult given the variable systematic errors present in the data. Thus, at the low sensitivity end, we primarily make use of only the consecutive event counts to estimate transient sensitivity. This has a characteristic time scale of the epoch separation day. At higher sensitivity, the characteristic RT time scale sampled is minute.
We note one unusual candidate source that showed up in a single epoch (13 July 1996). The source appeared as a bright (422 mJy) source with point-like structure. The steady sources were present in the image at the right flux densities. This candidate had the appearance of a convincing RT. However, examination of the visibility data during this 2-minute observation indicated a glitch. It appears that the online flagging system was effective in removing most of the bad data but some bad data remained. In those bad data, the phase center of the image was shifted. Imaging all of the data together led to point sources at the position of 3C 286 and at the shifted phase center. The result was an apparently convincing RT candidate until we removed two 10-second integrations. Note that this glitch differs from the end of record problem identified by Ofek et al. (2010). After exclusion of this event and four other single epoch candidates in which imaging revealed poorly flagged and/or poorly calibrated data, there were no single epoch candidates brighter than 250 mJy.
5 Transient Rate Estimates
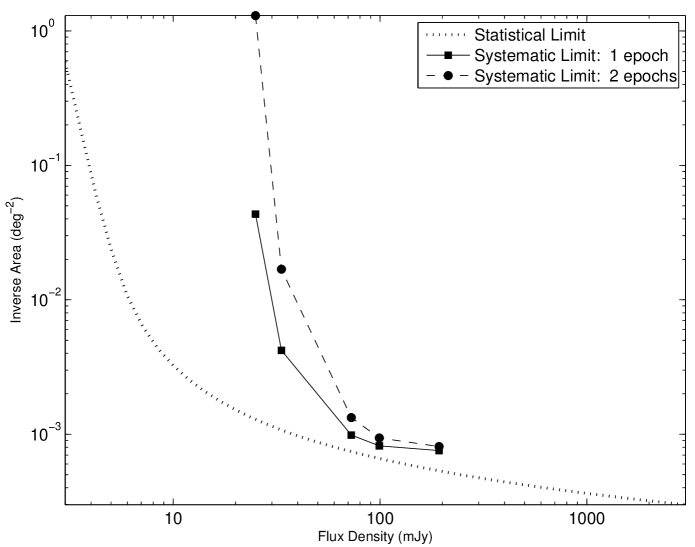
We calculate the transient surface density, , which is equivalent to the two-epoch transient rate, , given in earlier papers (Bower et al., 2007; Croft et al., 2010b; Bower et al., 2010). The key step is to estimate the area per epoch as a function of flux density threshold. We can estimate this based on the image rms and the imaged area with a sensitivity above the threshold; this is the statistical limit given in Fig. 3. We plot here the inverse of the area, which is proportional to the surface density. This statistical method, however, ignores the effects of systematic errors caused by 3C 286 in the image. We use an alternative method of estimating the area available by counting the number of epochs in which the bright steady sources in the image are detected (Table 1). Under the assumption that this threshold is much higher than the statistical noise threshold (which holds in most cases), then the total area is the number of detections times the field of view imaged; this is labeled as systematic limit for 1 epoch. We can also use the requirement of consecutive detections of the steady sources to estimate the area for repeating sources; this is the systematic limit for 2 epoch detections. The inverse area rises steeply at flux densities below 70 mJy. For flux densities greater than 70 mJy, we find good agreement between the statistical and systematic approaches and little difference between the one and two epoch areas. The discrepancy between the statistical and systematic limits at low flux densities is the penalty that we pay for using data with a dynamic range limit.
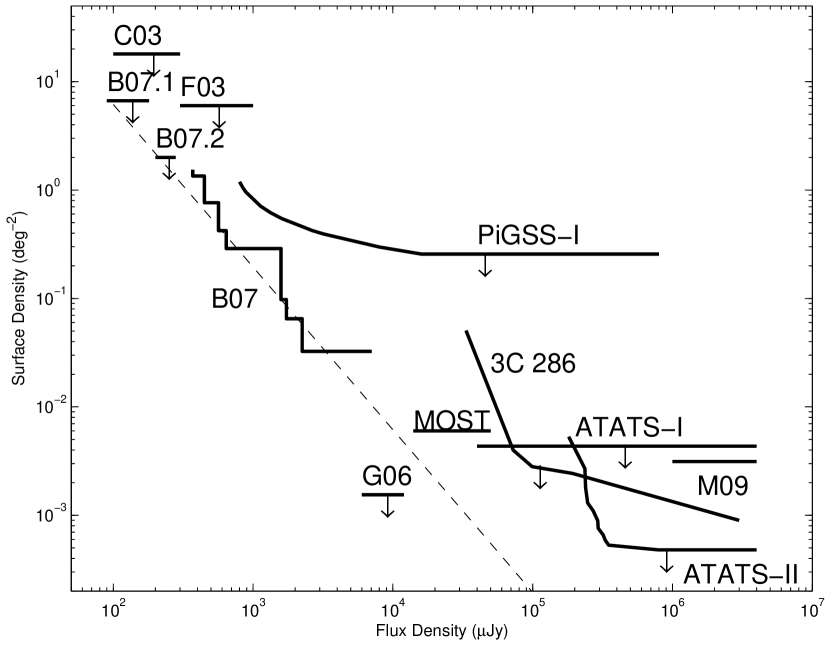
We estimate the upper limit on and plot it against other measurments and limits (Figure 4). We use the systematic two-epoch limit for flux densities mJy and then interpolate to the statistical limit for very large flux densities. The surface density above 200 mJy applies to transients with timescales minute. We find deg-2 at 70 mJy (for day) and deg-2 at 3 Jy (for min).
These limits are an improvement over limits on very bright RTs relative to the ATATS-I and MOST surveys (Croft et al., 2010b; Bannister et al., 2010) and are comparable to the limits from the NVSS-FIRST comparison (Gal-Yam et al., 2006). The ATATS-II results are a factor of more sensitive than the 3C 286 results at a flux density of 300 mJy (Croft et al., 2010a); however, the 3C 286 results are a factor of 4 times more sensitive in flux density. Our limits from 3C 286 observations are more sensitive than the published limits from Matsumura et al. (2009, M09), however, there is considerable uncertainty about what is the best limit based on the M09 data. Previous limits from the same group (Kida et al., 2008) also disagree with M09. We plot the stated M09 surface density from two years of surveying of arcmin deg-2. Our independent calculation based on data presented in the paper of 3 transients detected in 50 days of observing with an instantaneous field of view of 500 deg2 suggests a surface density of deg-2; using 9 transients from 2 years of observing we estimate deg-2. However, we cannot be certain that we know the duty cycle of this observing and so take the stated M09 limit of deg-2 as the benchmark value. For this value, we would expect to find 3 1-Jy RTs, which we do not find.
The surveys compared in this plot cover an order of magnitude in frequency (0.84 to 8.4 GHz) and several orders of magnitude in time scale that are probed (1 minute to 1 year). Thus, each survey takes a different slice of parameter space that may probe very different physics and source populations. Broadly, these observations are sensitive to synchrotron phenomena, such as the explosive ejecta of radio supernova and gamma-ray burst afterglows, as well as X-ray binaries and active galactic nuclei. Models for most of these source populations indicate surface densities that are to the left and below the dashed line in the plot (e.g., Rossi et al., 2008).
6 Summary
We have presented an analysis of 1852 epochs of VLA observations spanning 23 years of the bright calibrator 3C 286 at 1.4 GHz. This data set provides an important search for radio transients brighter than 70 mJy. We do not find any transients, in contradiction with optimistic estimates of transient surface density from M09 but consistent with limits from other surveys. Differences between surveys may be a function of observing frequency, regions of sky covered, and systematic problems in recovering transients.
The results are limited significantly by dynamic range of the imaging. If systematic errors had not contributed to the imaging, our surface density limit would apply at flux densities that are an order of magnitude lower. Nevertheless, the results demonstrates that searches around bright calibrators can provide unique information. Future searches of the VLA archives can improve on these results through the use of the larger number of observations of other standard calibrators such as 3C 48 and of observations at other frequencies. The examination of fainter calibrators is an important way to get closer to the statistical noise limits under the assumption of a fixed dynamic range limit. Finally, more complete models used in self-calibration may permit higher dynamic range imaging. If 1% of the data from the VLA archives consist of calibrators suitable for transient searching, we will have 2000 hours of usable data from the past 25 years, corresponding to an order of magnitude increase in sensitivity to radio transients.
References
- Bannister et al. (2010) Bannister, K., Murphy, T., Gaensler, B. M., Hunstead, R., & Chatterjee, S. 2010, ArXiv e-prints
- Becker et al. (2010) Becker, R. H., Helfand, D. J., White, R. L., & Proctor, D. D. 2010, AJ, 140, 157
- Bower et al. (2010) Bower, G. C., Croft, S., Keating, G., Whysong, D., Ackermann, R., Atkinson, S., Backer, D., Backus, P., Barott, B., Bauermeister, A., Blitz, L., Bock, D., Bradford, T., Cheng, C., Cork, C., Davis, M., DeBoer, D., Dexter, M., Dreher, J., Engargiola, G., Fields, E., Fleming, M., Forster, R. J., Gutierrez-Kraybill, C., Harp, G. R., Heiles, C., Helfer, T., Hull, C., Jordan, J., Jorgensen, S., Kilsdonk, T., Law, C., van Leeuwen, J., Lugten, J., MacMahon, D., McMahon, P., Milgrome, O., Pierson, T., Randall, K., Ross, J., Shostak, S., Siemion, A., Smolek, K., Tarter, J., Thornton, D., Urry, L., Vitouchkine, A., Wadefalk, N., Weinreb, S., Welch, J., Werthimer, D., Williams, P. K. G., & Wright, M. 2010, ApJ, 725, 1792
- Bower et al. (2007) Bower, G. C., Saul, D., Bloom, J. S., Bolatto, A., Filippenko, A. V., Foley, R. J., & Perley, D. 2007, ApJ, 666, 346
- Brunthaler et al. (2009) Brunthaler, A., Menten, K. M., Reid, M. J., Henkel, C., Bower, G. C., & Falcke, H. 2009, A&A, 499, L17
- Carilli et al. (2003) Carilli, C. L., Ivison, R. J., & Frail, D. A. 2003, ApJ, 590, 192
- Croft et al. (2010a) Croft, S., Bower, G., Keating, G., Law, C., Whysong, D., Williams, P., & Wright, M. 2010a, ApJ, submitted
- Croft et al. (2010b) Croft, S., Bower, G. C., Ackermann, R., Atkinson, S., Backer, D., Backus, P., Barott, W. C., Bauermeister, A., Blitz, L., Bock, D., Bradford, T., Cheng, C., Cork, C., Davis, M., DeBoer, D., Dexter, M., Dreher, J., Engargiola, G., Fields, E., Fleming, M., Forster, J. R., Gutierrez-Kraybill, C., Harp, G., Helfer, T., Hull, C., Jordan, J., Jorgensen, S., Keating, G., Kilsdonk, T., Law, C., van Leeuwen, J., Lugten, J., MacMahon, D., McMahon, P., Milgrome, O., Pierson, T., Randall, K., Ross, J., Shostak, S., Siemion, A., Smolek, K., Tarter, J., Thornton, D., Urry, L., Vitouchkine, A., Wadefalk, N., Welch, J., Werthimer, D., Whysong, D., Williams, P. K. G., & Wright, M. 2010b, ApJ, 719, 45
- Frail et al. (2003) Frail, D. A., Kulkarni, S. R., Berger, E., & Wieringa, M. H. 2003, AJ, 125, 2299
- Gal-Yam et al. (2006) Gal-Yam, A., Ofek, E. O., Poznanski, D., Levinson, A., Waxman, E., Frail, D. A., Soderberg, A. M., Nakar, E., Li, W., & Filippenko, A. V. 2006, ApJ, 639, 331
- Hessels et al. (2009) Hessels, J. W. T., Stappers, B. W., van Leeuwen, J., & The LOFAR. 2009, in Astronomical Society of the Pacific Conference Series, Vol. 407, Astronomical Society of the Pacific Conference Series, ed. D. J. Saikia, D. A. Green, Y. Gupta, & T. Venturi, 318–+
- Kida et al. (2008) Kida, S., Niinuma, K., Suzuki, S., Tanaka, T., Nakanura, R., Takefuji, K., Matsumura, N., Kuniyoshi, M., & Daishido, T. 2008, New A, 13, 519
- Lazio et al. (2010) Lazio, T. J. W., Clarke, T. E., Lane, W. M., Gross, C., Kassim, N. E., Ray, P. S., Wood, D., York, J. A., Kerkhoff, A., Hicks, B., Polisensky, E., Stewart, K., Paravastu Dalal, N., Cohen, A. S., & Erickson, W. C. 2010, AJ, 140, 1995
- Levinson et al. (2002) Levinson, A., Ofek, E. O., Waxman, E., & Gal-Yam, A. 2002, ApJ, 576, 923
- Macquart et al. (2010) Macquart, J., Bailes, M., Bhat, N. D. R., Bower, G. C., Bunton, J. D., Chatterjee, S., Colegate, T., Cordes, J. M., D’Addario, L., Deller, A., Dodson, R., Fender, R., Haines, K., Halll, P., Harris, C., Hotan, A., Jonston, S., Jones, D. L., Keith, M., Koay, J. Y., Lazio, T. J. W., Majid, W., Murphy, T., Navarro, R., Phillips, C., Quinn, P., Preston, R. A., Stansby, B., Stairs, I., Stappers, B., Staveley-Smith, L., Tingay, S., Thompson, D., van Straten, W., Wagstaff, K., Warren, M., Wayth, R., Wen, L., & CRAFT Collaboration. 2010, PASA, 27, 272
- Matsumura et al. (2009) Matsumura, N., Niinuma, K., Kuniyoshi, M., Takefuji, K., Asuma, K., Daishido, T., Kida, S., Tanaka, T., Aoki, T., Ishikawa, S., Hirano, K., & Nakagawa, S. 2009, AJ, 138, 787
- Ofek et al. (2010) Ofek, E. O., Breslauer, B., Gal-Yam, A., Frail, D., Kasliwal, M. M., Kulkarni, S. R., & Waxman, E. 2010, ApJ, 711, 517
- Rossi et al. (2008) Rossi, E. M., Perna, R., & Daigne, F. 2008, MNRAS, 390, 675
| RA | Dec. | Mean Flux | Modulation | |
|---|---|---|---|---|
| (J2000) | (J2000) | (mJy) | (mJy) | |
| 13:32:04.7 | 30:21:15.4 | 4 | … | 0 |
| 13:31:48.7 | 30:24:29.7 | 99 | 13 | 1587 |
| 13:31:48.4 | 30:31:47.5 | 193 | 23 | 1720 |
| 13:31:46.6 | 30:37:46.6 | 33 | 6 | 309 |
| 13:31:20.3 | 30:20:41.9 | 15 | … | 0 |
| 13:31:18.5 | 30:39:52.2 | 25 | 7 | 30 |
| 13:31:18.3 | 30:38:36.0 | 8 | … | 0 |
| 13:31:08.3 | 30:30:32.9 | 15488 | … | … |
| 13:30:53.6 | 30:38:01.0 | 73 | 16 | 1320 |
| 13:30:50.1 | 30:27:30.8 | 3 | … | 0 |