Five E+A (post-starburst) galaxies as Brightest Cluster Galaxies
Abstract
Brightest Cluster Galaxies (BCGs) are mostly elliptical galaxies and very rarely have prominent star formation. We found that five out of 8,812 BCGs are E+A (i.e. post-starburst) galaxies, having the H absorption line with an equivalent width and no distinct emission lines in [O II] and H . The E+A features we identified from the BCGs for the first time are not as significant as those in general galaxies, indicating that historically the star formation were not very violent.
E+A galaxies have strong Balmer absorption lines in their spectra but no distinct emission lines of [O II] at 3727 and H . They look like a superposition of spectra of elliptical galaxies and A-type stars (E+A). The strong Balmer absorption lines indicate that these galaxies experienced a powerful star formation within 1 Gyr, but no star formation is going on since non-detection of [O II] emission line (e.g., Couch & Sharples 1987; Poggianti et al. 1999). Therefore, E+A galaxies have been interpreted as post-starburst galaxies, which is an important stage of overall galaxy evolution in the Universe.
E+A galaxies (also called as K+A galaxies) were first discovered in distant clusters of galaxies (e.g., Dressler & Gunn 1983). E+A galaxies now have been found in various environments, very often in cluster regions of redshifts (e.g., Dressler et al. 1999; Tran et al. 2003). Low redshift E+A galaxies are found predominantly in the field environment (e.g., Blake et al. 2004; Quintero et al. 2004). Most of E+A galaxies are spiral galaxies but some are elliptical galaxies (e.g., Goto et al. 2003; Huang & Gu 2009). Less than 1% of all galaxies in the present Universe are E+A galaxies (Goto et al. 2003). E+A galaxies may provide hints for evolution of early-type galaxies.
The Brightest Cluster Galaxies (BCGs) are the most luminous and massive galaxies in the center of galaxy clusters. They are mostly elliptical galaxies and dominated by old stars without prominent ongoing star formation. However, they are different from ordinary elliptical galaxies (non-BCGs) in the surface brightness profiles and some basic scaling relations (see Liu et al. 2008 for a short review). Because of the dominant role inside clusters and their unusual properties, the formation and evolution of BCGs are very intriguing.
Very rarely BCGs show signatures of ongoing star formation (e.g., Crawford et al. 1999; O’Dea et al. 2008). When the star formation in these BCGs is quenched, they may evolve into the E+A stage. There have been no reports previously about E+A BCGs, probably due to their rarity.
We searched for the signatures of E+A galaxies from the BCGs of SDSS-WHL clusters (Wen et al. 2009). Wen et al. (2009) have identified 39,668 clusters in the redshift range , To find the E+A spectral features, we checked the BCGs which have spectroscopic observations and their spectra have been parametrized by the MPA/JHU team111http://www.mpa-garching.mpg.de/SDSS/DR7/. Among 16,276 BCGs with spectroscopic spectra, we only looked at 12,186 BCGs in the redshift range of because the H line otherwise goes outside the wavelength coverage of 3800-9200Å for SDSS spectroscopy. We further discarded the spectra with a median signal-to-noise (S/N) per pixel less than 5, and got only spectra of 8,812 BCGs.
Previously E+A galaxies are found solely based on the [O II] line at and H absorption line. Different criteria were used in literature. The H equivalent width (EW) is usually set to be, e.g., Å by Poggianti et al. (2004), 5Å by Goto (2007) and Falkenberg et al. (2009) and 2.5Å by Huang & Gu (2009). Note that the value for absorption lines here has a positive sign, and that for emission lines will set to have a negative sign. The [O II] EW is adopted to Å by Tran et al. (2003) and -2.5Å by Goto (2007). Goto et al. (2003) showed such E+A galaxies without information of H line suffer from a large fraction (52%) of contamination from H emitting galaxies. Other Balmer absorption lines (H and H ) were also considered for high-redshift E+A galaxies when the H line is not available (e.g., Tran et al. 2003; Blake et al. 2004; Yang et al. 2004).
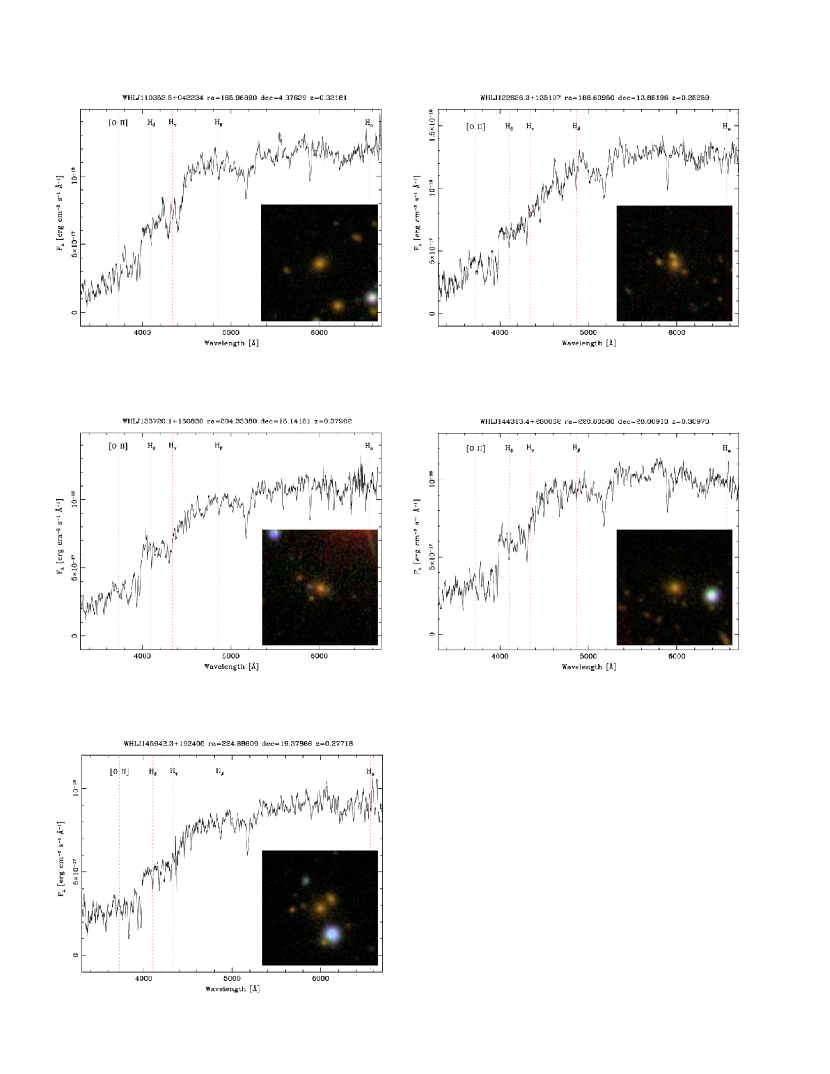
We follow the criteria of Huang & Gu (2009) to select E+A BCGs: the , and . We also request the measured values of H EW and flux are better than (i.e. 3 times of uncertainties). These criteria are reliable for selection for E+A galaxies, because the inclusion of H EW can exclude the contamination from H emitting galaxies efficiently. We also exclude the BCGs at from our analysis because the sky feature at 5577Å may affect the measurement of H line (with the window of 4092 - 4111Å in MPA/JHU). Finally, among 8,812 BCGs, five are E+A BCGs with the H equivalent width 2.5Å , [O II] equivalent width Å and H equivalent width Å. Their spectra are shown in Figure 1, and basic parameters are listed in Table 1. We checked the images of these E+A BCGs and clusters carefully, and noticed that all E+A BCGs are definitely the brightest galaxies in clusters and are located at the density peak of member galaxy in space with a small difference between their photometric redshift and spectroscopic redshift ( 0.02).
Note that the SDSS fiber spectrograph only samples the light within the central 3” of galaxies (Strauss et al. 2002). A large aperture bias for selection of nearby E+A galaxies can be avoided by a low redshift cut of (Goto 2007). The star formation activity in BCGs tends to happen in the central region (e.g., Bildfell et al. 2008; Pipino et al. 2009). Probably it holds true for the post-starburst E+A galaxies as well. Our E+A galaxies as BCGs have a weaker H absorption line. Such galaxies could be roughly classified as weak E+A galaxies by Poggianti et al. (2004), which historically had much less violent star formation than general E+A galaxies in the field.
E+A (post-starburst) galaxies are really very rare among BCGs. Only five of 8,812 BCGs show the significant E+A features. This is expected, since the BCGs are the dynamically oldest objects of the clusters, whereas the E+A galaxies experienced starburst within about 1 Gyr.
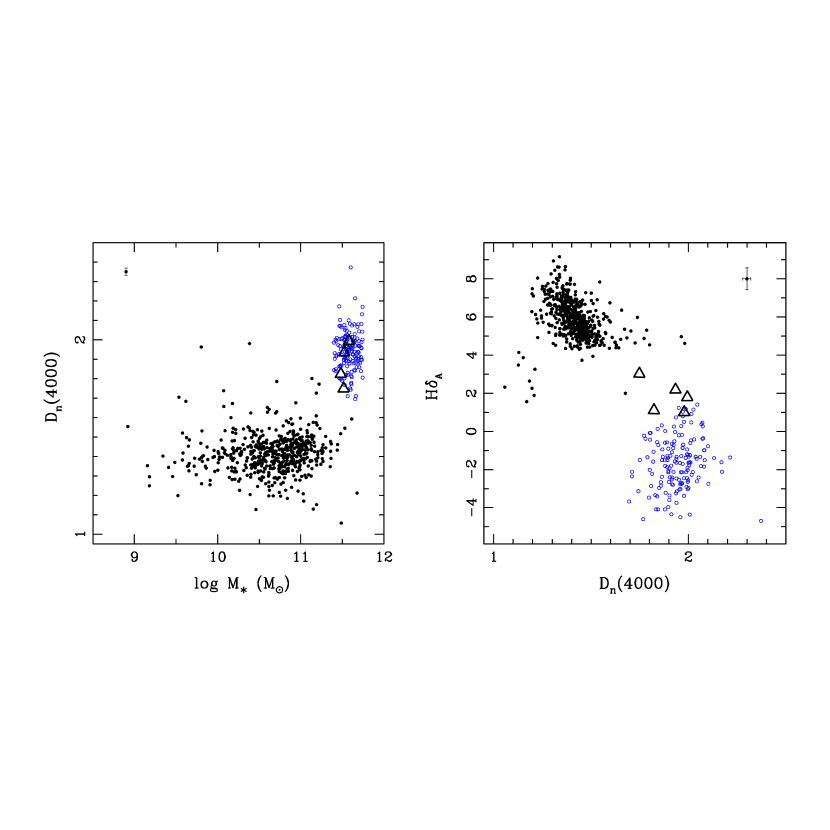
We compared the physical properties of these E+A BCGs with those of two control samples. One is the catalog of 564 general E+A galaxies found mostly in the field by Goto (2007), and the other includes 154 quiescent BCGs with definitely no star formation (i.e. [O II] EW0Å and H EW0Å) but with a similar stellar mass of these E+A BCGs () in the redshift of 0.25z0.37. We collected the 4000Å break strength, , the Balmer line absorption index (Worthey et al. 1997), , and the total stellar mass (log) of the objects in control samples from the MPA/JHU catalogs. Not all objects have these parameters estimated already there: 543 out of 564 general E+A galaxies of Goto (2007) have all these parameters on line, and four of five E+A BCGs have total stellar mass estimated. We compared the , stellar mass and the line absorption index, , of E+A BCGs with those of two control samples (Figure 2). E+A BCGs have distinct different locations in those parameter space from the field E+A galaxies. They are usually more massive, and have larger and smaller absorption line index , which indicates their different star formation history. The star formation in the field E+A galaxies may be triggered by interaction of gas-rich galaxies (e.g., Goto 2005), while star formation in BCGs is related to cluster cooling flows (e.g., Fabian 1994).
E+A BCGs have almost the same distribution as quiescent BCGs. However, E+A BCGs have slightly larger than quiescent BCGs with similar stellar masses, which indicates that the mean stellar ages in E+A BCGs may be less than those in normal BCGs. They obviously experienced recent star formation. E+A galaxies represent an important stage of overall galaxy evolution. Detailed studies of these E+A BCGs and their environment may help to understand why some BCGs had the starburst and why the starburst was quenched later.
References
- (1) Bildfell, Chris, Hoekstra, Henk, Babul, Arif, et al. 2008, MNRAS, 389, 1637
- (2) Blake, Chris, Pracy, Michael B., Couch, Warrick J., et al. 2004, MNRAS, 355, 713
- (3) Couch, Warrick J., Sharples, R. M. 1987, MNRAS, 229,423
- (4) Crawford, C. S., Allen, S. W., Ebeling, H., et al. 1999, MNRAS, 306, 857
- (5) Dressler, A., Gunn, J. E. 1983, ApJ, 270, 7
- (6) Dressler, Alan, Smail, Ian, Poggianti, Bianca M., et al 1999, ApJS, 122, 51
- (7) Fabian A. C. 1994, ARA&A, 32, 277
- (8) Falkenberg, M. A., Kotulla, R., Fritze, U. 2009, MNRAS, 397, 1940
- (9) Goto, Tomotsugu 2005, MNRAS, 357, 937
- (10) Goto, Tomotsugu 2007, MNRAS, 381, 187
- (11) Goto, Tomotsugu, Nichol, Robert C., Okamura, Sadanori, et al. 2003, PASJ, 55, 771
- (12) Huang, Song, Gu, Q.-S. 2009, MNRAS, 398, 1651
- (13) Liu, F. S., Xia, X. Y., Mao, Shude, et al. 2008, MNRAS, 385, 23
- (14) O’Dea, Christopher P., Baum, Stefi A., Privon, George, et al. 2008, ApJ, 681, 1035
- (15) Pipino, A., Kaviraj, S., Bildfell, C., et al. 2009, MNRAS, 395, 462
- (16) Poggianti, Bianca M., Bridges, Terry J., Komiyama, Y., et al. 2004, ApJ, 601, 197
- (17) Poggianti, Bianca M., Smail, Ian, Dressler, Alan, et al 1999, ApJ, 518, 576
- (18) Quintero, Alejandro D., Hogg, David W., Blanton, Michael R., et al. 2004, ApJ, 602, 190
- (19) Strauss, Michael A., Weinberg, David H., Lupton, Robert H., et al. 2002, AJ, 124, 1810
- (20) Tran, Kim-Vy H., Franx, Marijn, Illingworth, Garth, et al. 2003, 599, 865
- (21) Wen, Z. L., Han, J. L., Liu, F. S. 2009, ApJS, 183, 197
- (22) Worthey, Guy, Ottaviani, D. L. 1997, ApJS, 111, 377
- (23) Yang, Yujin, Zabludoff, Ann I., Zaritsky, Dennis, et al. 2004, ApJ, 607, 258
| Cluster Name | BCG: R.A. | BCG: Dec. | BCG: z | log | (4000) | |||||
|---|---|---|---|---|---|---|---|---|---|---|
| (1) | (2) | (3) | (4) | (5) | (6) | (7) | (8) | (9) | (10) | (11) |
| WHLJ110352.5042234 | 165.96890 | 4.37639 | 0.3218 | 6.51 | 3.920.84 | 4.392.04 | -2.970.64 | 11.52 | 1.930.09 | 2.191.99 |
| WHLJ122626.3135107 | 186.60950 | 13.85196 | 0.2526 | 5.19 | 3.301.09 | 0.452.22 | -0.560.58 | 11.48 | 1.820.10 | 1.102.68 |
| WHLJ133720.1160830 | 204.33380 | 16.14181 | 0.3790 | 5.47 | 2.570.76 | -1.261.33 | -0.390.83 | … | 1.980.07 | 1.001.86 |
| WHLJ144313.4280032 | 220.80580 | 28.00913 | 0.3097 | 5.38 | 2.950.87 | -0.921.71 | -0.870.73 | 11.58 | 1.990.08 | 1.792.14 |
| WHLJ145942.3192405 | 224.88609 | 19.37866 | 0.2772 | 5.30 | 2.820.91 | -2.122.01 | -1.000.73 | 11.52 | 1.750.08 | 3.022.28 |
Note: Col:(1) SDSS-WHL Cluster Name. Col:(2) BCG R.A.(J2000.0) in unit of degree. Col:(3) BCG Dec.(J2000.0) in unit of degree. Col:(4) The spectroscopic redshift of the BCG. Col:(5) The signal-to-noise (S/N) of the whole spectrum. Col:(6) The equivalent width of in unit of . Col:(7) The equivalent width of 3727, in unit of . Col:(8) The equivalent width of in unit of . Col:(9) Logarithm of total stellar mass, in unit of . Col:(10) The amplitude of the 4000 Balmer break, (4000). Col:(11) The absorption line index .