Investigation of Properties of the Intercluster Medium
Rich Clusters of Galaxies
I. K. Rozgachevaa, I. B. Kuvshinovab
Moscow State Pedagogical University, Russia
e-mail: arozgacheva@yandex.ru, bkib139@mail.ru
The statistical analysis of properties of 213 rich clusters of galaxies is performed. The existence of correlations between the X-ray luminosity and the temperature of the intracluster medium and between the X-ray luminosity and the velocity dispersion of the galaxies is confirmed. New anti-correlation between optical luminosities and x-ray luminosities of intracluster gas in clusters is discovered: . The existence of sequences in the plane testifies to that the masses of the intracluster gas in different clusters can differ significantly.
KEYWORDS: rich clusters of galaxies, X-ray luminosity of the intracluster medium, statistical analysis
1. Introduction
Systematic studies of clusters of galaxies became possible only in the last third of the 20th century through progress in space-based astronomy. Satellite-based detectors have made it possible to observe galaxy clusters from the infrared to X-rays. Clusters were found to be extended sources of X-ray emission, whose spectrum corresponds to thermal bremsstrahlung from a hydrogen-rich plasma. Estimated temperatures from X-ray spectroscopy are in the range , while the number densities vary from at the periphery to in central regions of the cluster.
The characteristic timescale for the establishment of virial equilibrium is , which does not exceed for ordinary rich clusters (radius and total visible mass ). This is less than the Hubble time (age of the Universe), and rich clusters (containing thousands of galaxies) may already have entered a stationary state. The values of the potential and kinetic energies determined from the observed spatial and velocity distributions of the galaxies can therefore be assumed to be close to their average values. It is natural to expect the virial theorem to be valid for rich, massive clusters, which are nearly spherically symmetrical. However, current observational data indicate that the virial theorem is not satisfied, even when the luminous intracluster medium (ICM) is taken into account. Hence, the existence of dark matter is invoked, whose mass provides fulfillment of the virial theorem. One of the remaining problems in the physics of cluster is that, after more than 30 years of observational studies, the physics of the dark matter in galaxy clusters remains unclear.
Another problem in cluster physics is connected with the observed surface brightness of the diffuse X-ray radiation. In many clusters, the surface brightness is hundreds or thousands of times brighter in inner than in outer regions. This effect is noted for most rich clusters, though there are also examples of clusters without sharp central rises in X-ray brightness, such as Coma. The growth in the brightness towards the inner parts of a cluster was predicted in K. Griest [1], based on the idea that the plasma densities are most likely higher in central regions due to the tendency of the gas to fall into the cluster’s gravitational potential well. Since the volume emissivity of bremsstrahlung goes as , the central regions where the density is higher should be brighter.
The first free-free cooling time estimates without heating or convective motions were made in [2, 3]. This time proved to be shorter than the ages of rich clusters (of order the Hubble time). In this case, it remains unclear why most rich clusters contain hot gas, seen through its diffuse X-ray emission, and why this emission peaks strongly towards the center. A simple answer to the first part of this question is that we observe only clusters that are brightest in X-rays. These clusters may be younger, so that the X-ray gas has not yet cooled, while X-ray faint clusters are older and contain much less X-ray gas.
To explain the central peak of the X-ray intensity, Soliger and Tucker [2] and Fabian and Nulsen [3] proposed that the ICM flowed toward the center of the cluster. Initially cold gas falls into the potential well, and its gravitational energy is transformed into thermal energy. The gas is heated to high temperatures, becomes ionized, and begins radiating in the X-ray. The central regions become much more luminous due to the density increase in the cluster core. Because the plasma loses its thermal energy, these flows were called “cooling flows” (CFs) by Fabian. CFs are closely related to filaments—elongated optical structures that can be traced in X-ray images [4] and are also detected in infrared line emission of molecular hydrogen [5]. CFs have been proposed as the mechanism maintaining the X-ray emission of the central regions of clusters. This should lead to the accumulation of cool gas with in the cluster cores. The rate of cool-gas accumulation should be of order /year, depending on the observed brightness contrast. During the lifetime of a cluster, the total accreted mass should be of order . However, there is no evidence for considerable amounts of cool gas in rich galaxy clusters with strongly inhomogeneous X-ray brightness. It is also not clear why the X-ray surface brightness does not increase sharply toward the center in all clusters. A small amount of cool gas with is observed in cluster cores in the UV (), soft X-ray (), and optical line [6, 7]. It is possible that improvements in infrared techniques will enable the detection of additional cool gas, resolving the problem of dark matter in galaxy clusters [8].
Various secondary ICM heating mechanisms have been considered in the CF model, such as the birth and death of massive stars, activity of galactic nuclei, and processes associated with galaxy mergers [9]. The main difficulty of these models is that they contain a large number of free parameters due to unknown details of the physics of both star formation and active processes in galaxies. Observations show that active ICM-heating mechanisms act for a limited time, less than years, after which plasma cooling is inevitable. This sporadic heating can not explain the existing amounts of hot gas in rich clusters. Efficient secondary heating of the gas at the cluster center requires that active energy-release processes occur tens of times more often than is observed [10]. If the activity in the central regions of clusters was higher in the past, it would result in current elemental abundances that differed from the observed values [11]. Finally, violent heating processes should lead to intense mixing of the ICM, giving rise to strong inhomogeneity in the X-ray surface brightnesses of clusters, again in contradiction with observational data [12].
For about 30 years, the existence of hot gas in clusters of galaxies has been considered evidence for large amounts of dark matter in clusters. It is generally assumed that every cluster contains isothermal gas in a state close to hydrostatic equilibrium, determined by the total mass of the cluster. If the internal energy of the very hot gas with temperatures exceeding is determined only by its gravitational interactions with the cluster gravitational field (gravitational heating), its total mass should be proportional to the temperature of the gas and should exceed the total mass of the cluster galaxies by a factor of 10–100 [13]. The mass of gas estimated from its luminosity does not exceed 15% of the total mass of the galaxy cluster for known clusters. This mass estimate does not take into account the hypothesis that CFs should exist in all the clusters with X-ray bright cores. These CFs produce up to 70% of the total X-ray luminosity due to the higher ICM density in them. The density required to provide the observed central X-ray brightness increase is higher than for isothermal plasma with the same temperature in hydrostatic equilibrium [14]. Therefore, either the gas is not isothermal or the CFs are far from hydrostatic equilibrium. Hot gas and CFs are therefore not directly connected to gravitational heating, and virial estimates for the total mass are probably overestimated.
ICM heating mechanisms and the formation of CFs remain unresolved problems of the physics of rich galaxy clusters. Solving this problem is important for our understanding of the cluster dynamics and requires multi-faceted studies of the radiation of the intergalactic plasma. The current study is devoted to this task.
For this, we created an astrophysical catalog of rich clusters of galaxies [15] containing the equatorial coordinates, mean redshifts, apparent and absolute magnitudes, galaxy velocity dispersions, estimated X-ray and optical luminosities of the ICM, gas temperatures determined from the X-ray spectral shape, and information on known filaments and CFs.
The second section discusses relations between the physical parameters of the clusters that were discovered during our statistical analysis of the catalog [15].
2. Data analysis
We made a sample of a relatively close rich clusters of galaxies with from the catalog of Abell [16], so that we could neglect possible evolutionary effects [17]. In [15], we present an astrophysical catalog of these clusters containing all available information on these objects taken from the VizieR, NED, BAX, ADS NASA, and INSPEC-A databases, as well as the XMM-Newton, Rosat, and Chandra archives, the VINITI database, and original publications. The catalog reference list contains 180 entries. The catalog itself contains 213 clusters.
The largest problem with the catalog proved to be the inhomogeneity of the X-ray and optical data from different sources. The X-ray temperatures for some clusters derived from data for different satellites differ by factors of a few. This may be related to real processes of violent energy release in the ICM, or to relatively low quality of the X-ray data due to insufficient spectral resolution. Further observations with existing and other missions will make it possible to improve these measurements and refine the catalog. The same is true of the optical data. Since the optical spectra of galaxies in nearby and distant clusters differ in quality, their radial velocities are measured with different accuracies. Optical radiation from the ICM is not detected from all the clusters. Estimates of the optical luminosities of the ICM contain uncertainty associated with distinguishing the radiation of the cluster galaxies and the ICM itself. Our catalog [15] contains the luminosities of the ICM, , presented in the original observational studies. If the contribution of the ICM is not separated out, the total cluster luminosity is given as an upper boundary for the ICM luminosity. The published version of the catalog includes sources of X-ray and optical data used most often in articles on the ICM in galaxy clusters (this required additional searches for information in the references).
Our statistical analysis was aimed at searching for correlations between physical characteristics of the ICM, such as the optical and X-ray () luminosities, X-ray temperature , and galaxy velocity dispersion .
3. Correlation
Figure 1 shows the correlation between the X-ray luminosity and temperature of the ICM. The best-fit linear relation between their logarithms is ( is the luminosity of the Sun):
| (1) |
with a correlation coefficient of , which is significantly higher than the critical value of the Pearson correlation coefficient (for a random correlation), [18].
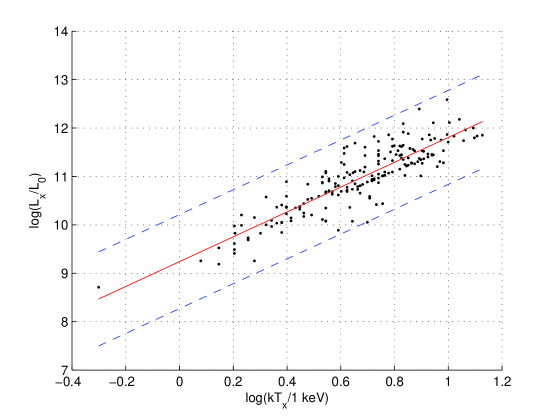
This indicates a strong statistical correlation between the X-ray luminosity and temperature. The scatter about the best-fit line has the dispersion . This exceeds the mean observational errors in , which is , and in , which is . Correlation (1) confirms the relation between and reported in earlier studies, summarized in Table 1. The differences in the power-law indices for the temperature are due to the use of (1) different sample sizes and earlier X-ray data and (2) different clusters, including clusters with a large range of redshifts.
| Number of clusters | Correlation equation | References |
|---|---|---|
| 24 | [19] | |
| 30 | [14] | |
| 30 | [20] | |
| 45 | [21] | |
| 78 | [22] | |
| 86 | [23] | |
| 104 | [24] | |
| 168 | [25] | |
| 198 | This work |
Physically, at least four different power-law dependences of the form are possible between the luminosity and temperature of the plasma. The luminosity of optically thin plasma radiating free-free emission is [26]
where is the temperature of the gas and the integration is performed over the entire (spherically symmetric) emitting volume. The equation of state of the emitting plasma should be described using the polytropic equation . For uniform, completely ionized hydrogen plasma, , , and .
If all the clusters had identical properties, and all the observed differences were due purely to the fact that we are observing clusters at different cosmological epochs with different z, the relation would hold for hydrogen plasma with . This follows from simple arguments. In a Friedmann cosmological model, the plasma density varies as . For a polytropic equation of state, the temperature then varies as . We obtain for the luminosity of a volume of uniform, isothermal plasma .
Finally, if the plasma is in hydrodynamical equilibrium in a volume , its gravitational energy is to order of magnitude , where is the total mass of plasma, is the total mass of galaxies, for rich clusters, is the mass of dark matter, and is the characteristic size of the cluster. This gravitational energy is comparable to the kinetic energy of the plasma, which is comprised of its thermal energy and the kinetic energy of plasma flows , where is the flow velocity. We obtain for a fixed cluster volume . The luminosity and temperature are then related as . If the kinetic energy of the plasma flows is small compared to the thermal energy, .
If the dynamics and heating of ICM are determined by dark matter, the ICM temperature is proportional to the mass of dark matter inside the cluster volume, . The ICM luminosity is then for the polytropic equation of state .
The exponent is therefore somewhere between 2 and 3.5. Since our sample contains nearby, rich clusters, evolutionary and cosmological effects are weak. The estimated value of provides evidence for hydrodynamical equilibrium of the gas of the clusters in the sample. In this state, plasma heating is determined not only by gravitational energy release, but also by additional sources of heating that lead to large-scale mixing of the plasma.
In [27], correlations between the X-ray temperatures and luminosities of the ICM in rich clusters are used to estimate the masses of galaxies in the cluster cores.
4. Correlation
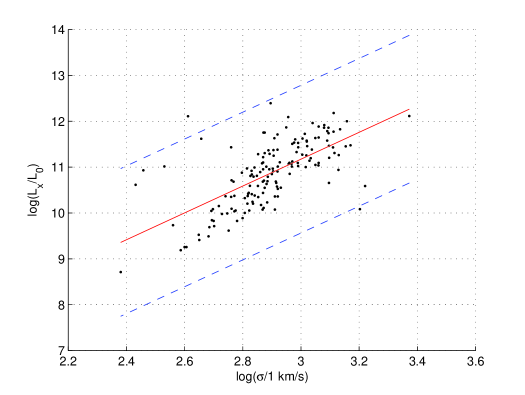
Figure 2 shows the correlation between the X-ray luminosity of the ICM and the velocity dispersion of the cluster galaxies . The correlation coefficient for the best-fit linear regression equation,
| (2) |
is . Since this is significantly higher than the critical Pearson correlation coefficient of , we conclude that the X-ray luminosity of the ICM and the galaxy velocity dispersion are significantly correlated. The scatter about the regression line (2) has the dispersion ; this exceeds the mean observational uncertainty for , which is . This is due to insufficiently high quality of the galaxy spectra.
The correlation (2) is consistent with relations between and found in earlier studies. The results of these studies are given in Table 2. The discrepancy in the exponents is due to differences in sample sizes, the use of earlier X-ray data in previous studies, and the larger redshift range considered in [23].
Physically, the total kinetic energy of the galaxies is proportional to the gravitational potential energy associated with the galaxies, the ICM, and dark matter. Therefore, in the simplest, spherically symmetrical case, the velocity dispersion is to order of magnitude . At the same time, ICM X-ray luminosity scales as:
| (3) |
Combined with the relation , this expression may be used to relate the ICM temperature to the velocity dispersion of galaxies: .
| Number of clusters | Best-fit relation | Data source |
|---|---|---|
| 23 | [28] | |
| 50 | [23] | |
| 51 | [29] | |
| 156 | [25] | |
| 156 | This study |
If the only source of heating is gravitational interaction with galaxies (and dark matter), , and, in accordance with (3), the luminosity goes as .
If the dynamics of the galaxies and the ICM and heating of the ICM are completely determined by their gravitational interactions with dark matter, , , and . In this case, the ICM luminosity is for a polytropic equation of state for the plasma.
Relation (2) does not match any of the cases. Either observational biases strongly distort the real dependence between the ICM luminosity and the galaxy velocity dispersion, or the coefficient in (3) is large (the ICM mass is very low compared to the total mass of galaxies), weakening the correlation between the luminosity of the ICM and the velocity dispersion of the galaxies. It is also possible that the heating of the ICM is not determined purely by interactions with galaxies and dark matter, making its temperature couple only weakly with .
The correlations (1) and (2) we have found imply . This relation must still be checked, due to the insufficient quality of the temperature and galactic-velocity measurements. This is clearly shown by the correlation in Figure 3.
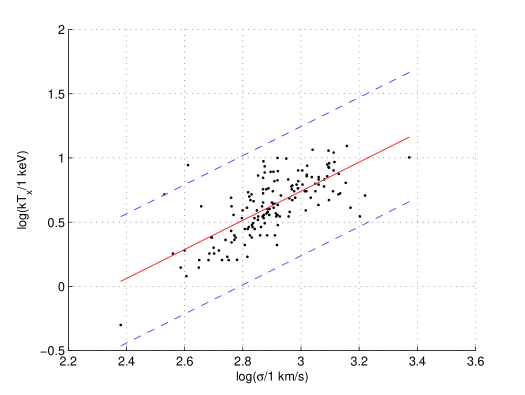
The correlation coefficient for the best-fit linear regression equation,
| (4) |
is , which is higher that the critical Pearson value of . Relation (4) yields , which is close to the dependence for the case of gravitational heating of the ICM. However, this relation contradicts the dependence implied by (1) and (2).
5. Relation
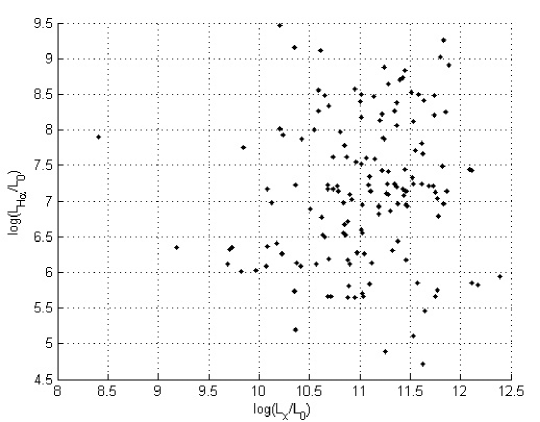
Our detection of a statistical relation between the optical and X-ray luminosities of the ICM was aided by the fact that we had already constructed a physical model for non-gravitational heating of the ICM [30]. This model predicts an anti-correlation between the optical and X-ray luminosities; i.e., the higher the X-ray luminosity, the lower the optical luminosity. We used the luminosity as an estimate of the optical luminosity.
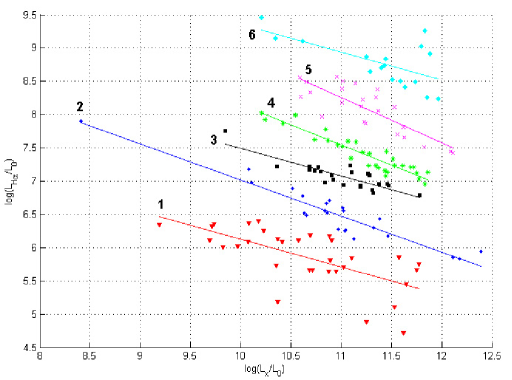
Figure 4 shows the distribution of points (clusters) in the (, ) plane. A statistical analysis shows no significant correlation between and . Therefore we selected groups of points for which the correlation coefficients exceeded the critical Pearson value. This yielded several sequences of objects. Among them, only sequences with negative correlation coefficients were found to be statistically significant, whereas all positive correlation coefficients were found to be less than the critical Pearson value. The anti-correlation sequences are shown in Figure 5. Table 3 presents regression equations for these sequences (second column), together with the number of objects in each sequence (third column), the anti-correlation coefficients (fourth column), and the values of the critical Pearson correlation coefficients (fifth column). The sixth column indicates whether filaments were () or were not () detected in the cluster images.
In Figure 5, the Coma cluster is close to sequence No. 1. No X-ray brightening towards the center of the cluster has been observed, although spatial variations of the X-ray brightness have been found around several groups of galaxies [31]. Although the Virgo cluster is not considered a rich cluster, we show it in Figure 5 (also close to sequence No. 1) because it includes our Galaxy. Extended filamentary structures have been detected in this cluster, which are related to the activity of the nucleus of M87 [32].
| No. | Regression equation | fila- | |||
|---|---|---|---|---|---|
| ments | |||||
| 1 | 32 | 0.66 | 0.35 | ||
| 2 | 23 | 0.95 | 0.41 | ||
| 3 | 23 | 0.86 | 0.41 | ||
| 4 | 30 | 0.93 | 0.36 | ||
| 5 | 24 | 0.82 | 0.40 | ||
| 6 | 17 | 0.63 | 0.48 |
The detected anti-correlation between the X-ray and optical luminosities of the ICM testifies that the ICM is not an isothermal system, and contains two components: cool () and hot (). These components are probably poorly mixed, since the cool component has been detected in many clusters. If the temperatures of these components were efficiently equalized, we would observe a positive correlation between the optical and X-ray luminosities of the ICM.
Figure 5 and Table 3 show that presence of filaments in cluster images for sequences 4, 5, and 6 is associated with an increase in the optical luminosity of the ICM, i.e., an increase in the amount of cooled gas glowing in the optical. The appearance of filaments in dense gas is due to flows of gas, which may be associated with active processes in galactic nuclei or mixing of the ICM due to non-gravitational heating.
6. Conclusion
The presented results of statistical analysis of the observational data of the catalog [15] provide evidence that the high temperature of the ICM is due to non-gravitational heating.
Clusters of galaxies have diverse properties. The existence of sequences in the plane testifies that the masses of the ICM in different clusters can differ significantly. This is apparently connected to the evolution of galaxies in clusters. In strongly evolved clusters, most of the ICM has already gone into star formation, and the total mass, density, and optical luminosity of the ICM are low. These clusters correspond to our sequences 1, 2, and 3, while younger clusters correspond to sequences 4, 5, and 6.
References
- [1] K. Griest, Ann. N. Y. Acad. Sci, 1993, 688, 390.
- [2] A. Soliger & W. H. Tucker, ApJ, 1972, 175, L107.
- [3] A. C. Fabian & P. E. J. Nulsen, MNRAS, 1977, 180, 479.
- [4] A. C. Fabian, W. Y.-M. Ku, D. F. Malin et al., MNRAS, 1981, 196, 35.
- [5] R. Johnstone, N. Hatch, G. J. Ferland et al., MNRAS, 2008, 382, 1246.
- [6] J. R. Peterson, F. B. S. Paerels, J. S. Kaastra, M. Arnaud et al., A&A, 2001, 365, L104.
- [7] H. Bohringer, K. Matsushita, E. Churazov et al., A&A, 2002, 382, 804.
- [8] G. F. Ferland, A. C. Fabian, N. A. Hatch et al., arXiv: astro-ph/0802.2535.
- [9] S. Pistinner & G. Shaviv, ApJ, 1995, 446, L11.
- [10] W. G. Mathews & F. Brighenti, ApJ, 2003, 596, 159.
- [11] A. Reisenegger, J. Miralda-Escudi, and F. Waxman, ApJ, 1996, 457, L11.
- [12] T. Furusho, N. Y. Yamasaki, and T. Ohashi, ApJ, 2003, 596, 181.
- [13] A. Cavaliere & R. Fusco-Fermiano, A&A, 1976, 49, 137.
- [14] S. W. Allen & A. C. Fabian, MNRAS, 1998, 297, L57.
- [15] I. B. Kuvshinova, VizieR, 2010, http//vizier.u-strasbrg.fr/viz-bin/VizieR.
- [16] G. O. Abell, H. G. Corwin, and R. P. Olowin, ApJ, 1989, 70, 1.
- [17] M. Branchesi, I. M. Gioia, C. Fanti, and R. Fanti, A&A, 2007, 472, 379.
- [18] V. E. Gmurman, Probability Theory and Mathematical Statistics (Vyssh. Obrazovanie, Moscow, 2007) [in Russian].
- [19] J. P. Henry & K. A. Arnaud, ApJ, 1991. 372, 410.
- [20] M. Markevich, ApJ, 1998, 504, 27.
- [21] A. C. Edge & G. C. Stewart, MNRAS, 1991a, 252, 414.
- [22] C. Jones & W. Forman, ApJ, 1999, 511, 65.
- [23] D. A. White, C. Jones, and W. Forman, MNRAS, 1997, 292, 419.
- [24] L. P. David, A. Slyz, A. Jones, W. Forman et al., ApJ, 1993, 412, 479.
- [25] X.-P. Wu, Y.-J. Xue, and L.-Z. Fang, ApJ, 1999, 524, 22.
- [26] L. Spitzer, Physical Processes in the Interstellar Medium (Wiley, New York, 1978; Mir, Moscow, 1981).
- [27] B. V. Komberg, Astron. Rep, 2006, 50, 432.
- [28] A. C. Edge & G. C. Stewart, MNRAS, 1991b, 252, 428.
- [29] M. Girardi & M. Mezzetti, ApJ, 2001, 548, 79.
- [30] I. K. Rozgacheva & I. B. Kuvshinova, Nelinejnyj mir, 2009, 7, 874.
- [31] A. Vikhlinin, W. Forman, and C. Jones, ApJ, 1994, 435, 162.
- [32] W. Forman, C. Jones, E. Churazov, M. Markevitch et al., arXiv: astro-ph/0604583.
- [33] I. B. Kuvshinova, Catalog of Rich Clusters with Cooling Flows, Dep. v VINITI RAN 20.04.09, No. 237-B2009.
- [34] I. B. Kuvshinova & I. K. Rozgacheva, Astron. Rep, 2010, 54, 696.