Three epochs of EVN observations towards IRAS 23365+3604
Abstract:
The European VLBI Network (EVN) provides us with the necessary sensitivity and angular resolution to study the nuclear and circumnuclear regions in Luminous (L L⊙) and Ultraluminous (L L⊙) Infrared Galaxies. The high Star Formation Rates (SFR) inferred for these galaxies implies both the presence of a high number of massive stars and a dense surrounding medium. Therefore, bright radio SNe are expected to occur. With the aim of estimating the SFR in ULIRGs by means of Core Collapse supernova (CCSN) detections, we started an observing campaign with the EVN on a small sample of the brightest and farthest ULIRGs in the local Universe. We present here our results from three epochs of quasi-simultaneous observations with the EVN at 6 and 18 cm towards one of the objects in our sample: IRAS 23365+3604.
1 IRAS 23365+3604
IRAS 23365+3604 (23h39m017, 36), hereafter IRAS 2336, is an advanced merger at a distance of 252 Mpc (1 mas0.8 pc) with a very high luminosity (log(LL⊙) 12.13) which corresponds to a CCSN rate of SN/year [1].
2 Observations and their analysis
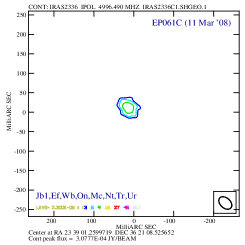
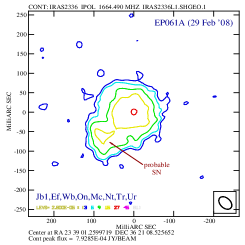
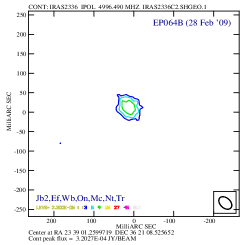
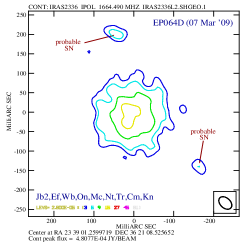
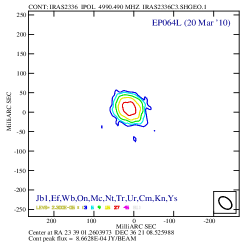
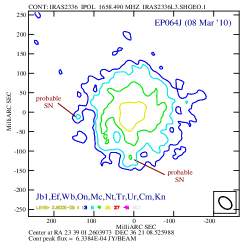
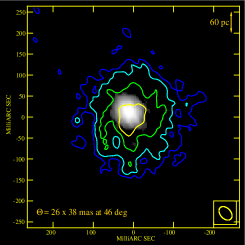
We present multi-epoch, -frequency EVN observations of the ULIRG IRAS 2336 (see Figure 1). Putative young radio SNe with typical peak luminosities of L1027-28 erg s-1Hz-1 should have a flux of 0.01 to 0.1 mJy at the distance of IRAS 2336. The imaging process and therefore the analysis of the observations has proved to be a very challenging task due to:
-
•
The presence of strong extended emission (10 mJy, =05) which hinders the detection of compact sources (SNe).
-
•
The lack of short baselines, which make the imaging algorithm to fail (compare the images we present here with the images we presented in the previous EVN Symposium [2]).
The extended emission at the distance of IRAS 2336 cannot be resolved out with the available angular resolution, and the only way to properly map it is by having a good combination of short baselines (which give enough information for closure phase) and/or using a combination of Gaussian model fitting and delta components. This can be done within the Caltech imaging programme DIFMAP [3], which we have used for the imaging process. We then exported the clean images back into AIPS to analyse them and to produce the final maps that we present here.
3 Results
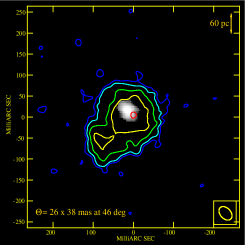
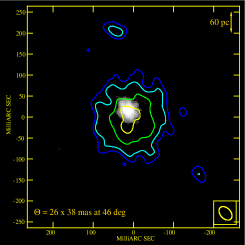
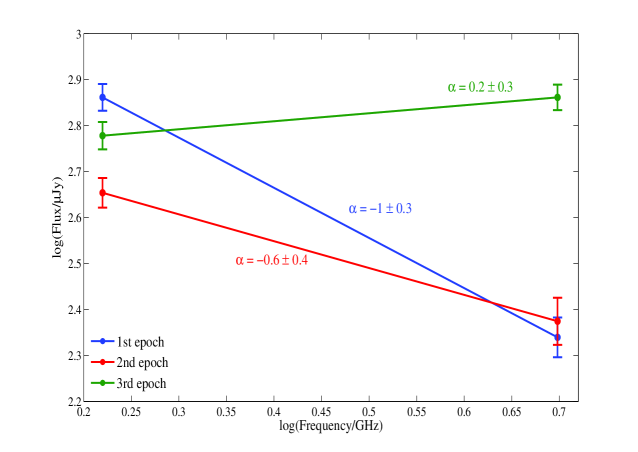
Our images reveal the presence of a nuclear starburst with an approximate extension of 200 pc. We note that at 18 cm, the size of the nuclear region is larger than at 6 cm, for all the epochs. This can be explained by the longer lifetime of electrons at lower frequencies [4]. The high luminosities of the nuclear region (see Table 1) can only be explained by the presence of non-thermal emitters -most likely SNe- within extended emission. In fact, the flattening (from the first to the third epoch) of the spectral index from the nuclear zone (see Figure 2) can be explained by the variation in flux of sources therein and/or appearance of new sources (SN) which would be seen first at higher frequencies and later at lower frequencies [5]. We have also detected some sources at 18 cm with emission 5 (L1027-28 erg s-1Hz-1) with no counterpart at 6 cm. These are candidates of CCSNe exploding in the circumnuclear region (see sources labelled as probable SNe in Figure 1).
| Epoch | L erg s-1 Hz-1 | L erg s-1 Hz-1 | ||
|---|---|---|---|---|
| peak | total | peak | total | |
| 1st | 1.7 0.2 | 1.7 0.2 | 5.5 0.4 | 17.6 0.4 |
| 2nd | 1.8 0.2 | 2.4 0.2 | 3.4 0.3 | 18.9 0.3 |
| 3rd | 5.5 0.4 | 7.2 0.4 | 4.6 0.3 | 15.8 0.3 |
4 Conclusions
The EVN has aided to obtain the deepest and highest resolution radio images ever of one of the most distant ULIRGs in the local Universe. High resolution is important, but the information provided by short baselines is also necessary to properly map the morphology of the diffuse emission in this kind of sources.
References
- [1] Condon, J. J. 1992, Ann. Rev. Astron. & Astrophys. , (3) 0, 575
- [2] Romero-Cañizales, C., Pérez-Torres, M., & Alberdi, A. 2008, EVN observations of the Ultra Luminous Infrared Galaxies IRAS 23365+3604 and IRAS 07251-0248 in proceedings of The 9th European VLBI Network Symposium, \posPoS(IX EVN Symposium)089
- [3] Shepherd, M. C., Pearson, T. J., & Taylor, G. B. 1994, Bull. Am. Astron. Soc. , (2) 6, 987
- [4] Pacholczyk A. G. 1970, Radio Astrophysics (Freeman & Co., San Francisco)
- [5] Weiler, K. W., Panagia, N., Montes, M. J., & Sramek, R. A. 2002, Ann. Rev. Astron. & Astrophys. , (4) 0, 387