Molecular dynamics simulations of oxide memristors: thermal effects
Abstract
We have extended our recent molecular-dynamic simulations of memristors to include the effect of thermal inhomogeneities on mobile ionic species appearing during operation of the device. Simulations show a competition between an attractive short-ranged interaction between oxygen vacancies and an enhanced local temperature in creating/destroying the conducting oxygen channels. Such a competition would strongly affect the performance of the memristive devices.
pacs:
71.38.-k, 74.40.+k, 72.15.Jf, 74.72.-h, 74.25.FyThere are many challenges in understanding and controlling the coupled electronic and ionic kinetic phenomena dominating the behavior of oxide switching devices like Pt/TiO2/Pt, which is an exemplar memristor (resistor with memory)stan , a fourth passive circuit element originally postulated by Leon Chua in 1971stan0 . It has been demonstrated unambiguously that bipolar switching involves changes to the electronic barrier at the Pt/TiO2 interface due to the drift of positively charged oxygen vacancies under an applied electric fieldstan . Various direct measurements revealed formation of localized conducting channels in TiO2: pressure modulated conductance microscopy joshG09 ; miaoG09 , conducting atomic force microscopy (AFM) ruth09 , scanning transmission x-ray microscopy strachan10 , and in-situ transmission electron microscopy kwon10 . On the basis of these measurements, it became quite clear that the vacancy drift towards the interface creates conducting channels that shunt, or short-circuit, the electronic barrier and switch the device ONstan . The drift of vacancies away from the interface breaks such channels, recovering the electronic barrier to switch the junction OFF.
The microscopic understanding of the atomic-scale mechanism and identification of the material changes within an insulating barrier appear to be invaluable for controlling and improving the memristor performance. The number of oxygen vacancies within the volume 10102 nm3 of perspective nano-memristors could be as small as a thousand, so that the conventional statistical (diffusion) approach for dealing with many-particle systems might fail. However, the dynamic phase transitions as well as the competition between thermal fluctuations and particle-particle interactions in stochastic transport can be investigated with the use of Molecular Dynamics (MD) simulations of the Langevin equations describing the thermal diffusion and drift of individual interacting particles sav .
Recently, we have proposed a model for the kinetic behavior of oxide memristors and simulated its toy analog using the MD saaw . Our MD simulations revealed a significant departure of the vacancy distributions across the device from that expected within a standard drift-diffusion approximation. Another important step would be to include thermal effects via local changes in the diffusion coefficient. Indeed, the channel formation in systems like TiO2, NiO, VO2 is certainly accompanied by local heating that is witnessed by the local emergence of high-temperature phases and is observed by thermal microscopy. For instance, fresh TiO2 samples have an amorphous layer of titanium dioxide. To make the device switch in a repeatable manner, a forming step of rather large voltage pulse is usually required to create a vacancy-rich region (forming is not required if e.g. a vacancy-rich layer is provided intentionally by fabrication). During this process, the TiO2 anatase phase forms near the conducting channel, which nominally requires temperatures over 350∘C strachan10 . Studying local thermal effects during switching in TiO2 provides strong evidence for local heating borg09 . Unambiguous evidence for local heating accompanying conducting channel formation comes from third harmonic generation noh3w08 ; low resistance states (LRS) in NiO showing unipolar switching were strongly nonlinear with variations in the resistance as large as 60%, which was most likely caused by the Joule heating of conducting channels inside the films.
Here, we extend our MD of oxygen vacancies interacting via realistic potentials and driven by an external bias voltage by taking into account temperature gradients in thin films of oxide memristors. Based on the observations of oxygen vacancy migration and clustering in bulk miy and nanoscale kwon10 ; strachan10 samples of TiO2 induced by an electric-field, we have modeled a memristor saaw as shown in Fig. 1. In our model, there is a reduced rutile thin layer TiO2-x near one of the metallic electrodes stabilized by the Coulomb mirror potential. Vacancies from this layer can drift toward the opposite electrode in an electric field. Vacancies interact with each other via the pairwise potential , and with external fields corresponding to the time-dependent deterministic force . The environment exerts an independent Gaussian random force, on each particle with zero mean and intensity controlled by the temperature. In the overdamped regime (where inertia is negligible compared to the viscous damping), the Langevin equation describing the drift-diffusion of the i-th particle is sav :
| (1) |
where is the -coordinate of the th vacancy, is the friction coefficient, is the -component of electric pulse force, is the Boltzmann constant, is related to diffusion anisotropy, and is a random force.
The O2- vacancy-vacancy interaction potential, which is crucial for their clustering and phase transformations, can be modeled as
| (2) |
where the short-range repulsive and attractive parts are represented with the parameters eV, nm, and eV nm potential , and the long-range Coulomb repulsion is given by the last term. More generally, the interaction parameters vary from one oxide to another, and the dielectric constant may also vary from sample to sample.
In contrast with strongly inhomogeneous (internal) electric fields, we have assumed in Ref.saaw that the diffusion coefficient is homogeneous in the simulated region, which corresponds to a homogeneous temperature distributions. Here, we extend our model by taking into account local overheating in the sample, which appears to have a drastic effect on the vacancy distribution pattern Indeed, the diffusion coefficient exponentially depends on temperature rad , so that the variations of the local temperature during switching could significantly affect the formation and disintegration of conducting channels.
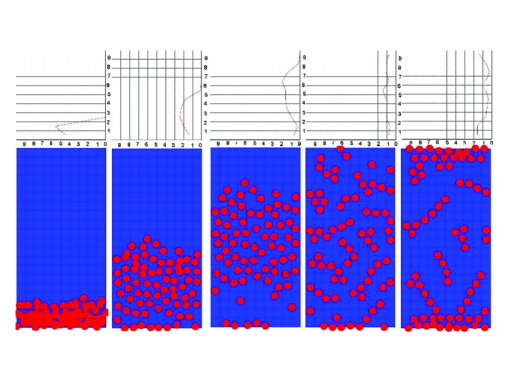
We have performed the MD simulations of a toy memristor with relatively small number of vacancies, (Fig. 1). Initially, we have placed all the vacancies randomly near the bottom of a sample (see Fig. 1 for the initial distribution) and then let these vacancies evolve according to Eq. (1) inside a rectangular box that mimics the actual device. We use the 2D simulation area with the aspect ratio and periodic boundary conditions (BC) along the direction. Note that the periodic BC allow us to simulate an infinite area sample using a rather small number of particles. To use periodic BC, we include periodic images of the vacancies with respect to vertical boundaries of the simulation box. We also incorporate opposite polarity charges by adding mirror images of vacancies with respect to the top and the bottom of the sample.
Since we simulate a limited number of vacancies, one can refer to each particle in our simulations as a cluster of vacancies, where a cluster-cluster interaction may be described by the combination of the Lennard-Jones and Coulomb potentials acting with the force
| (3) |
where the relative strength of the Coulomb potential is given by . This results in the position of the potential maxima and the height of the potential barrier on the order of the depth of the potential well. The pulse strength is taken to be about ten times stronger than the maximum attractive force between vacancy clusters.
We present the results of simulation for the device with homogeneous temperature distribution saaw in Fig. 1. Different columns refer to different moments in time and the top row shows the corresponding local densities. The first column shows the initial distribution of vacancies before simulations: all of them are located at the bottom of the sample. The second and third columns show distribution in the middle and at the end of the pulse. One can see that vacancies are pushed by the pulse to the center of the sample: the density distribution is spread out and its maximum moves towards the top of the sample with a constant velocity. Moreover, even after switching the pulse off the vacancy distribution front keeps moving towards the top of the sample while the vacancies gradually form filamentary clusters (fourth column). Note that, obviously, such filamentary clusters are impossible to reveal when modeling vacancy dynamics by using just vacancy density . Indeed, one cannot see anything interesting from the average density profile (top panel of the fourth column). Finally, vacancies form the percolation paths that are stable during all simulations while the average density again shows nothing interesting apart from a trivial fact that is slightly larger at the top and the bottom of the sample due to the vacancies being attracted to their image charges.
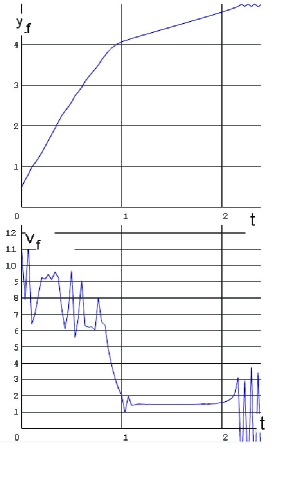
Comparison of our simulations with the averaged density description indicates the following: (i) modeling vacancy dynamics by using macroscopic distributions fails to describe filamentary cluster formation, (ii) there are plenty of metastable vacancy distributions and, thus, one can expect formation of slightly different percolation paths even for a series of experiments on the same sample, (iii) MD simulations are ideal to describe the statistics of such percolation path formation. Further deviation from the standard diffusion approach can be seen when monitoring motion of vacancy distribution front (see Fig. 3), where the maximum is taken with respect to all the vacancies. One can see two different expansion regimes for the front: a pulse driven regime and another one driven by the Coulomb repulsion between the vacancies. Note that the velocity of expansion is always constant indicating that diffusion driven expansion is negligible in our system.
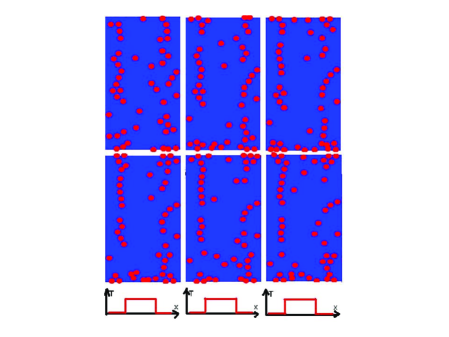
The temperature gradients can change the vacancy distribution patterns significantly. As examples, we have considered variations of the temperature parallel to the electrodes, , Fig. 2, and across , Fig. 4, our toy memristor. These gradients can be due to, e.g., spatial variations of cooling or applying the heat sinks to the sample. We use a square temperature profile along the film in Fig. 2, where corresponds to the middle of the sample, is the width of this region, and is the step function. This mimics possible temperature oscillations along the sample footprint. In the present study, we assume a temperature independent mobility [i.e. a constant in Eq. (1)], which would formally correspond to quantum tunneling rather than thermally activated hopping. One can see that even in this regime the vacancies tend to escape from the hot regions, resulting in a more pronounced formation of percolation vacancy channels in cold regions of the simulated sample.
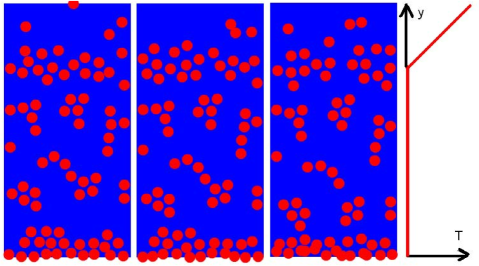
A somewhat similar situation occurs if we assume that the top of the sample is hot with respect to the rest of the sample, i.e., . In other words, we assume that the sample is cold at the bottom ( for ) and the temperature linearly increases in the region , where is the sample thickness. The simulation results for such a distribution of temperature are shown in Fig. 4. As one can see, vacancies cannot form stable configurations in the hot region near the top of the sample: only limited number of vacancies can enter the hot region, these vacancies quickly wander through this region and return back into the cold part of the sample. In contrast, the vacancy distribution is quite stable in the bottom cold region of the sample, as expected.
One can clearly see in Figs. 2 and 4 that even a moderate temperature/diffusion gradient drastically affects the formation of percolation paths. Comparing with the homogeneous temperature regime, Fig. 1, the vacancies are escaping hot regions of the sample and aggregating into the chain formations in the cold regions. This suggests a strong competition between the local heating and the attractive part of the vacancy-vacancy interaction resulting in disintegration/creation of the conducting vacancy channels. Note that we do not consider interactions of vacancies with the crystal matrix, which can be incorporated by adding a crystal potential in our Langevin equations. If potential barriers of are high enough and the motion of vacancies occurs only via thermal hopping between nearest potential minima of , then an exponential temperature dependence of the effective mobility of vacancies can be observed. Thus, the competition between the local heating and vacancy interactions should be much stronger in the thermally activated (hopping) regime, when the effective mobility (proportional to ) and the effective diffusion coefficient exponentially depend on temperature md3 .
In conclusion, we have demonstrated that temperature gradients across memristive devices, producing strong variations of the diffusion rate, affect the vacancy patterns in memristors quite dramatically. Our simulations indicate that variations of temperature across the memristor favor the formation of short-circuiting or shunting vacancy channels. At the same time, considerable temperature gradients in the growth direction, in contrast, produce vacancy-poor regions where vacancy shunts are not formed and electron percolation paths are blocked. Further studies of these effects may have profound impact on present understanding of physics of memristive devices.
References
- (1) J.J. Yang, M.D. Pickett, X.M. Li, et al. Nature Nanotech. 3, 429 (2008).
- (2) D. B. Strukov, G. S. Snider, D. R. Stewart, and R. S. Williams, Nature 453, 80 (2008).
- (3) J. J. Yang, F. Miao, M. D. Pickett, D. A. A. Ohlberg, D. R. Stewart, C. N. Lau, and R. S. Williams, Nanotechnology 20, 215201 (2009).
- (4) F. Miao, J. J. Yang, J. P. Strachan, D. Stewart, R. S. Williams, and C. N. Lau, Appl. Phys. Lett. 95, 113503 (2009).
- (5) R.Mustermann, J. Yang, J.P. Strachan, G.Medeiros-Ribeiro, R.Dittmann, and R.Waser, Phys. Stat. Sol. (RRL) 4, 16 (2009).
- (6) J.P. Strachan, M.D. Pickett, J. J. Yang, S. Aloni, A. L. D. Kilcoyne, G. Medeiros-Ribeiro, and R.S. Williams, Adv. Mater. 22, 3573 (2010).
- (7) D.-H. Kwon, K.M. Kim, J.H. Jang, J.M. Jeon, M.H. Lee, G.H. Kim, X.-S. Li, G.-S. Park, B. Lee, S. Han, M. Kim, C.S. Hwang, Nat. Nanotech. 5, 148 (2010).
- (8) S. Savel’ev, F. Marchesoni, and F. Nori, Phys. Rev. E 70, 061107 (2004), and references therein.
- (9) S. E. Savel’ev, A. S. Alexandrov, A. M. Bratkovsky, R. Stanley Williams, arXiv:1010.5656.
- (10) J. Borghetti, D.B. Strukov, M.D. Pickett, J. Yang, D.R. Stewart, and R.S. Williams, J. Appl. Phys. 106, 124504 (2009).
- (11) S.B. Lee, S.C. Chae, S.H. Chang, J.S. Lee, S. Park, Y. Jo, S. Seo, B. Kahng, and T. W. Noh, Appl. Phys. Lett. 93, 252102 (2008).
- (12) H. Miyaoka, G. Mizutani, H. Sano, M. Omote, K. Nakatsuji, and F. Komori, Sol. State Commun. 123, 399 (2002); K. Tsunoda et al., Appl. Phys. Lett. 90, 113501 (2007); K.M. Kim et al., Appl. Phys. Lett. 90, 242906 (2007); J.R. Jameson et al., Appl. Phys. Lett. 91, 112101 (2007); H. Shima et al., Appl. Phys. Lett. 94, 082905 (2009); Ni Zhong et al., Appl. Phys. Lett. 96, 042107 (2010); and references therein.
- (13) C. Meis and J. L. Fleche, Solid State Ionics 101, 333 (1997).
- (14) M. Radecka, P. Sobas, and M. Rekas, Sol. State Ionics 119, 55 (1999).
- (15) J.J. Yang, J. Borghetti, D. Murphy, D.R. Stewart, and R.S. Williams, Adv. Mater. 21, 3754 (2009).
- (16) S. E. Savel’ev, A. S. Alexandrov, A. M. Bratkovsky, R. Stanley Williams, in preparation.