2 Université de Toulouse ; UPS ; CESR ; 9 avenue du colonel Roche, F-31028 Toulouse cedex 9, France and CNRS ; UMR5187 ; F-31028 Toulouse, France
3 Canadian Institute for Theoretical Astrophysics, University of Toronto, 60 St. George Street, Toronto, ON M5S 3H8, Canada
4 LUTH, Observatoire de Paris-Meudon, Université Paris 7, France
Excitation of H2 in photodissociation regions as seen by Spitzer
Abstract
Aims. We present spectroscopic observations obtained with the infrared Spitzer Space Telescope, which provide insight into the H2 physics and gas energetics in photodissociation Regions (PDRs) of low to moderate far-ultraviolet (FUV) fields and densities.
Methods. We analyze data on six well known Galactic PDRs (L1721, California, N7023E, Horsehead, rho Oph, N2023N), sampling a poorly explored range of excitation conditions (), relevant to the bulk of molecular clouds in galaxies. Spitzer observations of H2 rotational lines are complemented with H2 data, including ro-vibrational line measurements, obtained with ground-based telescopes and ISO, to constrain the relative contributions of ultraviolet pumping and collisions to the H2 excitation. The data analysis is supported by model calculations with the Meudon PDR code.
Results. The observed column densities of rotationally excited H2 are observed to be much higher than PDR model predictions. In the lowest excitation PDRs, the discrepancy between the model and the data is about one order of magnitude for rotational levels 3. We discuss whether an enhancement in the H2 formation rate or a local increase in photoelectric heating, as proposed for brighter PDRs in former ISO studies, may improve the data-model comparison. We find that an enhancement in the H2 formation rates reduces the discrepancy, but the models still fall short of the data.
Conclusions. This large disagreement suggests that our understanding of the formation and excitation of H2 and/or of PDRs energetics is still incomplete. We discuss several explanations, which could be further tested using the Herschel Space Telescope.
Key Words.:
infrared: ISM - ISM: lines and bands - ISM: molecules - ISM: clouds - ISM: evolution - ISM: general1 Introduction
The bulk of interstellar matter is found in regions of low-to-moderate opacity to UV and visible light where stellar radiation governs the chemical and thermal state of the gas. These photodissociation or photon-dominated regions (PDRs, for a review see Hollenbach & Tielens, 1999) are responsible for reprocessing much of the energy output from stars, reemitting this energy in the infrared-millimeter wavelengths, including a rich mixture of gas lines (e.g., emission in fine-structure, rotational, and rovibrational lines). They are privileged objects for studying the chemical and physical processes of the interstellar medium (ISM). The motivation of this study is to test our understanding of the excitation of H2 in a regime of space parameters that has been poorly studied.
Through its ability to observe pure rotational lines of H2 towards a number of bright PDRs, the Infrared Space Observatory (ISO) has given important information on the local microphysics of interstellar gas. One conclusion of these studies is that the H2 line intensities and the gas temperature, derived from the first rotational levels of H2, are higher than model calculations Bertoldi (1997); Draine & Bertoldi (1999); Thi et al. (1999); Kemper et al. (1999); Li et al. (2002); Habart et al. (2003). Changes in the description of heating and cooling processes or of the H2 formation rate have been proposed to account for this discrepancy Habart et al. (2004). With H2 UV absorption line observations performed by the Far Ultraviolet Spectroscopic Explorer (FUSE), the H2 formation and excitation processes in diffuse and translucent clouds have also been reconsidered. In particular, UV data show significant amounts of rotationally excited H2, for which UV photons could not be the unique heating source Gry et al. (2002); Nehmé et al. (2008). The H2 excitation in the diffuse interstellar medium may be tracing the dissipation of interstellar turbulence in C-shocks Flower & Pineau Des Forets (1998) or interstellar vortices Falgarone et al. (2005).
There has been very little exploration of the physics of PDRs with moderate FUV fields and densities, an intermediate regime between the diffuse clouds and the bright PDRs. The sensitivity of the infrared spectrograph (IRS) onboard the Spitzer Space Telescope provides a unique opportunity to observe H2 pure rotational line emission in low-brightness sources. As part of the SPECPDR111See http://www.cesr.fr/joblin/SPECPDR public/SPECPDR.html program dedicated to the study of PDRs with Spitzer, we used this capability to study the H2 line emission in regions with times the Solar Neighborhood Far-UV interstellar radiation field 222For a discussion on the definitions of the mean interstellar radiation field used in the literature on PDRs see Appendix B of Allen et al. (2004) or Appendix C of Le Petit et al. (2006). as given by Draine (1978). Our sample consists of well-known PDRs, so that they are good test cases for models. These observations are analyzed in combination with previous ISO and ground-based data of rotational and rovibrational H2 lines when available, in order to help constrain the relative roles of ultraviolet pumping and collisions in establishing the level populations.
The paper is organized as follows. In Sect. 2, we present our PDR sample. In Sect. 3, we present the IRS spectrometer observations. In Sect. 4, we briefly describe the PDR model used to analyze the data, and in Sect. 5 we compare the observed H2 line emission to the PDR model predictions. In Sect. 6, we compare our results with UV absorption measurements in diffuse clouds. In Sect. 7, we discuss several possibilities of explaining our results. In Sect. 8, in light of our PDR observations, we discuss H2 line infrared emission measurements in galaxies and along Galactic lines of sight. Our conclusions are summarized in Sect. 9.
2 Selected PDRs
In the framework of the SPECPDR program, we have observed several photodissociation regions - a total of eleven including nine galactic and two extra-galactic sources - with all the instruments onboard Spitzer. In this paper, we select six of the nine galactic sources. They are close to the Sun (100-600 pc) with well-defined geometry and radiation field. Most of them are inclined with respect to the line of sight with nearly edge-on (shell-like) geometry. They represent classic examples of the interaction between UV radiation and an interstellar molecular cloud. They span a wide range of physical conditions; temperature of the exciting star: = 15, 000 - 37, 000 K, FUV field: = 5 - 1000 in Draine units, proton gas densities: = - cm-3. A brief description of each source is given below.
| Source | Dist.a | Exciting star | FUV fieldb | Densityc | Geometryd | Ref. |
|---|---|---|---|---|---|---|
| (pc) | (Teff, spec.type) | (Draine) | (cm-3) | |||
| L1721 | 134 | 20,000 K, B2V | 4.5 [3-6] | 3 102-3 103 | S-C | (1) |
| California | 543 | 37,0000, O7.5III | 19 [7-37] | 103-104 | E-O | (2) |
| N7023E | 429 | 15,000 K, B5Ve | 51 [27-82] | 7 103 | E-O | (3) |
| Horsehead | 352 | 33,000 K, O9.5V | 60 [30-110] | 104-105 | E-O | (4) |
| rho Oph | 136 | 22,000 K, B2V | 250 [180-340] | 1-5 104 | E-O,C | (5) |
| N2023N | 472 | 23,000 K, B1.5V | 550 [100-1370] | 104-105 | E-O,C | (6) |
a Estimated by Hipparcos Perryman et al. (1997) and Hoogerwerf et al. (2000). b Incident FUV radiation field expressed in units of the Draine (1978) average interstellar radiation field with uncertainties in between brackets ([, ]). c Proton gas density derived from different observational constraints. d Geometry codes : S-C : Spherical Cloud; E-O : Edge-On; C : Cavity. References : (1) Habart et al. (2001); (2) Boulanger et al. (1988); (3) Rapacioli et al. (2006); Berné et al. (2007); (4) Abergel et al. (2003); Teyssier et al. (2004); Habart et al. (2005); Pety et al. (2005); (5) Habart et al. (2003); Motte et al. (1998); (6) Field et al. (1998); Compiègne et al. (2008)
L1721. At the low excitation end, our sample contains the Lynds Dark Nebula 1721 (L1721, Lynds, 1962), a nearby isolated molecular cloud in the Ophiuchi region. This moderate opacity cloud is heated on one side by the star Sco and by a more isotropic interstellar radiation field created by the Upper Scorpius association (e.g., Habart et al., 2001). The B2 star Sco is located at 130 pc from the Sun. Visual extinction map and emissions of the dust and gas cooling lines ( 158 m, 63 m) have been measured toward the L1721 cloud Habart et al. (2001). The exciting radiation field is estimated to be 3 to 6 times the Draine radiation field.
California. The California Nebula (NGC 1499) is an emission nebula located in the constellation Perseus. The O7.5III star Per is the source of radiation of the California nebula. This star is located at 540 pc. Here, we focus on the filament situated at 45’ from the star. The intensity of the exciting radiation field after dilution and assuming that the distance of the exciting star to the PDR is equal to the distance projected onto the sky is estimated to be 19 times the Draine field.
N7023E. NGC 7023 is a reflection nebula around the Herbig B5Ve illuminating star HD 200775. This star is located at 430 pc. Three PDRs are visible around the star. Here, we focus on the NGC 7023 East located further east of the star (170”). Spitzer spectroscopic dust studies of the East PDR was performed by Berné et al. (2007). The exciting radiation field is estimated to be 87 times the Habing field, i.e. 51 times the Draine field.
Horsehead. The Horsehead nebula (B33) emerges from the edge of the L1630 molecular complex. The Ori star, a O9.5V system, is the main heating source in this region. This star is located at 350 pc. We focus here on the western edge of the nebula situated at 0.5∘ from Ori. Emissions of the gas and dust associated with the western edge have been mapped from the visible to millimeter wavelengths by various authors (e.g., Pound et al., 2003; Teyssier et al., 2004; Pety et al., 2004; Habart et al., 2005; Ward-Thompson et al., 2006; Philipp et al., 2006; Goicoechea et al., 2006; Pety et al., 2007). This PDR is illuminated and viewed nearly edge-on. The intensity of the exciting radiation field after dilution and assuming that the distance of the exciting star to the PDR is equal to the distance projected onto the sky is 60 times the Draine field.
Rho Oph. The Ophiuchi molecular cloud is a nearby star-forming region. The western part of this cloud is bounded by a bright filament structure, forming an edge-on (shell-like) PDR, illuminated by the B2 HD147889 star Abergel et al. (1999). The HD147889 star is located at 130 pc. We focus here on the western edge situated at 600” from the illuminated star. ISO spectroscopic dust and gas (H2) studies of this PDR were performed Habart et al. (2003). The exciting radiation field is estimated to be 250 times the Draine field.
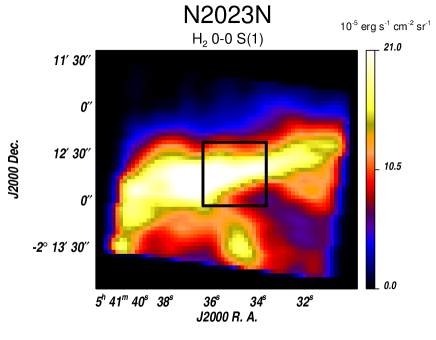
N2023N. NGC 2023 is a reflection nebula excited by a B1.5V star (HD37903), which is embedded in the L1630 cloud. The HD37903 star is located at 470 pc. In this work, we focus on the filament situated at 150” north of the star. Spitzer spectroscopic dust studies of the N2023 north PDR was performed by Compiègne et al. (2008). The intensity of the exciting radiation field after dilution and assuming that the distance of the exciting star to the PDR is equal to the distance projected onto the sky is estimated to be 550 times the Draine field. According to the study of Compiègne et al. (2008), there is a visual extinction of equal to 1.25 between the star and the filament. The intensity of the exciting radiation field after dilution and extinction is 120 times the Habing field, i.e. 70 times the Draine field.
In Table 1, we summarize the distances, radiation sources, gas densities and geometries for each region as determined from the literature. The distances have been estimated by Hipparcos Perryman et al. (1997) and other measurements Hoogerwerf et al. (2000). As given above for most of our sources, the radiation field factor is determined from the expected FUV luminosity of the exciting star and assuming that the distance of the exciting star to the PDR is equal to the distance projected onto the sky. This is an upper limit in principle. Uncertainties in due to the errors in the distance of the exciting star from the Sun are given, so, estimations of based on observations of dust and gas lines emissions are also reported. The gas density for each region is also given in Table 1. The density inferred from various atomic/molecular species shows a relatively large dispersion. This dispersion could result from density gradients from the outer hot layer to the inner molecular cold layer (see, for example, Walmsley et al., 2000; Habart et al., 2003, 2005). However, what is needed for our study is the density in the H2-emitting region.
3 Observations


| Source | Ref. | |||||
|---|---|---|---|---|---|---|
| (erg s-1 cm-2 sr-1) | (erg s-1 cm-2 sr-1) | (erg s-1 cm-2 sr-1) | (erg s-1 cm-2 sr-1) | (erg s-1 cm-2 sr-1) | ||
| L1721 | 6.9e-06[1.5e-06] | 2.3e-05[1.1e-06] | 9.1e-06[2.6e-06] | 1.0e-05 | - | (1) |
| California | 4.6e-06[7.0e-07] | 1.3e-05[1.3e-06] | 6.4e-06[3.2e-06] | 5.5e-06[2.7e-06] | - | (1) |
| N7023E | 3.0e-05[1.3e-06] | 1.5e-04[1.1e-05] | 1.5e-04[2.0e-05] | 9.2e-05[4.6e-05] | - | (1) |
| Horsehead | 1.2e-05[2.8e-06] | 4.3e-05[9.4e-06] | 5.4e-05[1.3e-05] | 5.9e-05[1.3e-05] | 7.5e-06[1.5e-06] | (1,2) |
| rho Oph | 6.6e-05[1.4e-05] | 2.5e-04[5.5e-05] | 2.4e-04[4.8e-05] | 8.6e-05[8.6e-06] | 2.3e-05[5.7e-06] | (1,2) |
| N2023N | 5.5e-05[1.2e-05] | 1.5e-04[3.2e-05] | 1.1e-04[4.0e-05] | 6.2e-05[3.1e-05] | 1.1e-05[2.2e-06] | (1,2) |
| Source | ||||||
|---|---|---|---|---|---|---|
| (cm-2) | (cm-2) | (cm-2) | (cm-2) | (cm-2) | ||
| L1721 | 4.2e+19[9.4e+18] | 5.2e+18[2.5e+17] | 2.6e+17[7.3e+16] | 6.2e+16 | - | 0.007[0.002] |
| California | 2.8e+19[4.2e+18] | 3.0e+18[2.9e+17] | 1.8e+17[9.1e+16] | 3.4e+16[1.7e+16] | - | 0.007[0.004] |
| N7023E | 1.8e+20[8.1e+18] | 3.4e+19[2.6e+18] | 4.2e+18[5.7e+17] | 5.7e+17[2.8e+17] | - | 0.022[0.003] |
| Horsehead | 7.1e+19[1.7e+19] | 9.8e+18[2.1e+18] | 1.5e+18[3.8e+17] | 3.7e+17[8.3e+16] | 1.0e+15[2.0e+14] | 0.023[0.008] |
| rho Oph | 4.0e+20[8.6e+19] | 5.8e+19[1.2e+19] | 6.9e+18[1.3e+18] | 5.4e+17[5.4e+16] | 3.0e+15[7.7e+14] | 0.016[0.005] |
| N2023N | 3.3e+20[7.3e+19] | 3.5e+19[7.2e+18] | 3.0e+18[1.1e+18] | 3.8e+17[1.9e+17] | 1.9e+15[3.7e+14] | 0.009[0.004] |
| Source | OTP | OTP | ||||
|---|---|---|---|---|---|---|
| (K) | (K) | (K) | (K) | |||
| L1721 | 206.[ 19.] | 305. | - | - | - | - |
| California | 208.[ 25.] | 301.[ 38.] | - | - | 2.3 | - |
| N7023E | 269.[ 11.] | 327.[ 43.] | - | - | 1.3 | - |
| Horsehead | 264.[ 30.] | 398.[ 49.] | 458.[ 92.] | 747.[208.] | 1.5 | 2.7 |
| rho Oph | 252.[ 22.] | 290.[ 18.] | 327.[ 20.] | 543.[ 48.] | 1.1 | 2.6 |
| N2023N | 221.[ 26.] | 300.[ 45.] | - | - | 1.6 | - |
| Source | N(H2) | N(H2) | N(H2) | N(H2) |
|---|---|---|---|---|
| (cm-2) | (cm-2) | (cm-2) | (cm-2) | |
| L1721 | 4.9e+20 | 5.1e+19 | - | - |
| California | 3.2e+20 | 3.0e+19 | - | - |
| N7023E | 1.5e+21 | 2.9e+20 | - | - |
| Horsehead | 6.1e+20 | 5.7e+19 | 7.5e+19 | 6.0e+18 |
| rho Oph | 3.6e+21 | 6.4e+20 | 1.1e+21 | 2.3e+19 |
| N2023N | 3.5e+21 | 3.5e+20 | - | - |
a Intensities at the emission peak with uncertainty (1) between brackets. b The level populations are derived under the assumption that the line is optically thin. c Excitation rotational temperature, , derived from the ratio of the and column densities. d Fit of the ortho-to-para (OTP) ratio of the levels and assuming thermalized emission at the temperature . e The total H2 column density inferred from the column densities assuming optically thin, thermalized emission at the temperature . Ref. (1) Spitzer Space Telescope; (2) ESO 3.6-m telescope at La Silla Habart et al. (2003) and New Technology Telescope with the SOFI instrument Habart et al. (2005); Compiègne et al. (2008).
3.1 IRS spectrometer data
The selected PDRs were observed using the IRS spectrometer in the low (60-127) and/or high (600) spectral resolution mode. In the low spectral resolution mode, spectral line maps were obtained using the “spectral mapping” mode with a number and size of steps suitable for each PDRs in order to cover the infrared emitting region. Projection onto the same spatial grid (2.5”/pixel) and convolution into the same beam (Gaussian with a full width high maximum of 10.7”) were performed to compare the different line maps obtained. In the high spectral resolution mode, several individual sky positions or smaller spectral line maps were obtained. We used the S17 version of the data delivered by the Spitzer Science Center. For details of our observations and data reduction method see Joblin et al. (2005) and Compiègne et al. (2007).
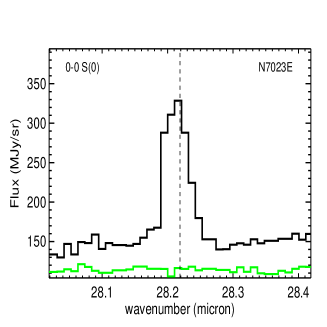
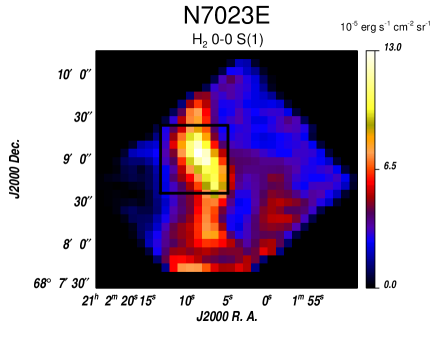
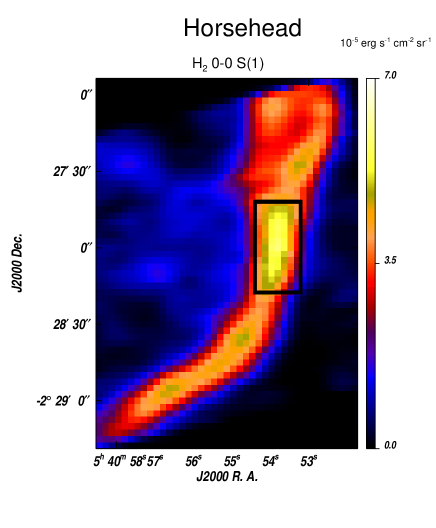
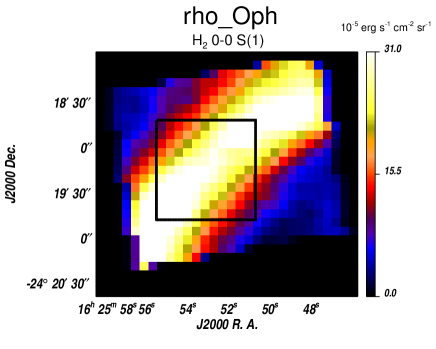
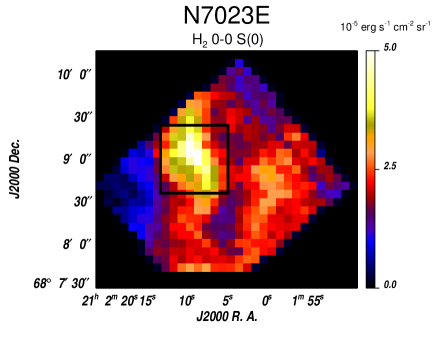
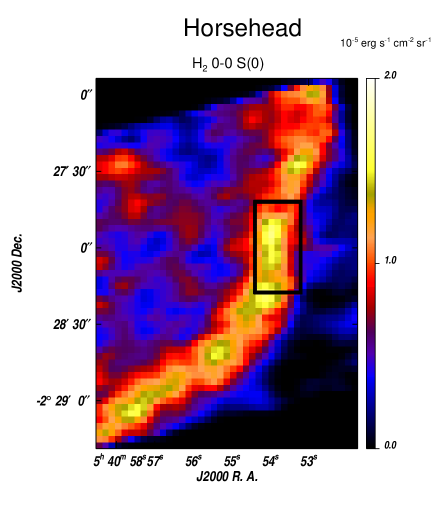
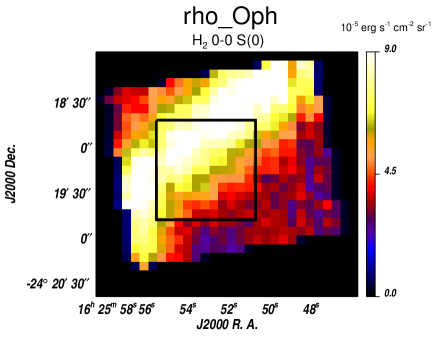
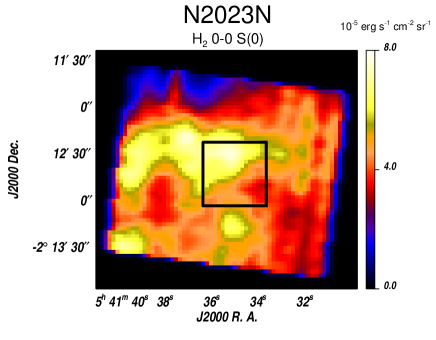
We present in Fig. 1 the averaged IRS spectra obtained with the low spectral resolution mode in the short-low (SL, 5.2 - 14.5 m) and long-low (LL, 14 - 38 m) modules. The spectra are averaged in a box marked in Fig. 3 showing maps in the H2 0-0 S(1) line emission at 17.03 m. The averaged area centered at the emission peak covers the emission zone observed by both the IRS SL and LL submodules. For L1721 and California, all pixels are averaged to increase the signal-to-noise ratio, since these extended PDRs are fainter and do not present any detected spatial variation within the field observed with IRS. In the case of California, N7023E and rho Oph, only the LL IRS submodule is available. These three objects have already been observed with the Circular Variable Filter (CVF, 45, 5.15-16.5 m) of ISOCAM. We present the combined ISO-CVF and IRS-LL spectra in Fig. 1.
The IRS wavelength coverage allowed us to detect several strong H2 pure rotational lines from 0-0 S(0) to S(3) at 28.2, 17.03, 12.29, and 9.66 m, the aromatic band features at 6.2, 7.7, 8.6, 11.3 m, the dust mid-IR continuum emission and the fine structure lines of ionized gas [NeII] at 12.8 m, [SIII] at 18.7 and 33.4 m and [SiII] at 34.9 m. The rotational lines 0-0 S(4), S(5) at 8.03 and 6.91 m, blended with the strong aromatic feature at 7.7 m and possibly the ionized argon line [ArII] at 6.98 m, are marginally detected in some sources. In the CVF spectra of the California, N7023E and rho Oph, the rotational line 0-0 S(2) at 12.29 m appears blended with the [NeII] line at 12.8 m because of the CVF lower spectral resolution. To estimate the flux in the 0-0 S(2) line for these objects, we used the high spectral resolution IRS data and/or previous ISO observations (see below). In the case of the faint L1721 PDR, the 0-0 S(2) and S(3) lines are marginally detected in the IRS low spectral resolution data. We used the high spectral resolution data to estimate the flux in the 0-0 S(2) line (as described below). For the 0-0 S(3) line, an upper limit was derived from the low spectral resolution data.
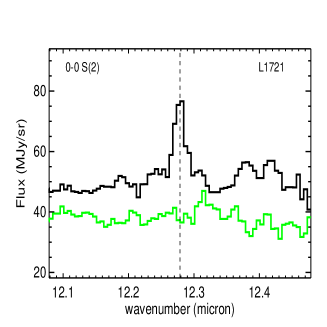
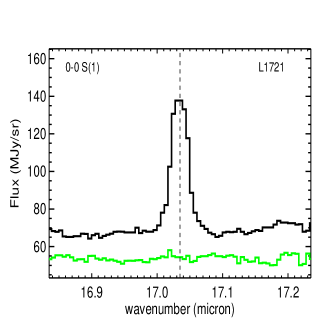
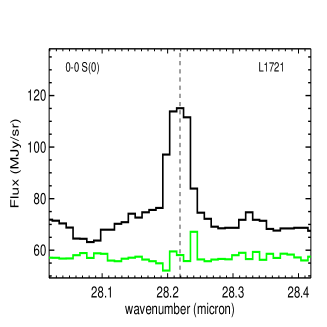
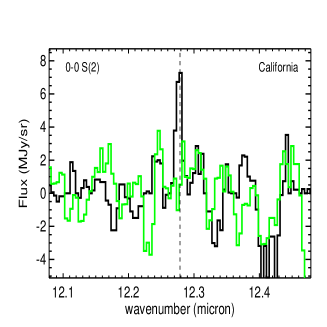
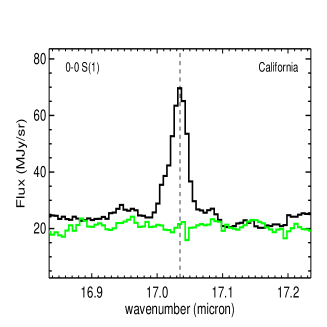
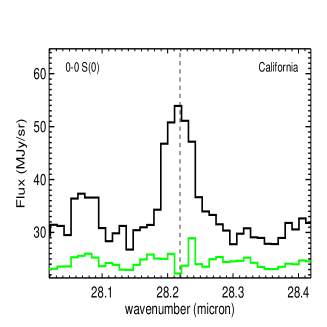
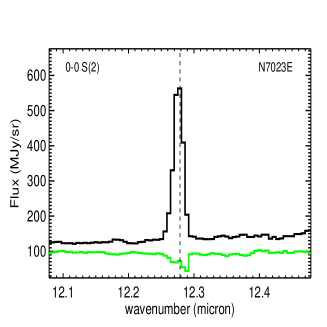
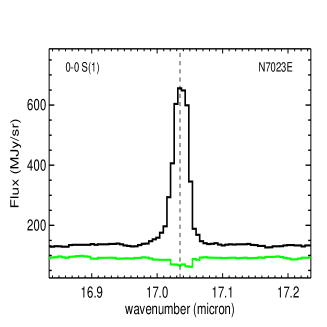
For L1721, California and N7023E, we present in Fig. 2 the spectra obtained with the high spectral resolution mode in the short-high (SH, 9.9-19.6 m) and long-high (LH, 18.7-37.2 m) modules. The data are averaged in the module slits. The wavelength coverage allows us to detect the 0-0 S(0), S(1) and S(2) lines at 28.2, 17.03, and 12.29 m. Both the S(1) and S(0) lines, which are visible in the low spectral resolution data, are clearly detected in the high spectral resolution data. We find good agreement between the low and high spectral resolution measurements. The S(2) line is clearly better detected in the high spectral resolution data. Nevertheless, for one object (California), the S(2) line is marginally detected with only 2 detection in amplitude.
When available, we complement and compare our measurements with ISO short wavelength spectrometer (SWS, 1500-2500) data. For one object of our sample (rho Oph), a series of pure rotational lines (0-0 S(0) through S(5)) have been detected using SWS at several positions towards the infrared emitting region Habart et al. (2003). The SWS positions are localized in the IRS-LL field (see Fig. 1 in Habart et al. (2003) and Fig. 3 in this paper). For the first rotational S(0) and S(1) lines detected with both IRS/Spitzer and SWS/ISO, convolution into the same beam (SWS beam 20”) were performed in order to compare the data. We find good agreement between the IRS and SWS data with differences on the lines flux 30%. To estimate the flux in the other rotational lines S(2)-S(5), we spatially averaged the SWS positions data situated over the box marked in Fig. 3.
In Table 2, we report the observed intensities of the first four H2 pure rotational lines. Line fluxes and error bars were generally obtained by integrating the average spectra within the lines. Typical error bars are about 10-30%. In Table 2, we also report the intensities for the H2 1-0 S(1) rovibrational line obtained from high spatial resolution ground based observations when available. The 1-0 S(1) data have been spatially averaged over the box marked in Fig. 3.
3.2 Column densities, temperatures, and ortho-to-para ratio
The intensity of a transition between two levels (upper) and (lower) can be converted into the population of the upper level, under the assumption that the line is optically thin so that . The level populations derived for each transition are given in Table 2. We did not correct for extinction for the mid-IR H2 rotational line intensities, as the effect of reddening is within our error bars for =5-15, which is the typical range of values for our PDRs (see references in Table 1). It is only at shorter wavelengths that dust extinction will significantly attenuate the emission. For the 1-0 S(1) line at 2.12 m, we correct for dust attenuation using a factor .
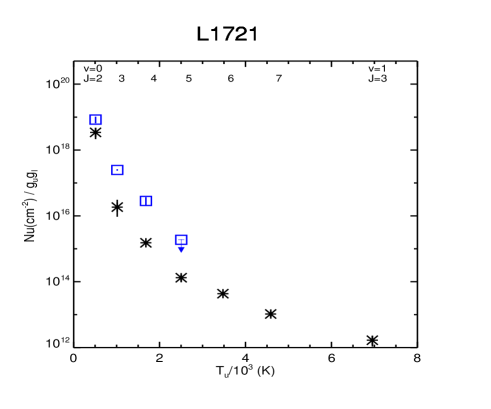
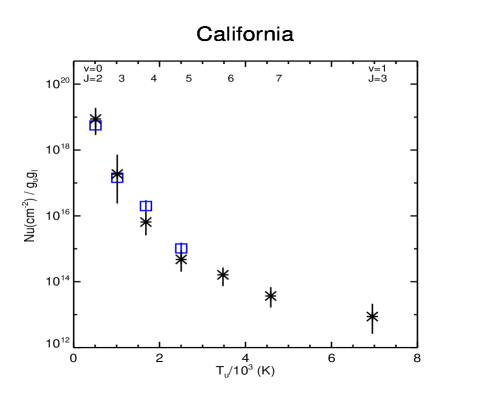
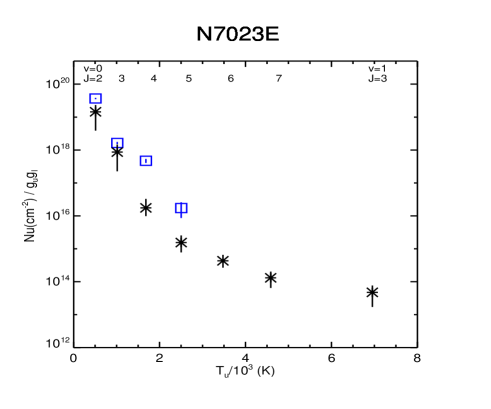
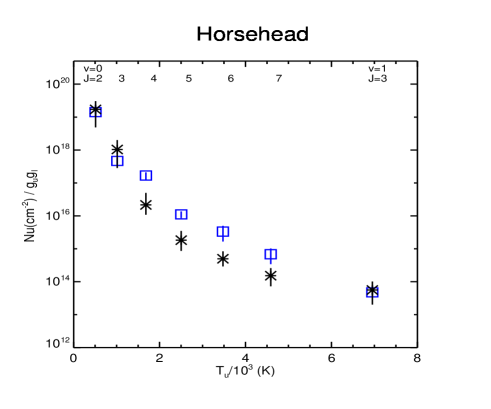
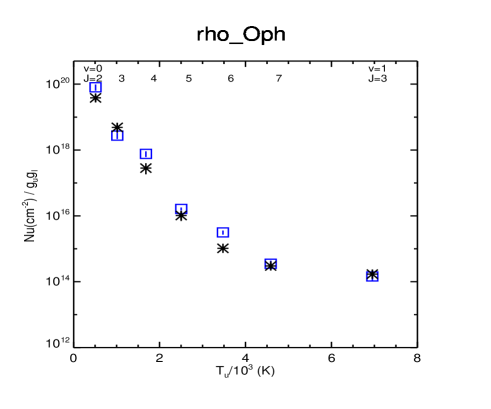
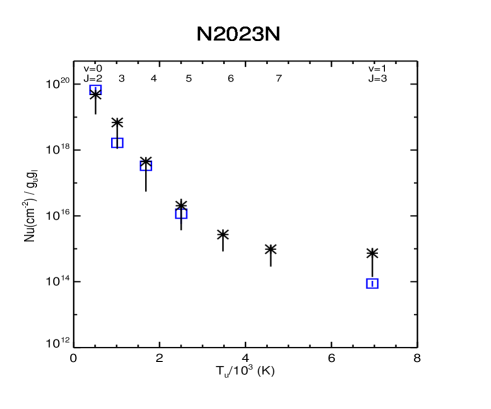
Based upon the column densities, we present the excitation diagrams in Fig. 4. In Table 2, we report the rotational excitation temperatures, , derived from the ratio of the and column densities. Because the ortho-to-para ratio could show departures from equilibrium, the quantity is estimated when and are either both odd or both even. In Table 2, we give the rotational excitation temperatures , , , and . We find that the rotational diagrams exhibit a noticeable curvature. A single temperature cannot describe the full set of observed line intensities and the inequalities are a manifestation of the curvature apparent in the rotational diagrams. The v=0 rotational distributions are characterized by an excitation temperature between 200 and 700 K. In order to fit the rotational diagrams, a combination of at least two H2 gas components is required: one cool/warm (100-300K) and another warm/hot (300-700K) with much lower column densities (about a few percent of the main cool/warm component).
In Table 2, we also report a fit of the ortho-to-para ratio (OTP) for the to levels with , and , and assuming thermalized emission at the temperature . Unfortunately, not enough H2 lines have been measured for L1721 to do a proper fit of the OTP ratio. For California and N7023E, the OTP ratios derived are about 1-2 for the to levels. For the rotational levels to , not enough H2 lines have been measured in the CVF spectra to fit the OTP ratio. In the moderate excited PDRs, such as Horsehead and rho Oph, the OTP ratios derived are about 1 for the to levels, while about 3 for the to levels. The local thermodynamic equilibrium ratio OTPLTE is equal to 3 at the relevant temperatures (200K). The non-equilibrium behavior has already been noted in the ISO observations of rho Oph Habart et al. (2003) and other PDRs (e.g., Moutou et al., 1999; Fuente et al., 1999). The H2 column densities inferred from the measured line intensities and assuming thermalized emission at the temperatures derived are also reported in Table 2.
In spite of their simple appearance, any interpretation of these diagrams has to take several factors into account. First, the gas temperature could vary very rapidly through the PDR layer, and it is likely that with our spatial resolution (10” or 0.02 pc at 400 pc) the temperature structure is not spatially resolved. Second, only the lowest rotational levels are collisionally excited, and this holds up to different for low- and high-FUV field and gas density PDRs. Third, the excited rotational populations can be affected by UV pumping. An analysis using PDR models is thus necessary.
4 PDR model
4.1 Description
To analyze the H2 emission observations, we used an updated version of the Meudon PDR code described in Le Petit et al. (2006). The model considers a stationary plane-parallel slab of gas and dust illuminated by an ultraviolet radiation field coming from one or both sides of the cloud. It solves the chemical and thermal balances iteratively at each point of the cloud.
Here, we present a grid of isochoric models with radiation field coming from one side. The adopted densities are , 5 , , 5 , and in the range of values prevailing in our PDR sample (see Table 1). For the incident radiation field, we use the Draine UV radiation field scaled by the factor . The adopted scaling factors of the Draine radiation field at the cloud edge are in the range of values prevailing in our PDR sample (see Table 1).
For the gas-phase abundance, our assumed abundances are consistent with estimates for the average abundances in the interstellar diffuse and translucent medium as derived from UV absorption measurements Savage & Sembach (1996); Meyer et al. (1997, 1998). For the grain properties, the size distribution is assumed to be a power-law function following the MRN law; the UV extinction curve is taken as equal to a standard galactic expression; the grain absorption cross sections is taken from Draine & Lee (1984); Laor & Draine (1993). These values are determined for spherical particles of graphite and silicates for a sample of radii greater than 1 nm. Values corresponding to radii smaller than 50 nm are considered to mimic polycyclic aromatic hydrocarbon (PAH) properties. The heating rate due to the photoelectric effect on small dust grains (including PAHs) is derived from the formalism of Bakes & Tielens (1994) with some significant upgrades (see Le Petit et al., 2006). A summary of the most important model input parameters are given in Table 3.
| Parameter | Value | Comment |
|---|---|---|
| 5 10-17 s-1 | cosmic ray ionization | |
| 2 km s-1 | turbulent velocity | |
| Extinction | standard galactic | parameterization of Fitzpatrick & Massa (1990) |
| 3.10 | Av / E(B-V) | |
| 4.20e-01 | dust albedo | |
| 6.00e-01 | dust anisotropy factor | |
| 1.00e-02 | Dust to gas mass ratio | |
| 3 g/cm3 | Dust density (g/cm3) | |
| 3.50e+00 | MRN dust size distribution index | |
| 1.00e-07 cm | dust minimum radius | |
| 1.50e-05 cm | dust maximum radius | |
| cm3 s-1 | H2 formation rate Habart et al. (2004) | |
| H + H2 collision rate Le Bourlot et al. (1999) | ||
| He/H | 0.1 | |
| O/H | 3.2 10-4 | Gas abundance Meyer et al. (1998) |
| C/H | 1.3 10-4 | Gas abundance Savage & Sembach (1996) |
| N/H | 7.5 10-5 | Gas abundance Meyer et al. (1997) |
4.2 H2 specifications
For the collisional excitation and de-excitation of H2, we adopt here the quantum mechanical calculations given by Le Bourlot et al. (1999). It must be underlined that the cross sections for collisional excitation and deexcitation of H2 are still not completly known. The quantum mechanical calculations adopted here contain only rate coefficients for the first fifty levels (20,000 K) and do not include reactive transitions. However, the populations of the (=0, ) levels, where collision data exist, should be only secondarily affected by the missing collision data Shaw et al. (2005); Kaufman et al. (2006). Only for high excited levels (e.g., the 1-0 S(1) line) and high densities and UV fields (e.g., Orion Bar for which the population of the excited states is determined either by collisions or by collisionally modified FUV pumping) will the rate uncertainties affect the emission line intensities.
Although there is a consensus that H2 forms on the surface of dust grains Gould & Salpeter (1963); Hollenbach & Salpeter (1971); Jura (1975); Duley & Williams (1984), the mechanism has not yet been fully understood. This is partly because we are ignorant of interstellar grain properties and we do not understand surface reactions in the interstellar context. Here, we adopt a simple empirical prescription using an H2 formation rate as derived from astronomical observations. In the ISM studies, the commonly adopted value of the formation rate is 3 cm3 s-1 inferred from UV absorption lines from diffuse clouds Jura (1975); Gry et al. (2002). However, studies based on ISO observations suggest that a higher rate of about five times this standard value is required to account for H2 emission in moderately excited PDRs (such as rho Oph, S140, and IC 63, Habart et al., 2004). Such a high H2 formation rate in warm gas could be explained by a formation mechanism involving a chemisorbed H atom, analogous to the mechanism presented by Cazaux & Tielens (2004). Based on this, we assume a single constant value of . This assumption is discussed in Sect. 7.
Another parameter is the internal energy of the nascent H2. The energy released by the nascent molecule (4.5 eV) is distributed between the grain excitation, internal energy, and kinetic energy of released molecules. The branching ratios are not known and probably depend on conditions in the cloud and the nature of the grain itself. Using standard option based on an equipartition argument, we assume that the internal energy (1.5 eV) is distributed with a Boltzmann law among all the energy levels. This assumption is discussed below.
4.3 H2 excitation
The excited states of H2 are populated by inelastic collisions with gas phase species, UV pumping or the formation process. The first pure rotational lines (e.g., 0-0 S(0) and S(1)) essentially result from collisional excitation, since their upper states (, 2 and 3) are relatively low lying and their critical densities are low even at low temperatures ( cm-3 for K, Le Bourlot et al., 1999). These line intensities depend mainly on the gas temperature at the photodissociation front. In contrast, the high rotational and ro-vibrational lines (e.g., 1-0 S(1)) result essentially from the decay of electronically excited states that are pumped through the absorption of FUV photons. The line intensities do not reflect the gas temperature but the fraction of the FUV photon flux pumping H2. UV pumping could also contribute significantly to the excitation of the pure rotational 0-0 S(2)-S(5) lines, since their upper states (, 4-7) are relatively high and their critical densities are high even at moderate temperatures ( cm-3 for K, Le Bourlot et al., 1999). For a given line, the relative importance of UV pumping and collisions depends on the PDR physical conditions. In our low and regions (such as L1721, California with cm-3, 5-20), the rotational levels are mainly controlled by ultraviolet pumping rather than collisions. For moderate and regions (such as N7023E, Horsehead with cm-3, 50), collisions dominate the excitation for the levels, while UV pumping contributes mostly to the excitation of the levels. For higher and regions (such as rho Oph, N2023N with cm-3, 250-550), collisions dominate the excitation until the levels.
The internal energy of the nascent H2 can also specifically affect the level populations. However, for an equilibrium between photodissociation and reformation, the ratio of the formation to UV pumping rates is only about 15/85. Of all the UV photons absorbed by H2 only 10 to 15 % lead to dissociation. Thus, unless the level distribution of newly formed H2 is strongly concentrated toward a small number of high energy levels, the H2 formation excitation will not specifically affect the H2 spectrum.
5 Comparison between PDR model and observations
In this section, we compare the models predictions to the observations. Figure 4 presents the excitation diagrams as observed and as predicted for each object. For each object, H2 line intensities were computed from linear interpolation of our grid of models with the suitable values of the FUV incident radiation field and gas density. Error bars due to uncertainties in the FUV field have been estimated. In order to compare the predicted and observed line intensities, the PDR is tilted with respect to the line of sight. For simplicity, we adopt the same viewing angle between the line-of-sight and the normal to the PDR for all the models. We assume , which is suitable for PDRs viewed nearly edge-on as most of our PDRs are. The optically thin H2 lines surface brightness are enhanced by a factor 1/cos() 6 relative to the face-on surface brightness.
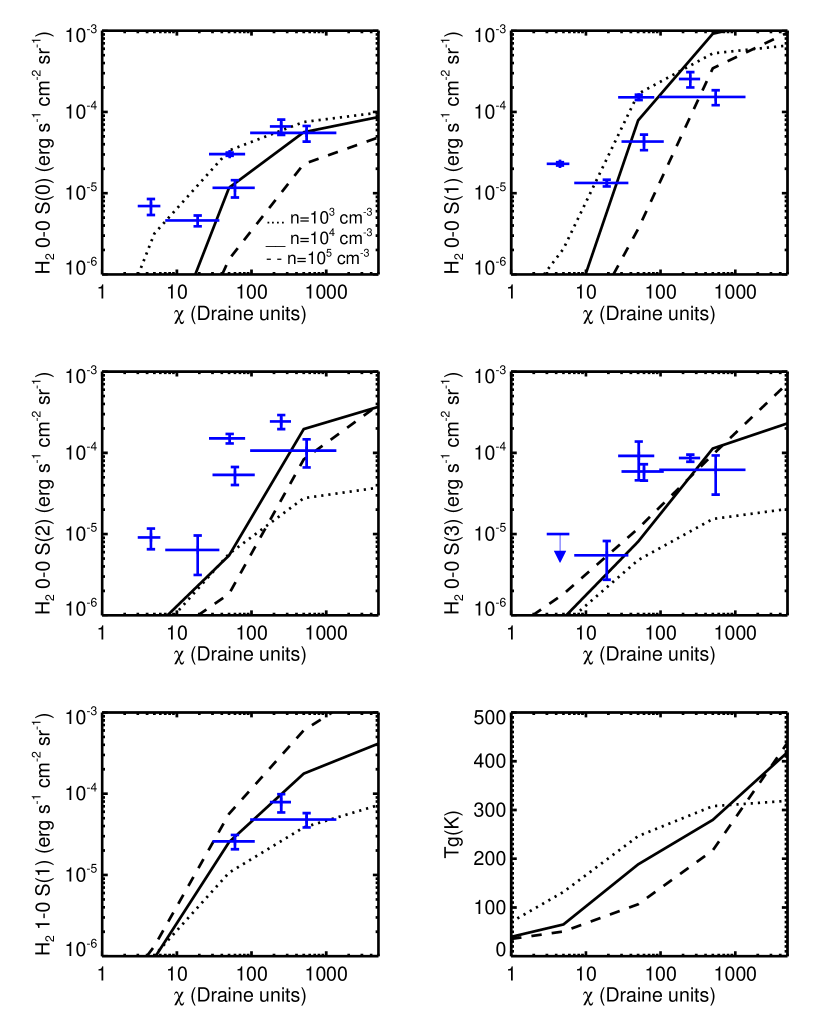
Figure 5 shows the intensity of the rotational lines 0-0 S(0) through S(3), as well as for the ro-vibrational line 1-0 S(1), as observed and as predicted as a function of and for different . Error bars for uncertainties in the FUV field are given. The same viewing angle between the line-of-sight and the normal to the PDR is applied for all the models. Figure 5 also presents the kinetic temperature at the H/H2 photodissociation front (n(H0)=n(H2)) obtained in the grid of models. At the edge of the cloud, the main heating gas process is the photoelectric effect on dust. The FUV photons heat the gas by means of photoelectric emission from grain surfaces and PAHs. As expected, increases with since the heating photoelectric rate . In the model, both the photoelectric effect heating and UV pumping increase with , which implies strong enhance by several orders of magnitude of the H2 rotational and ro-vibrational emission line intensities (see Fig. 5).
Comparing the excitation diagrams as observed and as predicted (Fig. 4), we find that for all the objects - except for the less excited PDR L1721 - the models account for the first low rotational levels (or the 0-0 S(0) and S(1) lines). These low levels probing the bulk of the molecular gas at moderate temperature (80400 K) are in fact reproduced well by the PDR model calculations as shown in the upper panels of the Fig. 5. For the ro-vibrational , level (or the 1-0 S(1) line) probing the UV pumped gas, the model also fits the data well when available. In the Horsehead, rho Oph, and N2023N, the observed 1-0 S(1) line intensity is in fact in good agreement with the PDR model UV pumping predictions (Fig. 4 and lower left panel in Fig. 5). On the other hand, the PDR model underestimates the column densities of the excited rotational levels with (or the 0-0 S(2)-S(3) lines) by large factors (factors 10) in many of our PDRs - L1721, California, N7023E, Horsehead - as shown in Fig. 4 and middle panels of Fig. 5. In the lowest excited L1721 PDR, the discrepancy between model and data starts even from (i.e., the 0-0 S(1) line, see Fig. 4 or upper right panel in Fig. 5). From the intensity of the rotational lines 0-0 S(2) and S(3) as a function of (middle panels of Fig. 5), one can indeed clearly see that the discrepancy between models and observations mostly concern the low/moderate PDRs with . In these low/moderate UV environments, photon heating (by pumping and/or inelastic collisions via photoelectric effect) as described in the model cannot account for the observed H2 excited rotational line intensities. For the higher excited PDRs with (such as rho Oph, N2023N), we find conversely that the model roughly reproduces most of the observed excited rotational H2 lines. However, for N2023N, it is difficult to conclude about the uncertainty on .
The discrepancy between the model and the observations cannot be due to uncertainties on the PDR inclination, since the limb brightening factor 1/cos() can be at most a few only of what we assumed. Furthermore, enhancement geometrical factors would increase all the H2 lines intensities, producing too much emission of the low-J rotational and rovibrational lines and not fitting the H2 line intensity ratios. Considering the error bars for uncertainties in the FUV field shown in Figs. 4 and 5, we also find that the discrepancy between the model and the data cannot come from uncertainties on the strength of the FUV incident radiation field . Similarly, uncertainties on the local gas density cannot be invoked as the predicted intensities for excited rotational lines are comparable for models with cm-3 (see Fig. 5 for ). Density structure changes would also have minor effects, since modeling the H2 excitation mainly depends upon the average gas density in the H2 emission zone. Detailed calculations that take a steep gas density gradient into account as observed from the Horsehead PDR edge from previous complementary data Habart et al. (2005) led in fact to similar results. However, clumpiness that can lead to a substantial reduction of the effective optical depths could increase the portion of hot gas and explain a significant amount of rotationally excited H2.
6 Comparison with H2 observations of the diffuse interstellar medium in the Solar Neighborhood
Early far-UV absorption studies with the Copernicus satellite, as well as far-UV spectroscopic data obtained more recently with FUSE show significant amounts of excited H2 in diffuse clouds Spitzer & Cochran (1973); Spitzer et al. (1974); Spitzer & Morton (1976); Savage et al. (1977); Gry et al. (2002); Browning et al. (2003); Gillmon et al. (2006). In particular, Gry et al. (2002) analyze FUSE H2 spectra over three lines of sight in the Chamaeleon clouds probing gas heated by the mean Solar Neighborhood radiation field. These data, which include the populations of the lowest two =0 and =1 levels, clearly reveal a multi-temperature structure. The levels characterized by an excitation temperature of 200-250 K lie far above the temperature derived from the lowest level transitions with 60 K. Using the Meudon PDR code with and cm-3, Nehmé et al. (2008) find a good fit to a number of observables, including the column density of H2 in the =0 and 1 levels, but their model fails to account for the H2 in levels . The discrepancy between the observed and predicted column densities of these levels is about one order of magnitude, a difference similar to that we report in low-excitation PDRs.
The H2 excitation in PDRs and in the diffuse interstellar medium differ in the power radiated per hydrogen atom. The power radiated from the first rotational levels per nucleon, i.e. (in erg s-1 H-1), where is the intensity of the high rotational lines and the total hydrogen column density of the emission zone, is much stronger in low-excitation PDRs than in diffuse clouds. For the L1721 PDR with erg s-1 cm-2 sr-1 and cm-2 (see Table 2), we find erg s-1 H-1. For the diffuse interstellar medium towards HD 102065, the observed H2 column densities translate into 10-6 erg s-1 cm-2 sr-1, adding emission in the S(1) and S(2) lines. With cm-2, we find erg s-1 H-1. This value is more than one order of magnitude lower than the L1721 value. The difference is even greater for other PDRs in our sample. This result indicates that the energy deposited per hydrogen atom is much higher in PDRs than in diffuse interstellar clouds. This is not surprising since physical conditions in PDRs differ from those in the diffuse interstellar medium. In particular, the gas kinetic energy per nucleon and its dissipation rate could be higher, because PDRs in our sample are all in massive star-forming regions where turbulence may be powered by the mechanical action of luminous stars on their environment. Thus, the mechanical processes proposed to account for the H2 excitation in diffuse interstellar clouds Flower & Pineau Des Forets (1998); Falgarone et al. (2005) could also contribute to the H2 excitation in PDRs, even if the power radiated per H atom in the rotational excited lines is much greater. This possibility is further discussed in Sect. 7.4.
7 Origin of the rotationally excited H2
Our Spitzer results show the presence of significant rotationally excited H2 in the low/moderate excited PDRs that is not predicted by PDR models. The cause of this could be that, in the models, the column density of H2 is too low in the outer zones where H2 is excited or alternatively that a small fraction of the H2 gas is hotter than predicted by models. The effect should be selective by only significantly increasing the intensities of the excited H2 rotational lines (e.g., 0-0 S(2)-S(5)). The intensities of the low rotational lines (e.g., 0-0 S(0)-S(1)) probing the bulk of the molecular H2 gas at moderate temperature, as well as of the rovibrational line (e.g., 1-0 S(1)) probing the UV pumping excitation, should mostly not be affected in order to fit the data. In the following, we examine some of the issues with this in mind.
7.1 H2 formation rate
The H2 line intensities depend mainly on the H2 formation rate since it controls the location of the H/H2 transition zone in PDRs. The line intensities change via the variation in both the gas temperature and the flux pumping H2 in the H/H2 transition zone. Enhanced could result in a strong increase in the intensity of the excited rotational lines. Previous ISO studies of moderately excited PDRs (such as rho Oph, S140, and IC 63) suggest that a high about five times the standard value is required to reproduce the H2 rotational lines Habart et al. (2004). However, we find here that, even if the H2 formation rate is significantly enhanced, the model intensities fall short by an order of magnitude. The same conclusion is reached by Li et al. (2002) using ISO data of the low-excited PDR the S140 periphery regions (with 10-30 and cm-3). This can be understood as follows. In this low/moderately excited PDR regime with low ratios (), H2 self-shields efficiently enough so that the H0/H2 transition zone is closer to the edge ( cm-2), even without an enhanced H2 formation rate. H2 already competes effectively with dust in absorbing FUV photons and the gas temperature in the H0/H2 transition zone is comparable to the PDR edge temperature, so although the H2 line intensities are increased in the high H2 formation case, it does not increase much. We conclude that a global enhancement in the H2 formation rates improves the comparison with observations, but is not sufficient to match the excited rotational lines as observed in our low-excited PDRs.
7.2 Advected H2
Our model results are based on the assumption that the PDR is in equilibrium. In reality, advection of molecular gas from the shielded cloud interior to the warm surface - created by turbulent motions and/or fast progression of the photodissociation front into the cloud - can create relatively high nonequilibrium abundances of H2 in the outer layers. This could produce extra column densities of excited H2. However, as discussed in Störzer & Hollenbach (1998), there is a range of ( with the gas velocity in km/s) for which the effects of advection will have the strongest influence on line intensities compared with equilibrium values. For high , the dissociation timescales are so short that advected H2 will not survive in the outer layers. For very low , the differences between equilibrium and nonequilibrium line intensities are expected to be small, since the H/H2 front is in the equilibrium model near the edge at cm-2, where most of the excited H2 comes from. For our low/moderately excited PDRs with , the condition that advected H2 will survive in the outer layers without being dissociated is verified, even for low velocity. However, the line intensities are expected not to increase significantly, since the H/H2 front is near the edge, even without advection. Out-of-equilibrium PDR model calculations by Störzer & Hollenbach (1998) predict that the integrated H2 line intensities do not vary by more than factors of 3. However, their calculations concern the high-density, high- case, which does not apply here. Moreover, local increase in the H2 lines emissivity at the PDR edge can be important. Further detailed calculations for the low- case would be needed to fully test the non-equilibrium effects.
Another point that one can examine is the OTP ratio expected in the advection case. If there is advection and the dynamical timescale () is much shorter than the OTP equilibrium time (), the OTP ratio must be out-of-equilibrium. Simple calculations of these different timescales for the conditions prevailing in our PDRs333 The advection time can be given as 3 yrs [ (1km/s) / ] [ ( cm-3) / ] with cm-2 the total hydrogen column density in the surface PDR zone. The dominant mechanisms that control the OTP ratio conversion via gas-phase spin exchange reactions are collisions with H atoms and/or protons. The rate coefficient for the proton reaction can be given by cm3 s-1 Gerlich (1990). The rate coefficient for the reactive collisions with H atoms can be given by e cm3 s-1 (e.g., Schofield, 1967). Due to the high activation barrier of the reaction with H atoms (3900 K), the dominant process that controls the OTP ratio conversion is collisions with protons in cool gas ( 100-200 K). Taking the gas temperature profiles as predicted by the equilibrium model, we find that 200 K for PDR with , while 350 K for PDR with . Thus, for low-excited PDRs the proton reaction dominate all the PDR, while for moderatly excited PDRs, the collisions with H atoms are expected to be important at the PDR edge. Within the range of conditions prevailing in our PDRs, we estimate 104-107 yrs for the proton reaction and (3 - )/ yrs for reaction with H atoms. and assuming 1 km/s suggest that for the low excited PDRs (such as L1721 with , 103 cm-3) while for the outer layers of the moderate excited PDRs (such as N7023E, Horsehead with , 104 cm-3). Consequently, the OTP ratio expected in the advection case should be equal to 1 or 3 according to the PDR zone studied. Unfortunately, for many of our PDRs, not enough H2 lines have been measured to do a proper fit of the OTP ratio of the excited rotational levels (see Sect. 3). Nevertheless, for moderately excited PDRs (Horsehead, rho Oph), where several excited H2 rotational lines have been measured, we derive the OTP ratio of about 1 for the =3 to 5 levels while 3 for the =5 to 7 levels. The different OTP findings could result from the fact these rotational levels probe different PDR zones where the OTP conversion is more or less efficient. In either case, we suggest that these findings should not eliminate advection as a solution to extra warm/hot H2. However, more sensitive searches to better constrain the OTP ratio of the excited H2 gas, as well as constraints on the kinematics in the H2 emission zone, are needed for any conclusion.
7.3 Local heating via the photoelectric effect
One alternative solution is to locally increase the gas temperature in the PDR outer zone. At the edge of the cloud, the main heating gas process is the photon heating via photoelectric effect on dust. A local increase in the photoelectric heating rate can have various causes. In particular, there is increasing observational evidence of evolution of the very small dust particles, including PAHs and very small grains (VSGs) in the illuminated parts of the cloud Boulanger et al. (1988, 1990); Bernard et al. (1993); Abergel et al. (2002); Rapacioli et al. (2005); Berné et al. (2007); Compiègne et al. (2008). Increasing the abundance of the smaller grains that dominate the photoelectric effect would lead to higher gas temperatures (e.g., Bakes & Tielens, 1994; Weingartner & Draine, 2001). Previous ISO study of the low-excited PDR L1721 by Habart et al. (2001) shows that abundance variations of small dust grains should be taken into account to reproduce the cooling gas due to fine structure lines ([C+] 158 m and [O0] 63 m). Also, they predict that the H2 lines emission is increased by a factor of 5-10, in line with the present data.
Analysis of the full IRS Spitzer data spectrum obtained in the frame of the SPECPDR program permits us to characterize the small grain population. In particular, Berné et al. (2007) and Compiègne et al. (2008) observed significant variations in the relative emission between PAHs and VSGs in our PDRs sample444N7023E and rho Oph spectra were analyzed by Berné et al. (2007); Horsehead and N2023N spectra by Compiègne et al. (2008). L1721 and California do not present any detected spatial variation within the small field observed with IRS.. Compiègne et al. (2008), who focus on the Horsehedad and N2023N, shows that excitation effects cannot account for these variations and interprets it in term of PAH/VSG relative abundance variations. Berné et al. (2007) extracted the mid-IR spectra of PAH and VSG populations. For N2023N, where spectral evolution is observed, Compiègne et al. (2008) find that the PAH/VSG abundance ratio is 5 times lower in the dense, cold zones of the PDR than in its diffuse illuminated part where dust properties seem to be the same as in cirrus. For the Horsehead, where they did not spatially resolve any spectral variation, they found that this ratio is 2.4 less at the peak emission of the PDR than in Cirrus. However, stronger variations on spatial scales below the available Spitzer resolution cannot be excluded. To quantify this impact, the absolute grain abundance profile of each dust population as a function of depth should be implemented in the PDR model. Towards our PDRs where spectral evolution is observed, more detailed studies of the spatial emission profiles of the dust components, in relation with the H2 lines, are currently in progress Joblin et al. (2011).
7.4 Heating by dissipation of mechanical energy
Here, we consider H2 heating associated with the dissipation of the gas kinetic energy. PDRs in our sample are all located in massive star-forming regions, where the expansion of HII gas, stellar winds and/or supernovae explosions are significant sources of mechanical energy. The energy released in shocks or by the dissipation of turbulence could increase the H2() populations in comparison to PDR model predictions. We find that the MHD shock model of Flower & Pineau Des Forets (1998)555The MHD shock models have been updated, in particular with the new cross sections of collisional excitation of H2 Le Bourlot et al. (1999). fits the excitation well as do as the absolute intensities of the H2 lines observed in the low-excited PDR L1721, for a gas density cm-3 and a shock velocity 15 km/s.
The dissipation rate of turbulence () is often related to the amplitude of turbulent motions (the gas velocity dispersion ) and the size () at which the energy is injected. Quantitatively we have . This estimate quantifies the magnitude of the turbulent gas velocity, which is necessary to account for the H2 S(1) and S(2) line emission in L1721. High spectral resolution observations of H2 ( greater than 20,000 achievable with the CRIRES spectrograph on the VLT) are needed in order to test this possibility. High spectral resolution observations of the C+ far-IR line emission from PDRs, to be performed with the Herschel Space Telescope, will also quantify turbulence in the outer PDR layers where CO is photodissociated.
8 A diffuse contribution to the H2 emission from galaxies
Spitzer spectroscopic observations have provided detections of the H2 rotational lines for many galaxies, in particular a large fraction of galaxies in the SINGS sample Roussel et al. (2007). The H2 emission of star-forming galaxies is tightly correlated with the PAH emission. It is particularly striking that the H2/PAH emission ratio is observed to be independent of the intensity of the dust heating, as measured by the 24 m to far-IR dust emission ratio. Roussel et al. (2007) argue that the H2 and dust emission are powered by a common energy source, the UV light from young stars. The detection of H2 line emission in low-excitation PDRs, such as L1721, supports this interpretation. Low-excitation PDRs, such as L1721, may add up to make a diffuse component that may be a dominant contribution to the H2 and PAH emissions from star-forming galaxies.
Rotationally excited H2 has been detected along Galactic lines of sight away from luminous star forming regions with ISO and Spitzer observations Falgarone et al. (2005); Hewitt et al. (2009). Thus, Galactic observations do indicate the presence of a diffuse component of H2 emission in galaxies. However, it is still unclear whether this emission comes from low-excitation PDRs or if it arises from the diffuse interstellar medium. Like us, Falgarone et al. (2005) used the Meudon code to estimate the contribution of low-excitation PDRs to the observed line emission. They concludes that the S(0) line emission may be accounted for by PDRs but that the model estimates fall short of the observed S(1) and S(2) lines by a large factor (5-10). This discrepancy is similar to the one we faced in modeling our observations of low-excitation PDRs. The absolute line intensities measured along their galactic line of sight are comparable to the intensities measured in our L1721 PDR, but the S(0)/S(1) line intensity ratio is significantly higher in the Galactic lines of sight. Falgarone et al. (2005) concludes that the UV emission cannot be the unique energy source and that much of the H2 line emission must come from the diffuse interstellar medium where H2 may be heated by the localized dissipation of the gas turbulent kinetic energy. This conclusion needs to be revisited in the light of PDR observations, but it is not necessarily contradicted by the correlation between H2 and PAH emissions, since the diffuse interstellar medium is also thought to provide a significant contribution to the PAH emission Draine et al. (2007).
9 Conclusion
Thanks to Spitzer spectroscopic observations, we were able to detect H2 pure rotational lines emission in PDRs with modest FUV fields and densities. The low/moderate regions studied here are very widespread in galaxies and may contain a large fraction of the molecular gas. However, this intermediate regime between the diffuse cloud and the bright PDRs has been poorly studied. To analyze the H2 line emission observations, we used an updated version of the Meudon PDR code. Our results allow strong constraints to be placed upon the H2 excitation in the interstellar medium of galaxies. The main results from this work can be summarized as follows.
The IRS wavelength coverage allows us to detect several strong H2 pure rotational lines from 0-0 S(0) to S(3) at 28.2, 17.03, 12.29, and 9.66 m, the aromatic band features at 6.2, 7.7, 8.6, 11.3 m, the dust mid-IR continuum emission, and the fine structure lines of ionized gas [NeII] at 12.8 m, [SIII] at 18.7 and 33.4 m and [SiII] at 34.9 m. The observed mid-IR spectra are typical of PDRs.
A single temperature cannot describe the full set of observed H2 line intensities. A combination of at least two H2 gas components, with one cool/warm (100-300K) and another warm/hot (300-700K) with much lower column densities (a few percent of the first component) is required. The ortho-to-para ratios derived are about 1 for the first component and about 3 for the second warmer component. The non-equilibrium behavior has already been noted in previous ISO observations of PDRs Moutou et al. (1999); Fuente et al. (1999); Habart et al. (2003).
By comparing the observations with the PDR model predictions, we find that the model can account for the first low H2 rotational line (e.g., 0-0 S(0)-S(1)) probing the bulk of the gas at moderate temperature, as well as the ro-vibrational line (e.g., 1-0 S(1) observed with ground-based telescopes) probing the UV-pumped gas. In contrast, the model underestimates the excited rotational lines (e.g., 0-0 S(2)-S(3)) by large factors (10 in some objects). In the lowest excited PDR, the discrepancy between the model and the data starts even from the rotational level (e.g., 0-0 S(1)). This discrepancy between observations and the PDR model predictions has the same order of magnitude as reported for diffuse interstellar clouds. However, in PDRs the power radiated per H atom in the rotational excited levels is more than one order of magnitude larger than in diffuse clouds.
The discrepancy between the data and the PDR model could indicate that, in the models, the column density of H2 is too low in the outer zones where H2 is excited (by inelastic collisions or UV pumping), or, alternatively, that a small fraction of the H2 gas is hotter than predicted by models. We discuss whether an enhancement in the H2 formation rate, or a local increase in photoelectric heating, as proposed for brighter PDRs in former ISO studies, may also work in low-excitation PDRs. An enhancement in the H2 formation rate improves the comparison with observations, but the models still fall short. Further work is needed to quantify the impact of the evolution of very small dust particles across PDRs on the gas energetics. Out-of-equilibrium processes or mechanical heating (by weak shocks or dissipation of turbulence as proposed for diffuse interstellar clouds) are alternative possibilities.
Although we cannot decide at this point, we emphasize the need for further development of the models. Progress is also expected from PDR spectroscopy of additional cooling lines and data on the gas kinematics, to be obtained from the ground and Herschel. In particular, observations of gas cooling lines of species such as C+ at high spectral resolution with the Heterodyne Instrument for the Far Infrared (HIFI) will provide missing information on the gas velocity within the PDR layer where CO is photodissociated. The combination of these data with models should help constrain the relative radiative and dynamical influence of stars on the physical conditions within PDRs. In the longer term, the Mid-InfraRed Instrument (MIRI) on James Webb Space Telescope (5-28 m, diffraction-limited resolution of 0.2” at 5 m) will provide maps of the H2 rotational line emission, as well as of the small dust emission with unprecedented angular resolution.
Appendix A Map in the H2 rotational emission lines
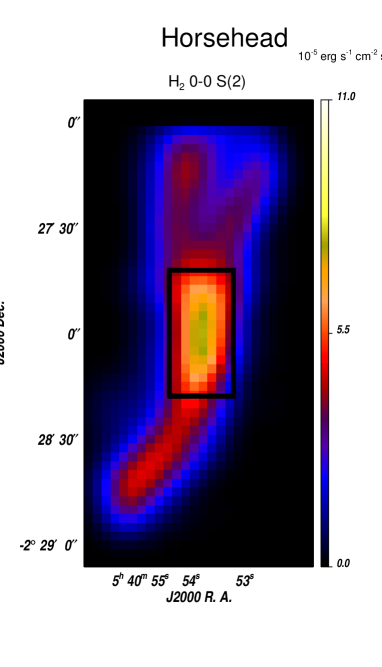
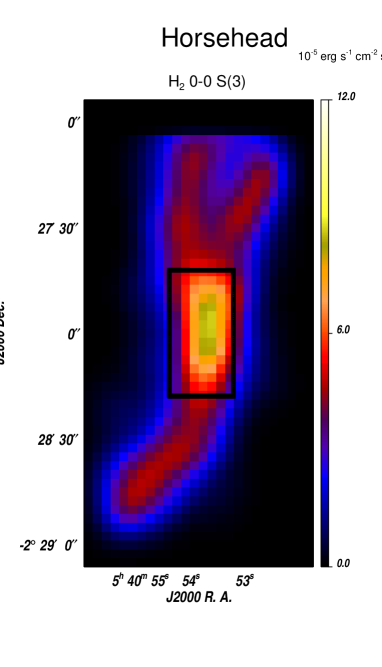
Figure A.1 shows maps in the H2 0-0 S(0) line emission at 28.2 m obtained with the IRS long-low module towards N7023E, the Horsehead, rho Oph, and N2023N. Maps in the H2 0-0 S(1) line emission at 17.03 m are presented in Fig. 3. Figure A.2 shows maps in the H2 0-0 S(2) and S(3) lines emission at 12.29 and 9.66 m obtained with the IRS short-low module towards the Horsehead. Projection onto the same spatial grid (2.5”/pixel) and convolution into the same beam (Gaussian with a full width high maximum of 10.7”) were performed to compare the different line maps obtained. There is a good agreement in the intensity distribution between the H2 lines. The same substructures are present in the maps. The emission in the lowest rotational line 0-0 S(0) is somewhat more extended and peaks more inside the nebula. This is easily to understand since the upper state of this line is relatively low-lying. The signal-to-noise ratio in the 0-0 S(0) line maps is lower than in the other line maps since this line is fainter. Towards the Horsehead, the spatial distribution of the excited 0-0 S(2) and S(3) lines is comparable. The 0-0 S(3) line is slighlty shifted nearer the edge.
References
- Abergel et al. (1999) Abergel, A, Andre, P, Bacmann, A, Bernard, J. P, Bontemps, S, Boulanger, F, Coulais, A, Desert, F. X, Falgarone, E, Kaas, A. A, Huldtgren, M, Miville-Deschenes, M. A, Nordh, L, Olofsson, G, Perault, M, & Puget, J. L. Spatial distribution of dust from cirrus to dense clouds. In The Universe as seen by ISO, page 615, 1999.
- Abergel et al. (2002) Abergel, A, Bernard, J. P, Boulanger, F, Cesarsky, D, Falgarone, E, Jones, A, Miville-Deschenes, M. A, Perault, M, Puget, J. L, Huldtgren, M, Kaas, A. A, Nordh, L, Olofsson, G, André, P, Bontemps, S, Casali, M. M, Cesarsky, C. J, Copet, M. E, Davies, J, Montmerle, T, Persi, P, & Sibille, F. 2002, A&A, 389:239.
- Abergel et al. (2003) Abergel, A, Teyssier, D, Bernard, J. P, Boulanger, F, Coulais, A, Fosse, D, Falgarone, E, Gerin, M, Perault, M, Puget, J. L, Nordh, L, Olofsson, G, Huldtgren, M, Kaas, A. A, AndrÉ, P, Bontemps, S, Casali, M. M, Cesarsky, C. J, Copet, E, Davies, J, Montmerle, T, Persi, P, & Sibille, F. 2003, A&A, 410:577.
- Allen et al. (2004) Allen, R. J, Heaton, H. I, & Kaufman, M. J. 2004, ApJ, 608:314.
- Bakes & Tielens (1994) Bakes, E. L. O & Tielens, A. G. G. M. 1994, ApJ, 427:822.
- Bernard et al. (1993) Bernard, J. P, Boulanger, F, & Puget, J. L. 1993, A&A, 277:609.
- Berné et al. (2007) Berné, O, Joblin, C, Deville, Y, Smith, J. D, Rapacioli, M, Bernard, J. P, Thomas, J, Reach, W, & Abergel, A. 2007, A&A, 469:575.
- Bertoldi (1997) Bertoldi, F. Iso: A novel look at the photodissociated surfaces of molecular clouds (invited paper). In First ISO Workshop on Analytical Spectroscopy, page 67, 1997.
- Boulanger et al. (1988) Boulanger, F, Beichman, C, Desert, F. X, Helou, G, Perault, M, & Ryter, C. 1988, ApJ, 332:328.
- Boulanger et al. (1990) Boulanger, F, Falgarone, E, Puget, J. L, & Helou, G. 1990, ApJ, 364:136.
- Browning et al. (2003) Browning, M. K, Tumlinson, J, & Shull, J. M. 2003, ApJ, 582:810.
- Cazaux & Tielens (2004) Cazaux, S & Tielens, A. G. G. M. 2004, ApJ, 604:222.
- Compiègne et al. (2007) Compiègne, M, Abergel, A, Verstraete, L, Reach, W. T, Habart, E, Smith, J. D, Boulanger, F, & Joblin, C. 2007, A&A, 471:205.
- Compiègne et al. (2008) Compiègne, M, Abergel, A, Verstraete, L, & Habart, E. 2008, A&A, 491:797.
- Draine & Bertoldi (1999) Draine, B & Bertoldi, F. Theoretical models of photodissociation fronts. In H2 in Space, page 131, 1999.
- Draine & Lee (1984) Draine, B. T & Lee, H. M. 1984, ApJ, 285:89.
- Draine et al. (2007) Draine, B. T, Dale, D. A, Bendo, G, Gordon, K. D, Smith, J. D. T, Armus, L, Engelbracht, C. W, Helou, G, jr Kennicutt, R. C, Li, A, Roussel, H, Walter, F, Calzetti, D, Moustakas, J, Murphy, E. J, Rieke, G. H, Bot, C, Hollenbach, D. J, Sheth, K, & Teplitz, H. I. 2007, ApJ, 663:866.
- Draine (1978) Draine, B. T. 1978, Astrophysical Journal Supplement Series, 36:595.
- Duley & Williams (1984) Duley, W. W & Williams, D. A. Interstellar chemistry. In Interstellar Chemistry, 1984.
- Falgarone et al. (2005) Falgarone, E, Verstraete, L, Pineau Des Forêts, G, & Hily-Blant, P. 2005, A&A, 433:997.
- Field et al. (1998) Field, D, Lemaire, J. L, Pineau Des Forêts, G, Gerin, M, Leach, S, Rostas, F, & Rouan, D. 1998, A&A, 333:280.
- Fitzpatrick & Massa (1990) Fitzpatrick, E. L & Massa, D. 1990, Astrophysical Journal Supplement Series, 72:163.
- Flower & Pineau Des Forets (1998) Flower, D. R & Pineau Des Forets, G. 1998, MNRAS, 297:1182.
- Fuente et al. (1999) Fuente, A, Martin-Pintado, J, & Rodriguez-Fernandez, N. 1999, ApJ, 518:L45.
- Gerlich (1990) Gerlich, D. 1990, Journal of Chemical Physics, 92:2377.
- Gillmon et al. (2006) Gillmon, K, Shull, J. M, Danforth, C, & Tumlinson, J. 2006, ASPC, page 439.
- Goicoechea et al. (2006) Goicoechea, J. R, Pety, J, Gerin, M, Teyssier, D, Roueff, E, Hily-Blant, P, & Baek, S. 2006, A&A, 456:565.
- Gould & Salpeter (1963) Gould, R. J & Salpeter, E. E. 1963, ApJ, 138:393.
- Gry et al. (2002) Gry, C, Boulanger, F, Nehmé, C, Pineau Des Forêts, G, Habart, E, & Falgarone, E. 2002, A&A, 391:675.
- Habart et al. (2001) Habart, E, Verstraete, L, Boulanger, F, Pineau Des Forêts, G, Le Peintre, F, & Bernard, J. P. 2001, A&A, 373:702.
- Habart et al. (2003) Habart, E, Boulanger, F, Verstraete, L, Pineau Des Forêts, G, Falgarone, E, & Abergel, A. 2003, A&A, 397:623.
- Habart et al. (2004) Habart, E, Natta, A, & Krügel, E. 2004, A&A, 427:179.
- Habart et al. (2005) Habart, E, Abergel, A, Walmsley, C. M, Teyssier, D, & Pety, J. 2005, A&A, 437:177.
- Hewitt et al. (2009) Hewitt, J. W, Rho, J, Andersen, M, & Reach, W. T. 2009, ApJ, 694:1266.
- Hollenbach & Salpeter (1971) Hollenbach, D & Salpeter, E. E. 1971, ApJ, 163:155.
- Hollenbach & Tielens (1999) Hollenbach, D. J & Tielens, A. G. G. M. 1999, Reviews of Modern Physics, 71:173.
- Hoogerwerf et al. (2000) Hoogerwerf, R, De Bruijne, J. H. J, & De Zeeuw, P. T. 2000, ApJ, 544:L133.
- Joblin et al. (2005) Joblin, C, Abergel, A, Bernard, J. P, Berne, O, Boulanger, F, Cernicharo, J, Compiègne, M, Deville, Y, Gerin, M, Goicoechea, J, Habart, E, Le Bourlot, J, Maillard, J. P, Rapacioli, M, Reach, W, Simon, A, Smith, J. D, Teyssier, D, & Verstraete, L. 2005, IAU Symposium, 231:153.
- Joblin et al. (2011) Joblin et al. 2011, in preparation.
- Jura (1975) Jura, M. 1975, ApJ, 197:575.
- Kaufman et al. (2006) Kaufman, M. J, Wolfire, M. G, & Hollenbach, D. J. 2006, ApJ, 644:283.
- Kemper et al. (1999) Kemper, C, Spaans, M, Jansen, D. J, Hogerheijde, M. R, van Dishoeck, E. F, & Tielens, A. G. G. M. 1999, ApJ, 515:649.
- Laor & Draine (1993) Laor, A & Draine, B. T. 1993, ApJ, 402:441.
- Le Bourlot et al. (1999) Le Bourlot, J, Pineau des Forêts, G, & Flower, D. R. 1999, MNRAS, 305:L802.
- Le Petit et al. (2006) Le Petit, F, Nehmé, C, Le Bourlot, J, & Roueff, E. 2006, Astrophysical Journal Supplement Series, 164:506.
- Li et al. (2002) Li, W, Evans, N. J. I, Jaffe, D. T, van Dishoeck, E. F, & Thi, W. F. 2002, ApJ, 568:242.
- Lynds (1962) Lynds, B. T. 1962, Astrophysical Journal Supplement Series, 7:L1.
- Meyer et al. (1997) Meyer, M. R, Calvet, N, & Hillenbrand, L. A. 1997, AJ, 114:288.
- Meyer et al. (1998) Meyer, D. M, Jura, M, & Cardelli, J. A. 1998, ApJ, 493:222.
- Motte et al. (1998) Motte, F, Andre, P, & Neri, R. 1998, A&A, 336:150.
- Moutou et al. (1999) Moutou, C, Verstraete, L, Sellgren, K, & Léger, A. The rich spectroscopy of reflection nebulae. In The Universe as Seen by ISO, page 727, 1999.
- Nehmé et al. (2008) Nehmé, C, Le Bourlot, J, Boulanger, F, Pineau Des Forêts, G, & Gry, C. 2008, A&A, 483:485.
- Perryman et al. (1997) Perryman, M. A. C, Lindegren, L, Kovalevsky, J, Hoeg, E, Bastian, U, Bernacca, P. L, Créz, M, Donati, F, Grenon, M, Van Leeuwen, F, Van Der Marel, H, Mignard, F, Murray, C. A, Le Poole, R. S, Schrijver, H, Turon, C, Arenou, F, FroeschlÉ, M, & Petersen, C. S. 1997, A&A, 323:L49.
- Pety et al. (2004) Pety, J, Teyssier, D, Fosse, D, Gerin, M, Roueff, E, Abergel, A, & Habart, E. 2004, A&A, in press.
- Pety et al. (2005) Pety, J, Teyssier, D, Fossé, D, Gerin, M, Roueff, E, Abergel, A, Habart, E, & Cernicharo, J. 2005, A&A, 435:885.
- Pety et al. (2007) Pety, J, Goicoechea, J. R, Hily-Blant, P, Gerin, M, & Teyssier, D. 2007, A&A, 464:L41.
- Philipp et al. (2006) Philipp, S. D, Lis, D. C, Gusten, R, Kasemann, C, Klein, T, & Phillips, T. G. 2006, A&A, 454:213.
- Pound et al. (2003) Pound, M. W, Reipurth, B, & Bally, J. 2003, AJ, 125:2108.
- Rapacioli et al. (2005) Rapacioli, M, Joblin, C, & Boissel, P. 2005, A&A, 429:193.
- Rapacioli et al. (2006) Rapacioli, M, Calvo, F, Joblin, C, Parneix, P, Toublanc, D, & Spiegelman, F. 2006, A&A, 460:519.
- Roussel et al. (2007) Roussel, H, Helou, G, Hollenbach, D. J, Draine, B. T, Smith, J. D, Armus, L, Schinnerer, E, Walter, F, Engelbracht, C. W, Thornley, M. D, Kennicutt, R. C, Calzetti, D, Dale, D. A, Murphy, E. J, & Bot, C. 2007, ApJ, 669:959.
- Savage & Sembach (1996) Savage, B. D & Sembach, K. R. 1996, ARA&A, 34:279.
- Savage et al. (1977) Savage, B. D, Bohlin, R. C, Drake, J. F, & Budich, W. 1977, ApJ, 216:291.
- Schofield (1967) Schofield, K. 1967, Pl. & Spa. Sc., 643:15.
- Shaw et al. (2005) Shaw, G, Ferland, G. J, Abel, N. P, Stancil, P. C, & van Hoof, P. A. M. 2005, ApJ, 624:794.
- Spitzer & Cochran (1973) Spitzer, L & Cochran, W. D. 1973, ApJ, 186:L23.
- Spitzer & Morton (1976) Spitzer, L & Morton, W. A. 1976, ApJ, 204:731.
- Spitzer et al. (1974) Spitzer, L, Cochran, W. D, & Hirshfeld, A. 1974, Astrophysical Journal Supplement Series, 28:373.
- Störzer & Hollenbach (1998) Störzer, H & Hollenbach, D. 1998, ApJ, 495:853.
- Teyssier et al. (2004) Teyssier, D, FossÈ, D, Gerin, M, Pety, J, Abergel, A, & Roueff, E. 2004, A&A, 417:135.
- Thi et al. (1999) Thi, W. F, van Dishoeck, E. F, Black, J. H, Jansen, D. J, Evans, N. J, & Jaffe, D. T. Weak molecular hydrogen emission from diffuse and translucent clouds. In The Universe as Seen by ISO, page 529, 1999.
- Walmsley et al. (2000) Walmsley, C. M, Natta, A, Oliva, E, & Testi, L. 2000, A&A, 364:301.
- Ward-Thompson et al. (2006) Ward-Thompson, D, Nutter, D, Bontemps, S, Whitworth, A, & Attwood, R. 2006, MNRAS, 369:1201.
- Weingartner & Draine (2001) Weingartner, J. C & Draine, B. T. 2001, Astrophysical Journal Supplement Series, 134:263.