Rescaling citations of publications in Physics
Abstract
We analyze the citation distributions of all papers published in Physical Review journals between and . The average number of citations received by papers published in a given year and in a given field is computed. Large variations are found, showing that it is not fair to compare citation numbers across fields and years. However, when a rescaling procedure by the average is used, it is possible to compare impartially articles across years and fields. We make the rescaling factors available, for use by the readers. We also show that rescaling citation numbers by the number of publication authors has strong effects and should therefore be taken into account when assessing the bibliometric performance of researchers.
pacs:
01.30.-y, 01.40.G-, 01.78.+pI Introduction
Despite its many shortcomings, citation analysis is increasingly used as a quantitative tool to evaluate research performance, ranging from the single publication up to the level of individual researchers, groups, departments, institutions and countries price65 ; egghe90 ; moed05 ; hirsch05 ; bar08 ; stringer08 ; petersen10 ; stringer10 . The underlying idea is that the number of citations measures the impact of a publication and it is thus a proxy for the quality and importance of the scientific work described in it. This assumption is highly questionable and the empirical evidence revealing striking counterexamples to its general validity is substantial macroberts96 ; adler08 ; bornmann08 . In principle, a careful, unbiased review by peers with no conflict of interest would be a better procedure to evaluate research quality and impact (although many distortions can occur also in this case bornmann11 ). Nevertheless, for several reasons that go much beyond the scope of this work and will not be discussed here, the use of quantitative bibliometric measures is not going to diminish in the future. It is much more realistic and effective trying to correct the inadequacies of how citation analysis is performed, rather than self-deceptively hope that citation analysis will lose importance in the future lane10 .
In this paper, we tackle two of the more obvious problems in the use of the number of citations to measure the impact of scientific publications: 1) papers in some fields are typically more cited than papers in other fields; 2) old papers naturally tend to have more citations than more recent ones. These facts are part of the common wisdom of people working in science, yet it is common to see comparisons between the number of cites of papers dealing with completely different topics or published in different decades. However, as we will show, one should not take for granted that a paper which has been cited twice as much as another in a different field has actually had a larger impact. The most natural way to get rid of (or at least alleviate) these problems is the use of relative indicators, i.e. the normalization of the number of citations by some average over a suitable reference set. The use of relative indicators has been proposed long ago schubert86 and used in various contexts, but often in questionable ways leydesdorff10 ; waltman10 and without an empirical check that it actually solves the problem. Recently we have shown that such a normalization strongly reduces biases when papers from entirely different disciplines, spanning all fields of science, are compared radicchi08 ; castellano09 . Here we present a similar analysis applied to publications of the American Physical Society (APS).
| PACS | Description |
|---|---|
| General | |
| The Physics of Elementary Particles and Fields | |
| Nuclear Physics | |
| Atomic and Molecular Physics | |
| Electromagnetism, Optics, Acoustics, Heat Transfer, Classical Mechanics, and Fluid Dynamics | |
| Physics of Gases, Plasmas, and Electric Discharges | |
| Condensed Matter: Structural, Mechanical and Thermal Properties | |
| Condensed Matter: Electronic Structure, Electrical, Magnetic, and Optical Properties | |
| Interdisciplinary Physics and Related Areas of Science and Technology | |
| Geophysics, Astronomy, and Astrophysics |
With respect to Ref. radicchi08 ; castellano09 we consider a more fine-grained level of categorization, since the different groups we deal with are all within the realm of Physics. Fields are identified using the PACS (Physics and Astronomy Classification Scheme PACS ) number scheme. We show first that relevant differences in citation patterns show up among different fields. The average number of citations in some field can be up to three times larger than for papers in another field. Analogously, we show that papers published in are cited in some fields even 15 times more than papers published in . We then show that introducing a suitable relative indicator, the distributions of such indicator become essentially independent from the field or the year of publication, so that the relative indicator can be used as an unbiased measure of impact. We corroborate these results by showing that ranking papers based on the raw number of citations leads to large biases in favor of some PACS codes, while ranking using the relative indicator allows a fair comparison among different fields. We make available, for reference, a table with the average number of citations for each category and each publication year since 1985. We finally present further evidence of the relevance of the rescaling procedure by considering all authors who published in APS journals between and . There is of course a correlation between the number of raw citations of an author and its/her relative indicator, but large deviations are possible. The problem is even more remarkable when the relative indicator includes a rescaling with the number of authors of each paper, so that the number of citations of a paper are equally split among all co-authors. This highlights that rescaling cites with the number of authors is a crucial issue in citation analysis.
II Data sets

We consider all papers published in journals of the American Physical Society (APS, www.aps.org) from to . We restrict our analysis only to standard research publications (Letters, Rapid communications, Brief Reports and Regular Articles) and exclude other type of published material (Editorials, Reviews, Comments, Replies and Errata) which may show distinct citation patterns. The journals considered in our analysis are: Physical Review Letters, Physical Review A, Physical Review B, Physical Review C, Physical Review D and Physical Review E. APS journals represent the most important publication outlets in Physics and cover all sub-fields of this discipline. They therefore represent an optimal benchmark for the study of citation patterns of publications within Physics redner05 . The first year of the temporal range considered has been selected because in the PACS coding started to be systematically used. We consider only papers classified according to the PACS codes, which are the vast majority ( between and ) of all papers published in APS journals. PACS numbers are attributed to papers by authors themselves. This guarantees an optimal classification into fields, overcoming the nontrivial problem of attributing, a posteriori, papers to fields leydesdorff10 ; boyack05 . PACS codes are composed of three fields , where the first two are numerical (two digits each) and the third is alphanumerical. For our purpose we consider only the first digit of the code, which provides a classification into very broad categories (see Table 1). Hence, for example, two papers with PACS codes and both belong to the category , while a paper with PACS number is part of the category . In general, authors assign to a paper two or three PACS numbers. In our analysis we classify papers only according to their principal PACS number. For each paper the number of cites is obtained from the WebOfScience (WOS, www.isiknowledge.com) database, hence including also citations from all other non-APS publications included in the WOS database. The data collection was performed on Dec. , . In our analysis we consider only papers which have received at least one citation until the above mentioned date.
III The relevance of the problem. Mean values and distributions
In Fig. 1 we report, for each category, the number of citations received on average by each paper as a function of the publication year. It turns out that there are quite large differences in the values of depending both on the category considered and on the year. In particular, articles published in the same year in a given field can be cited on average up to three times more than in another field (e.g. PACS vs PACS in ). The average number of citations received tends to grow as older publications are considered, with rather limited fluctuations, with the notable exception of the very high peak visible in for PACS , due to the extraordinary popularity (more than citations so far) of a single article verypopular . In general, it is possible to see that the differences between the s of papers published under the same PACS number but in different years can be very large: for PACS for example, for articles published in but only for publications of .
These data indicate that, although the variations are less pronounced with respect to cross-discipline comparisons radicchi08 ; castellano09 , there are important caveats when trying to compare the number of citations accrued by articles published in APS journals with different PACS codes or publication years.
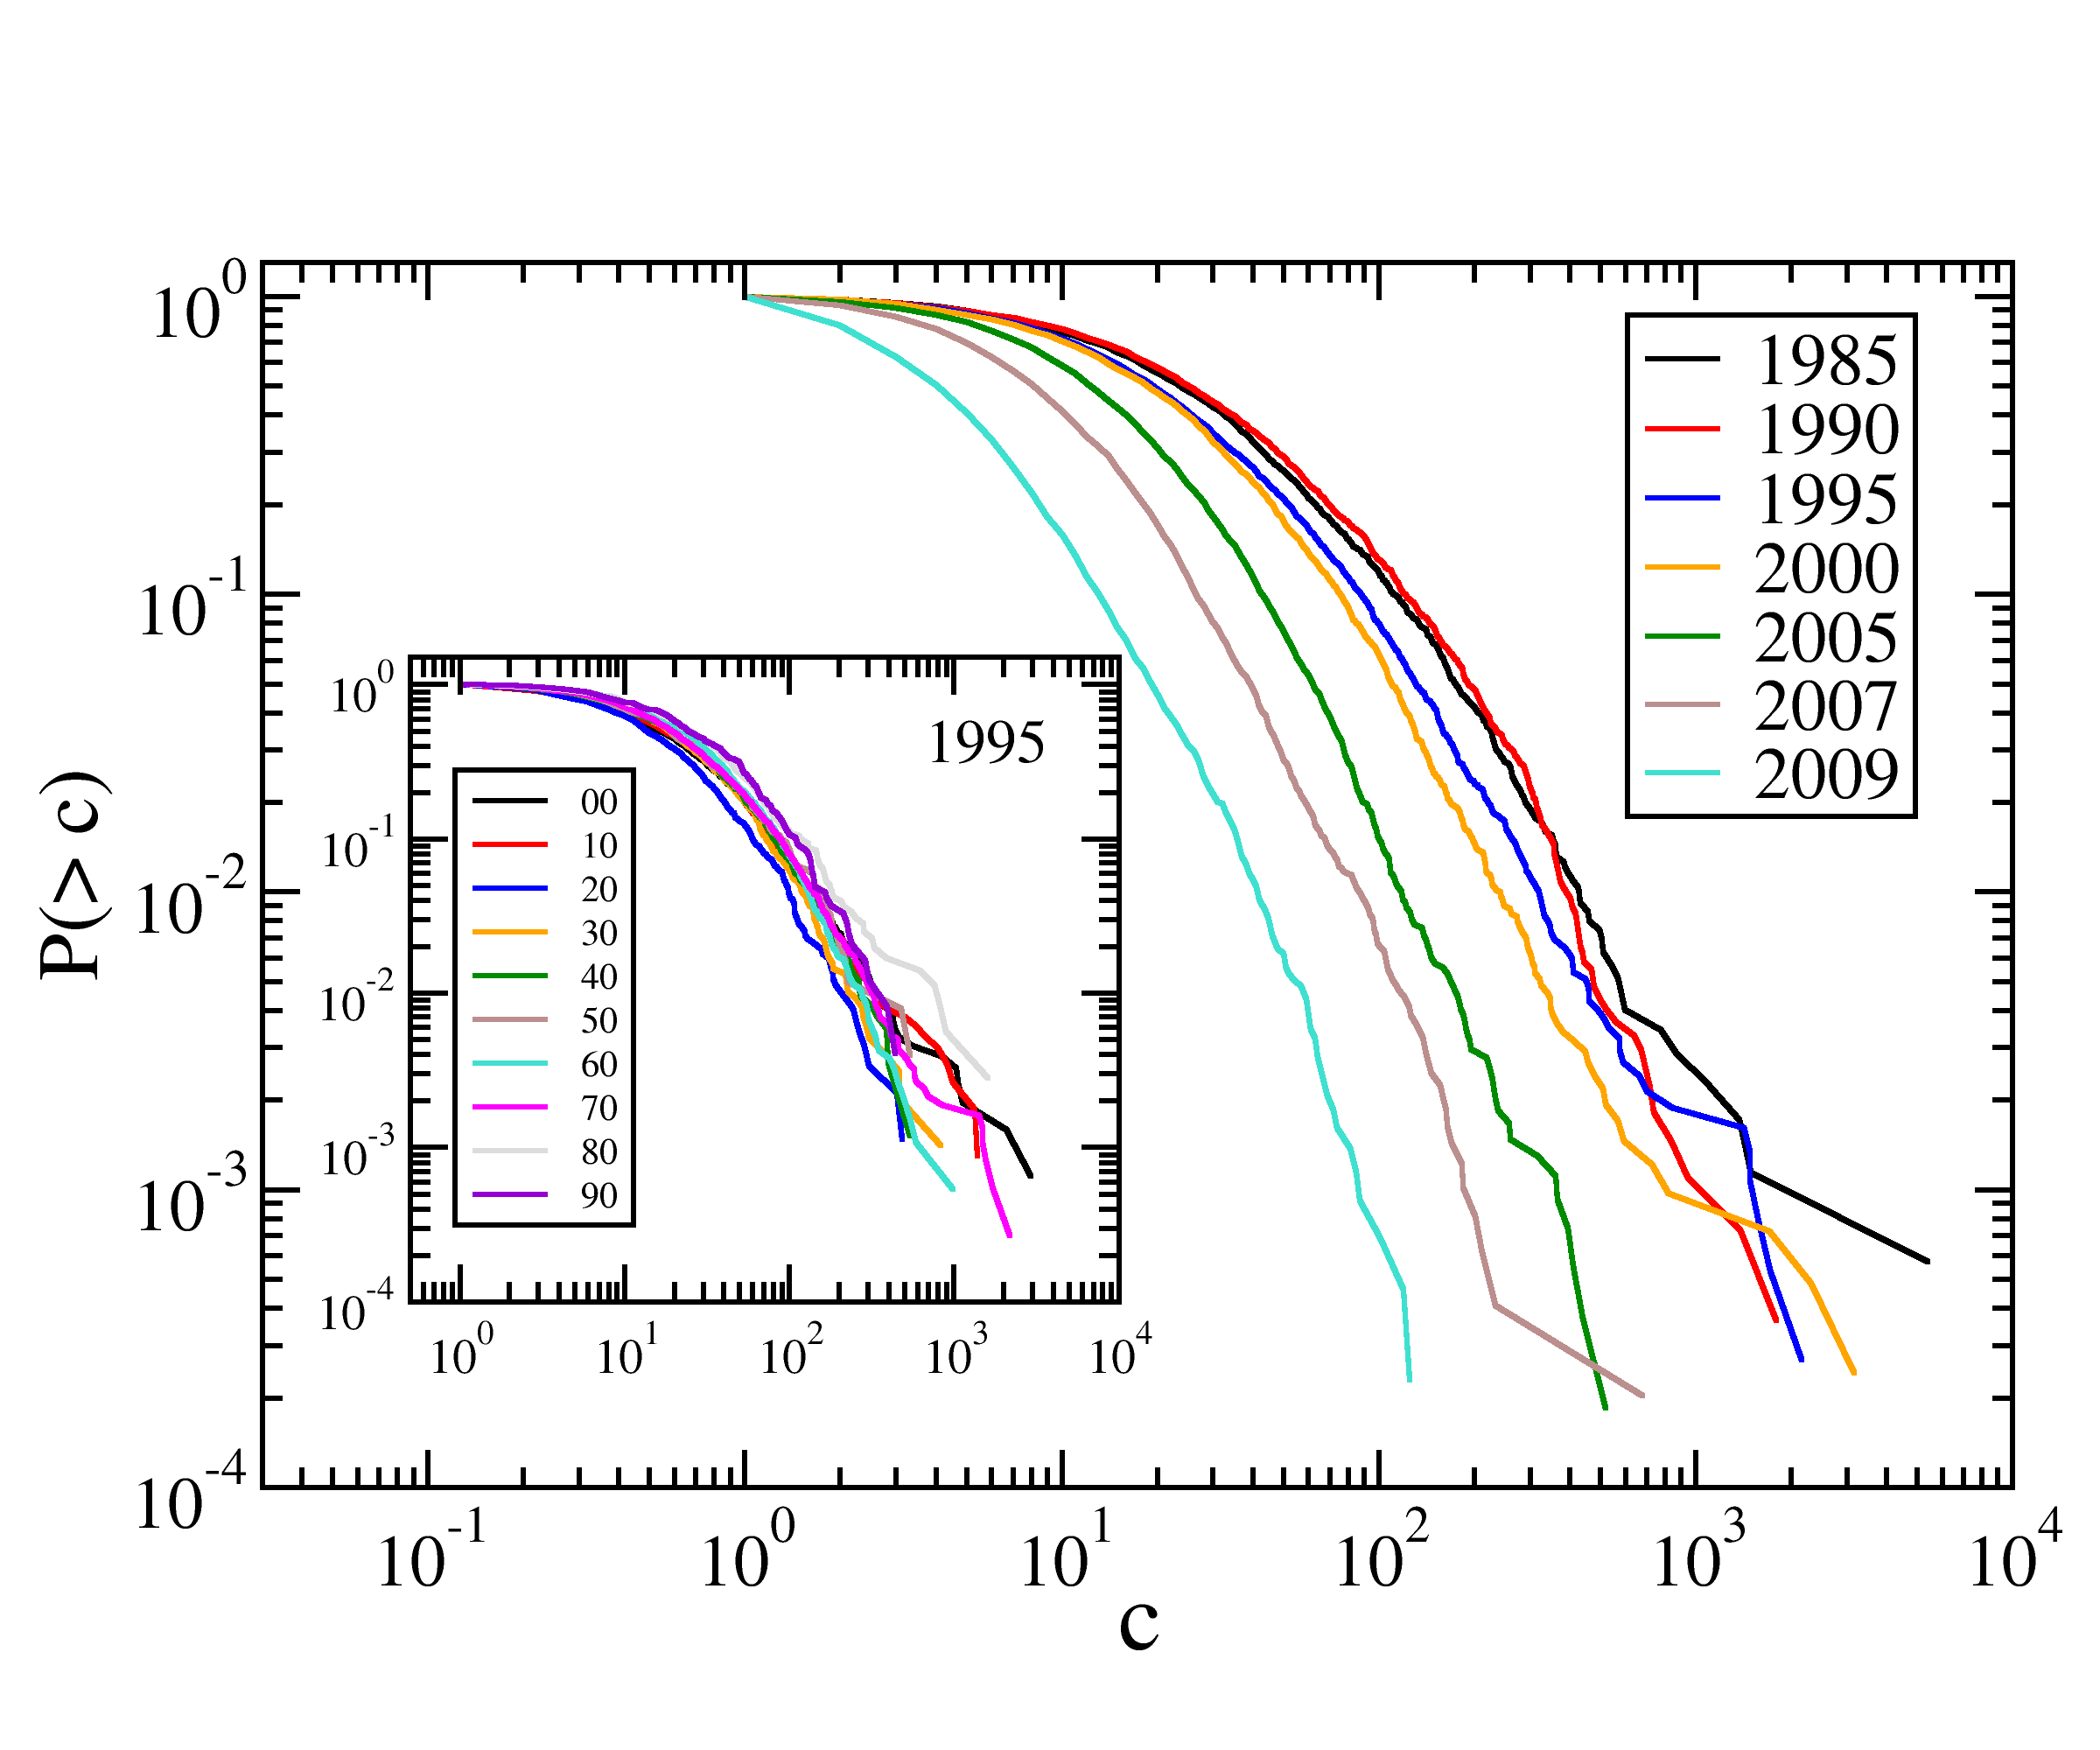
The same problem is found when one does compare not only the average values but the full distributions. For example, in Fig. 2 we plot the cumulative distribution functions (cdf) of the number of citations for articles in the category for various publication years. It is evident that over the years the distributions change considerably. For instance, more than citations is not an uncommon result for a paper published in , while it is an extraordinary achievement for one published in . Similarly, citation distributions are incompatible also when one considers the same publication year but different PACS categories, as shown in the inset of Fig. 2 for year .
IV Relative citation rates and unbiased ranking
The most natural solution to the problem pointed out in the previous section is the use of relative citation numbers. Let us define the ratio
| (1) |
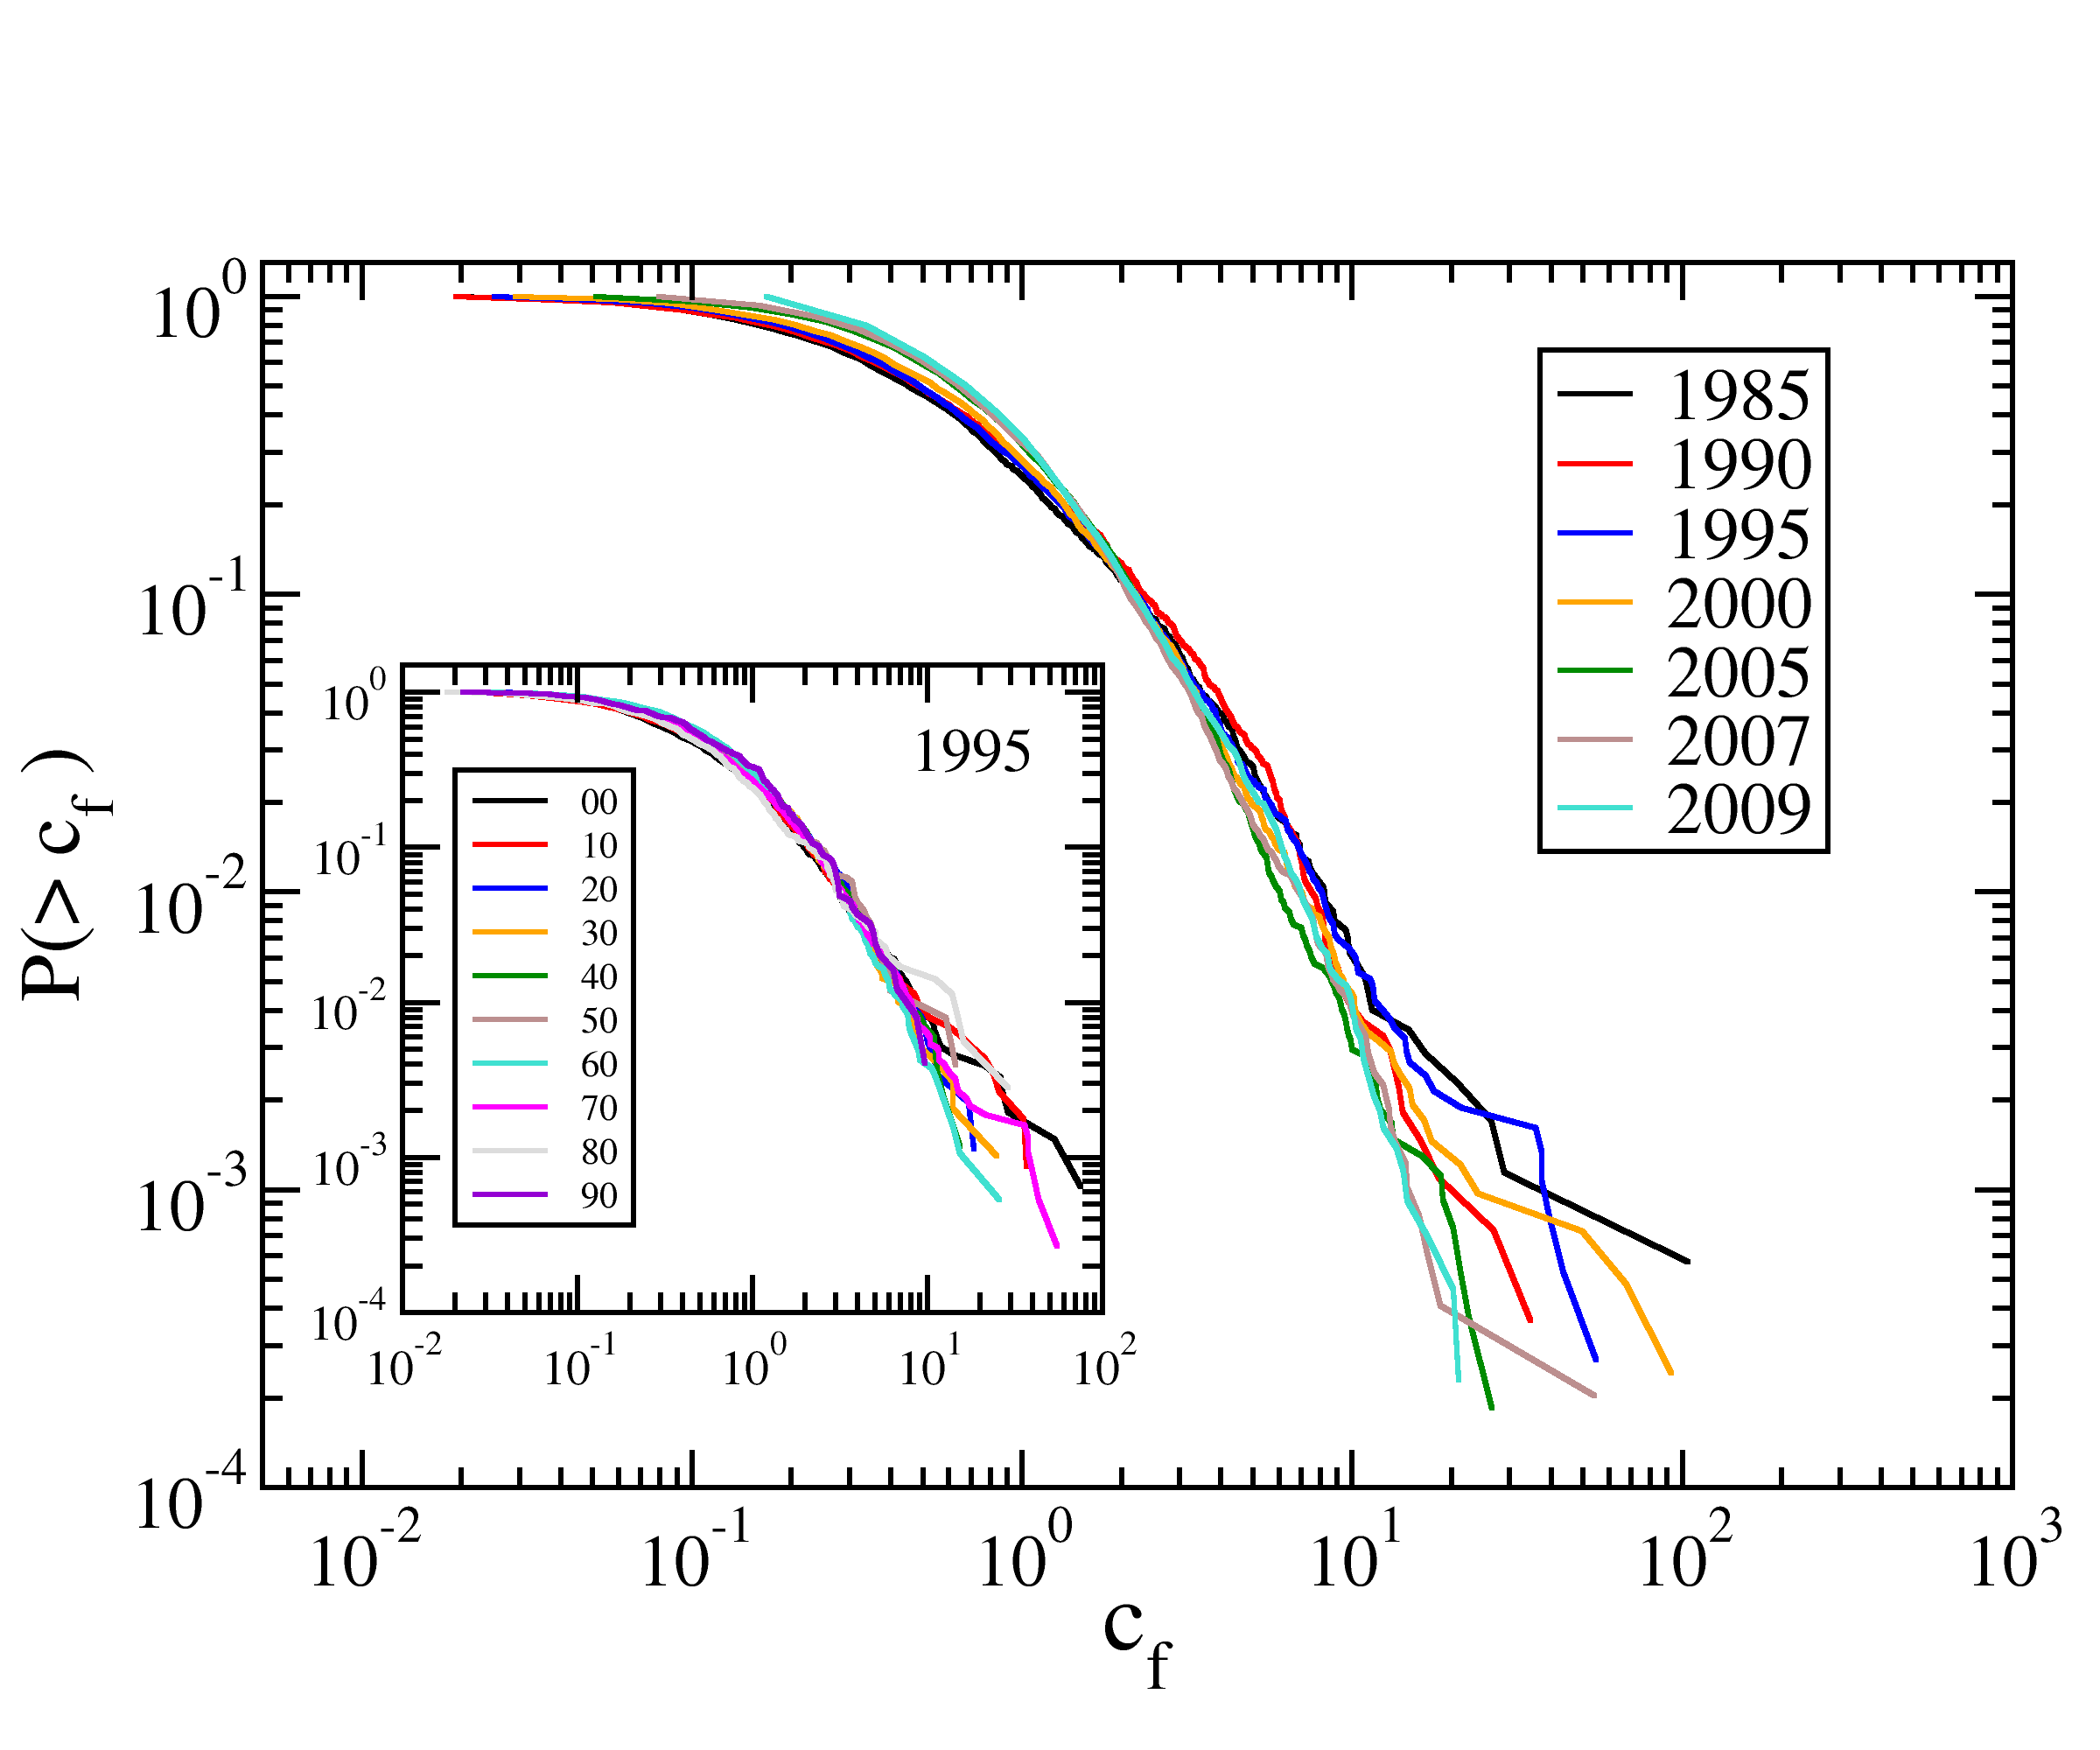
This quantity measures the success of a paper, in terms of citations received, compared with other papers in the same category and year. A value indicates that the paper has been cited more (less) than the average. By definition the average value of is 1, for any category or year, but this is not enough to have a useful unbiased indicator. We need the full distributions to be the same, so that the probability of having any value of is the same, no matter the category or the year. In Fig. 3 we show the distributions of relative citation numbers for the same data of Fig. 2. The comparison between the two figures reveals that the normalization procedure rescales very well all distributions on top of each other, thus allowing a fair comparison among publications in different fields and/or years. Some variation shows up only for recent publication years () for which citation patterns are generally far from stationary stringer08 . But also in these cases the difference with respect to the asymptotic shape of the scaled distribution is small. The scaling procedure is able to remove the bias almost completely also for papers published one year ago.
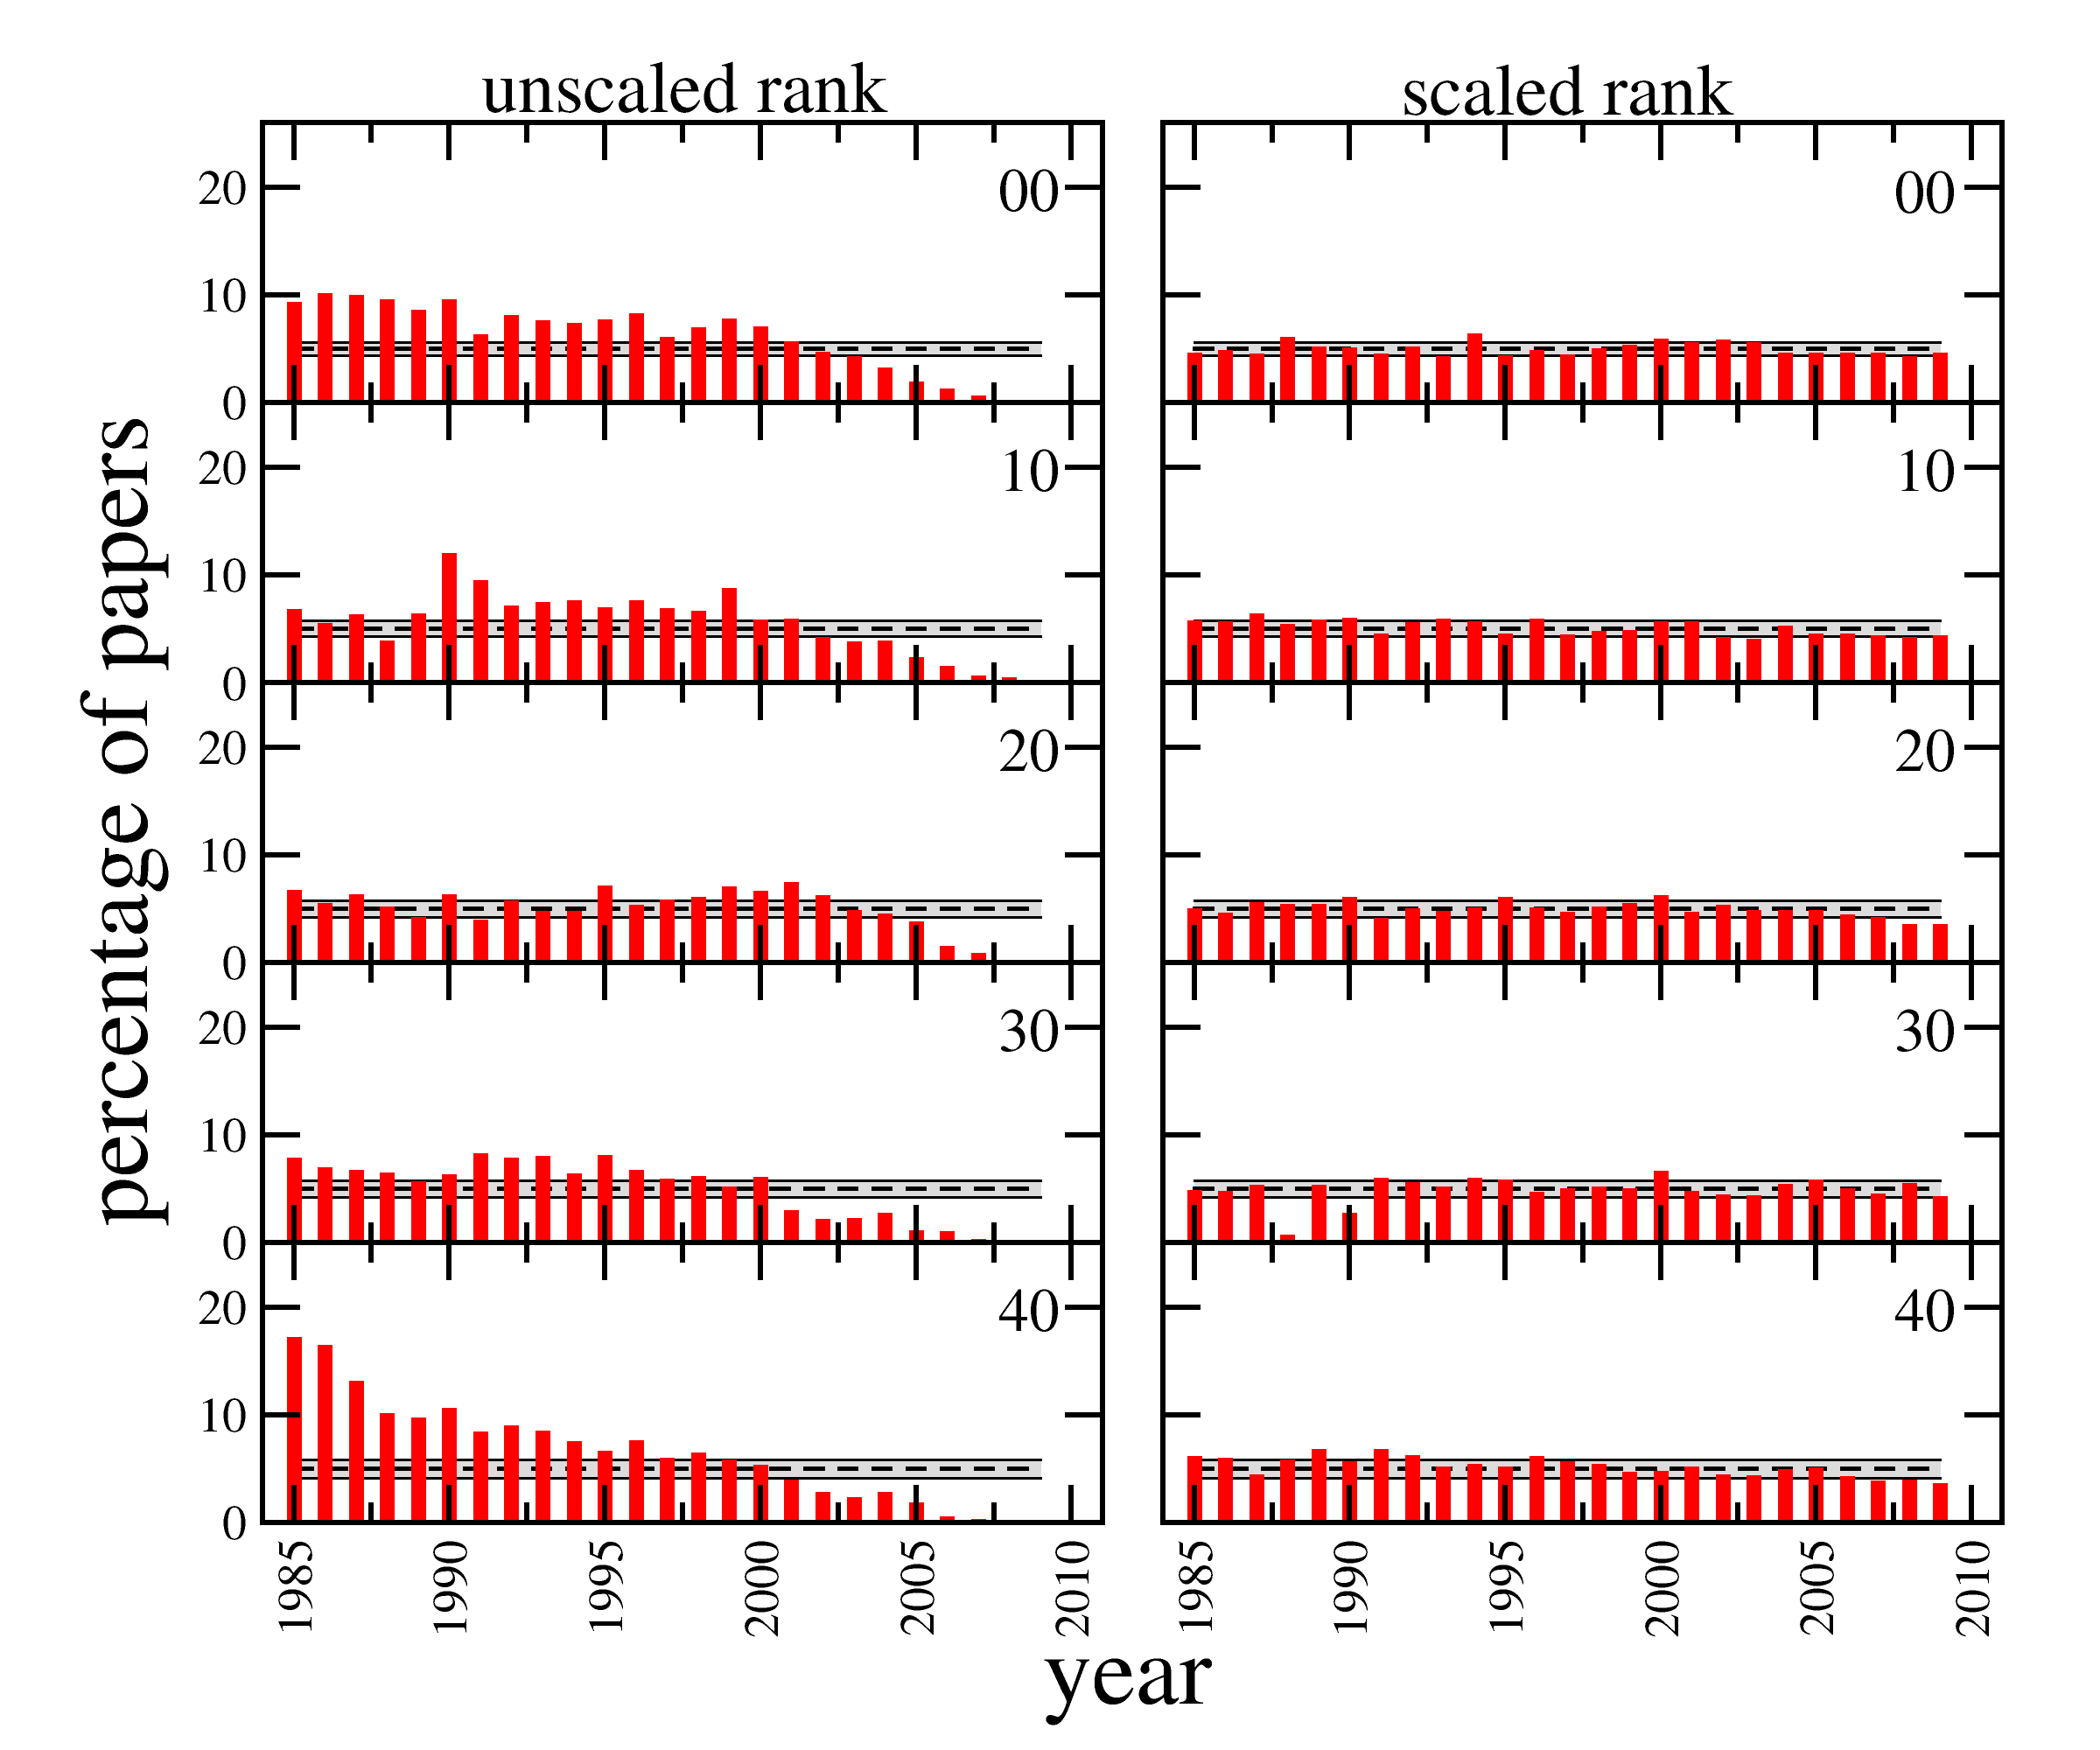

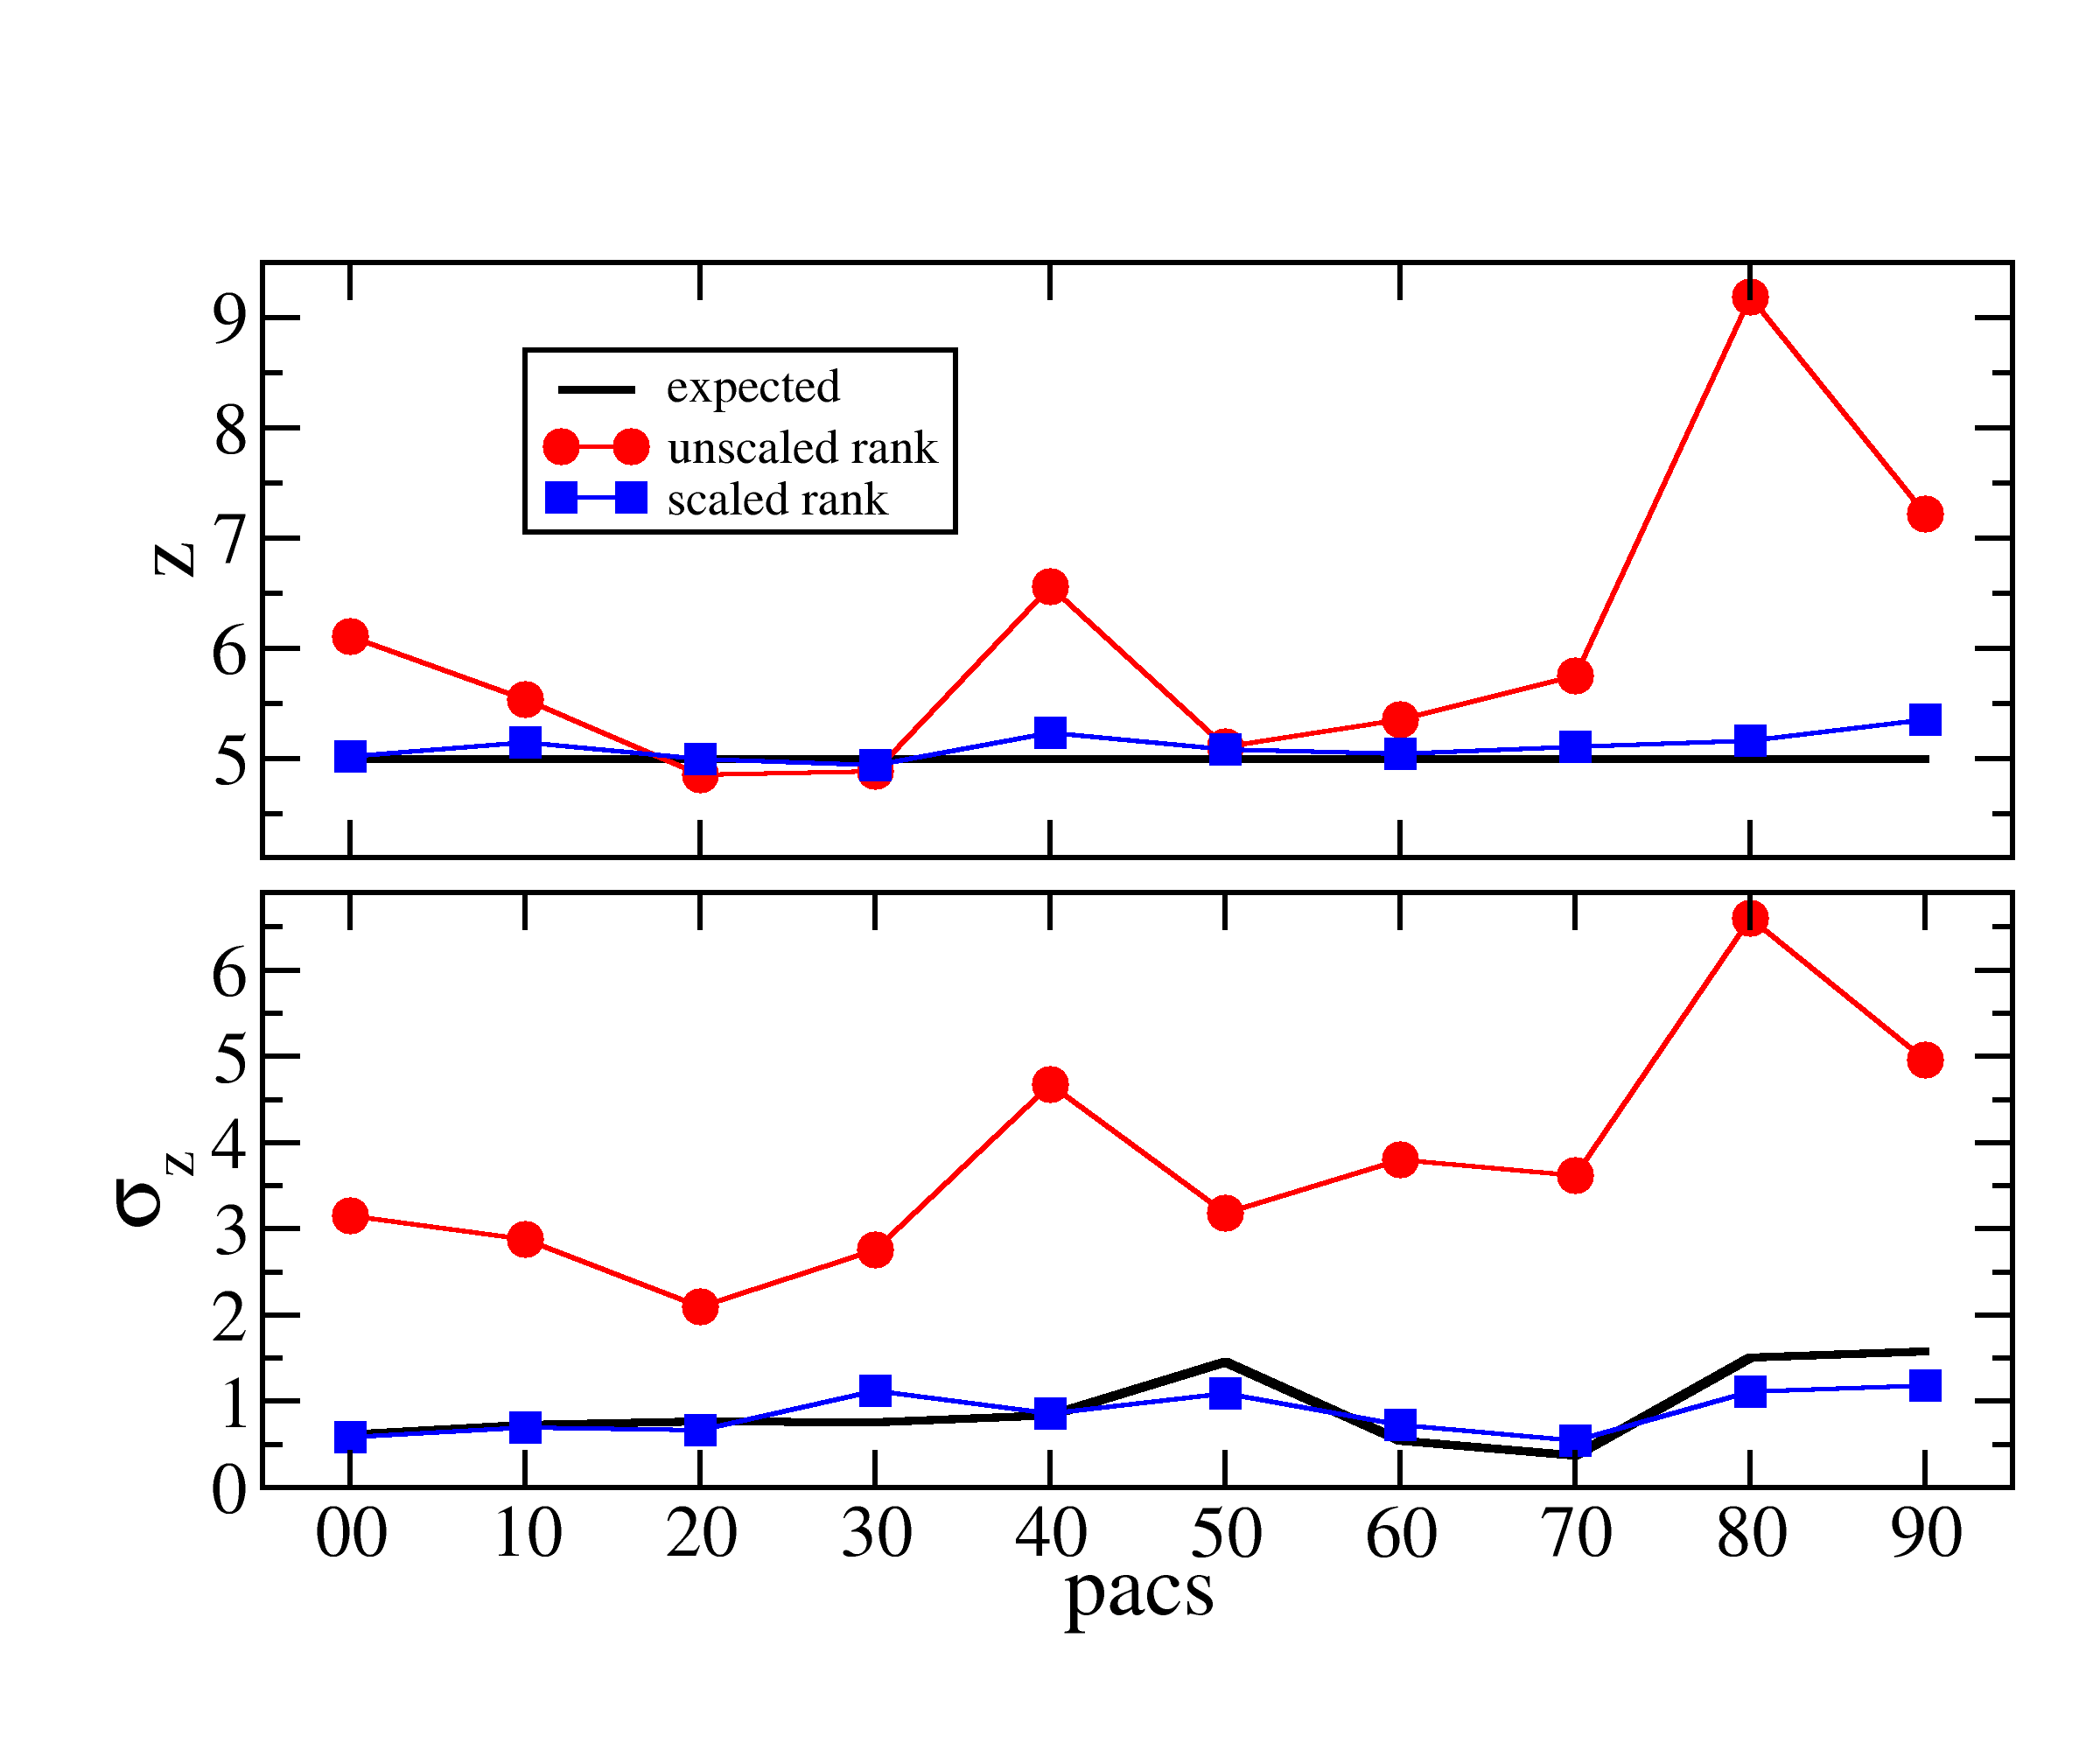
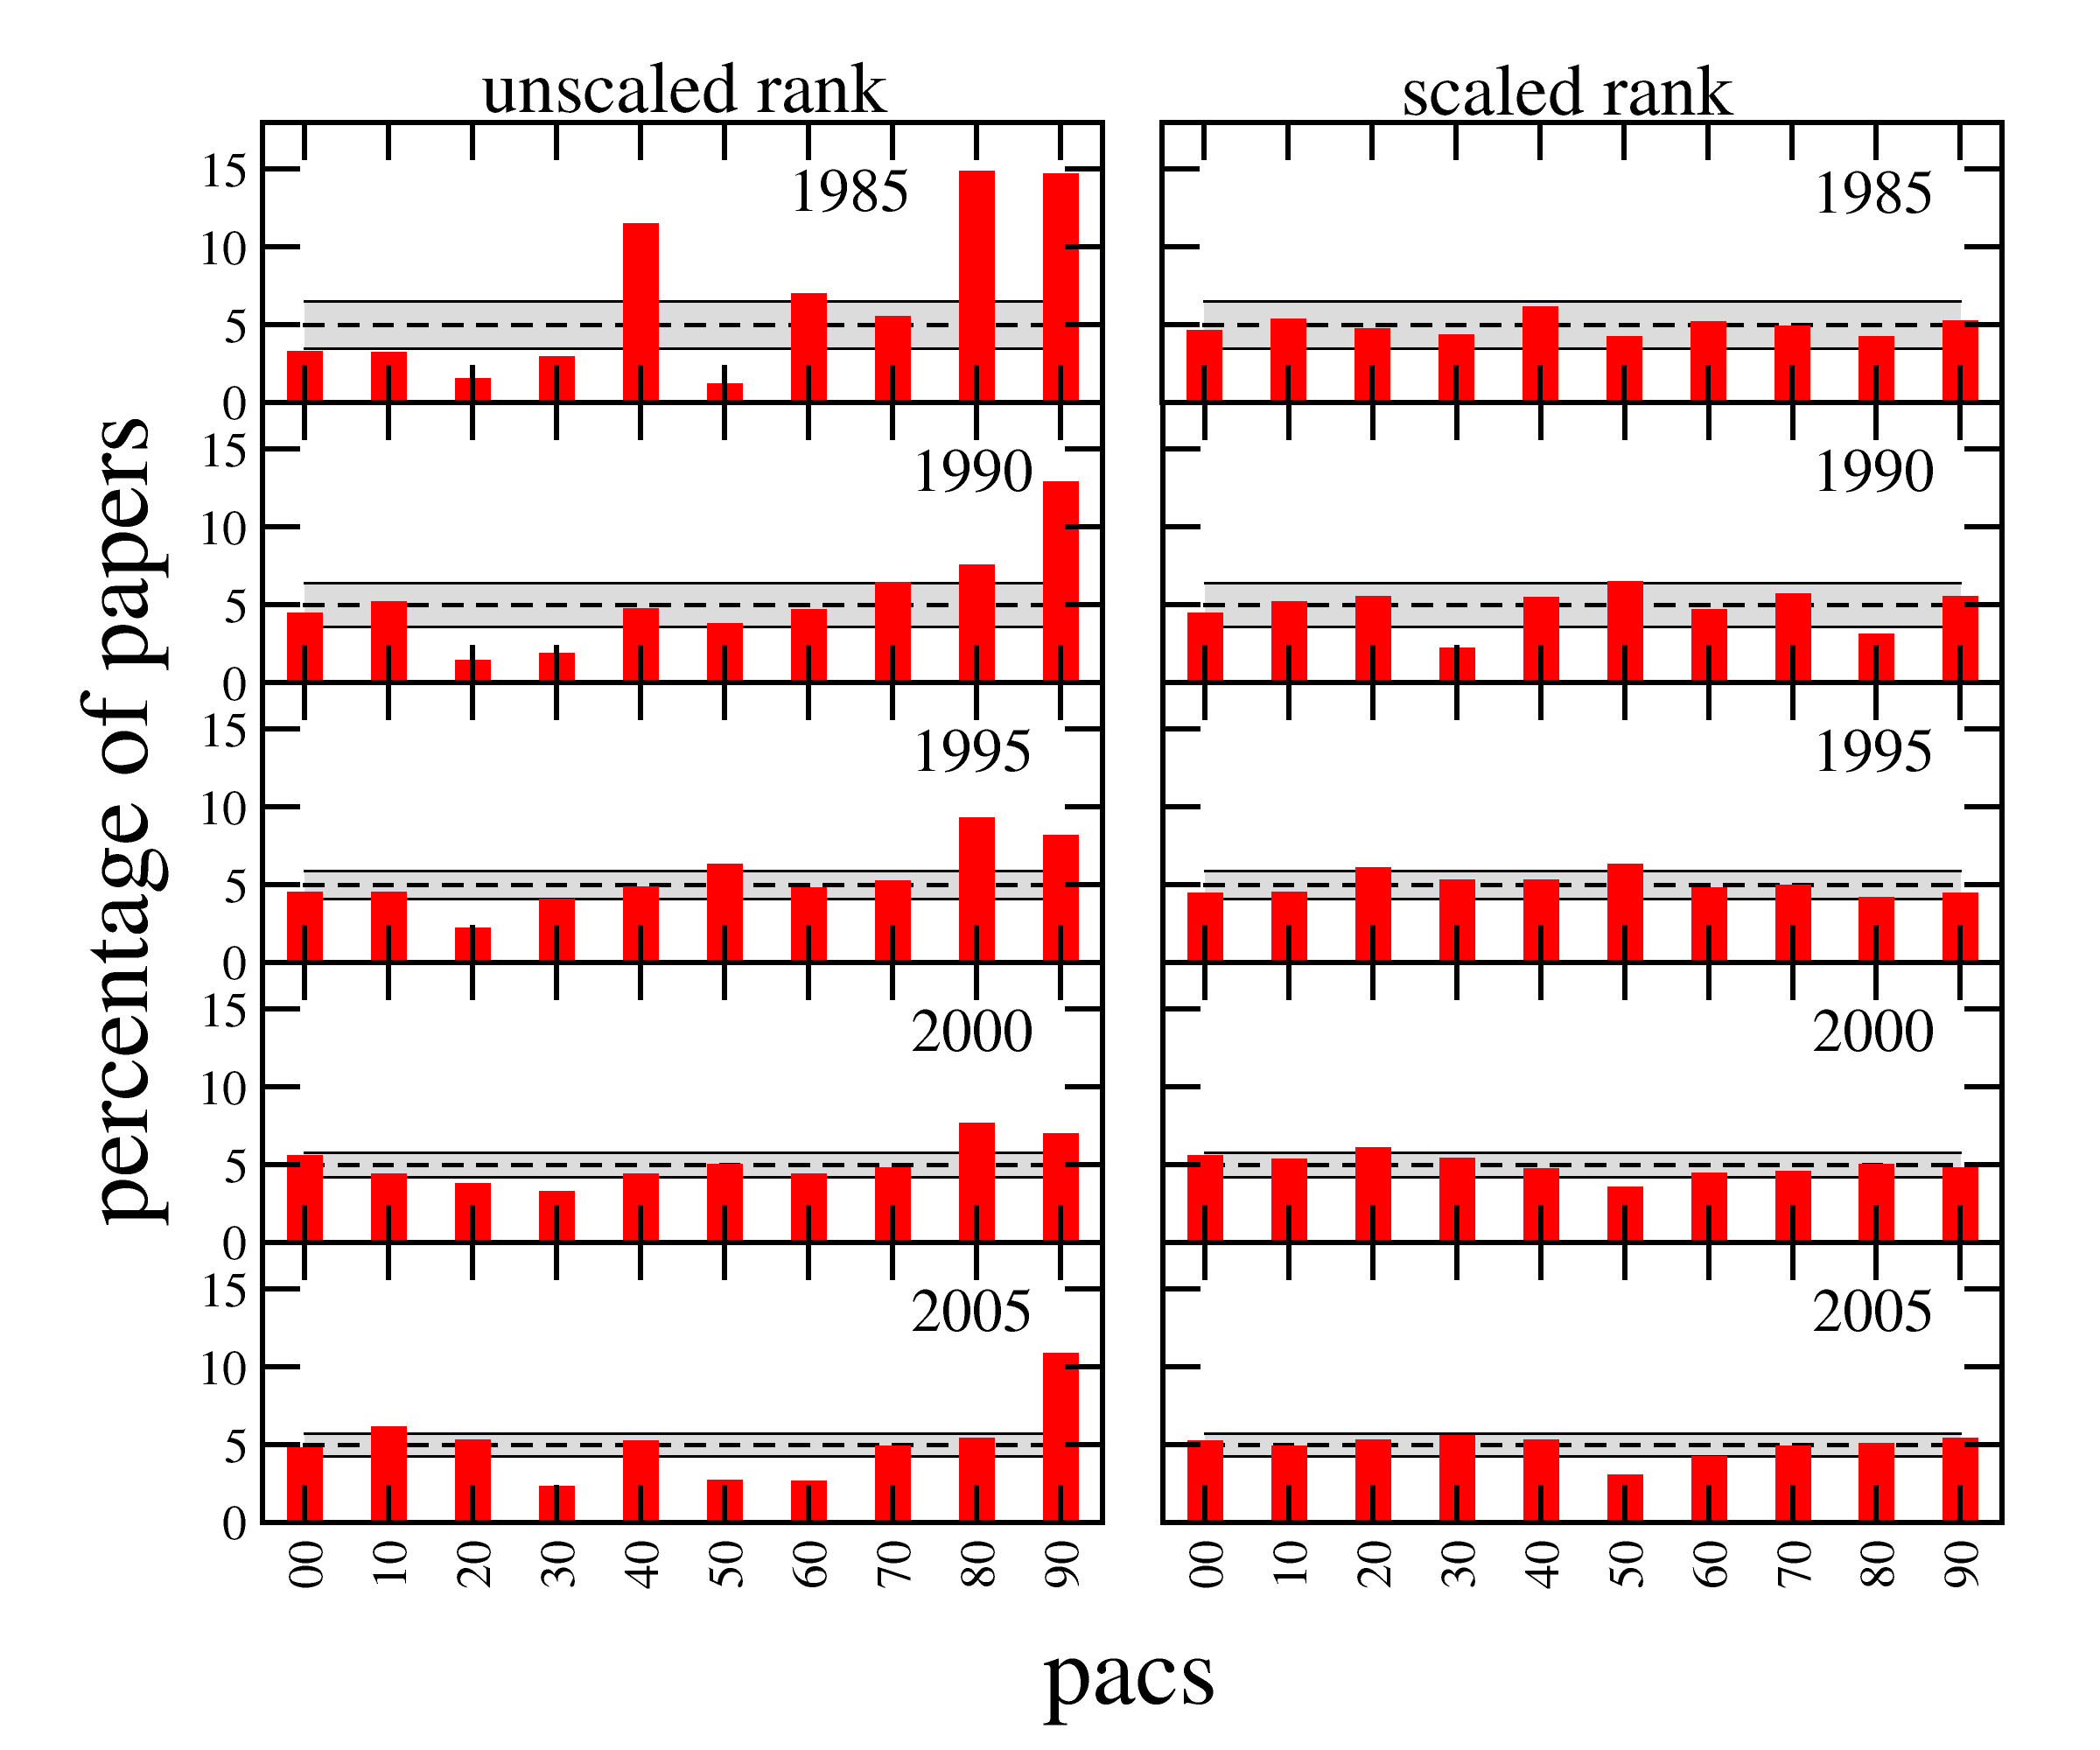
A more quantitative assessment of the improvement induced by the use of instead of the raw number of citations comes from the ranking of articles. We consider papers belonging to several sets and rank them according either to the number of citations or to the rescaled indicator . We compute then the percentage of publications of each category that appear in the top of the global rank. If the ranking is fair the percentage for each category should be around with small fluctuations.
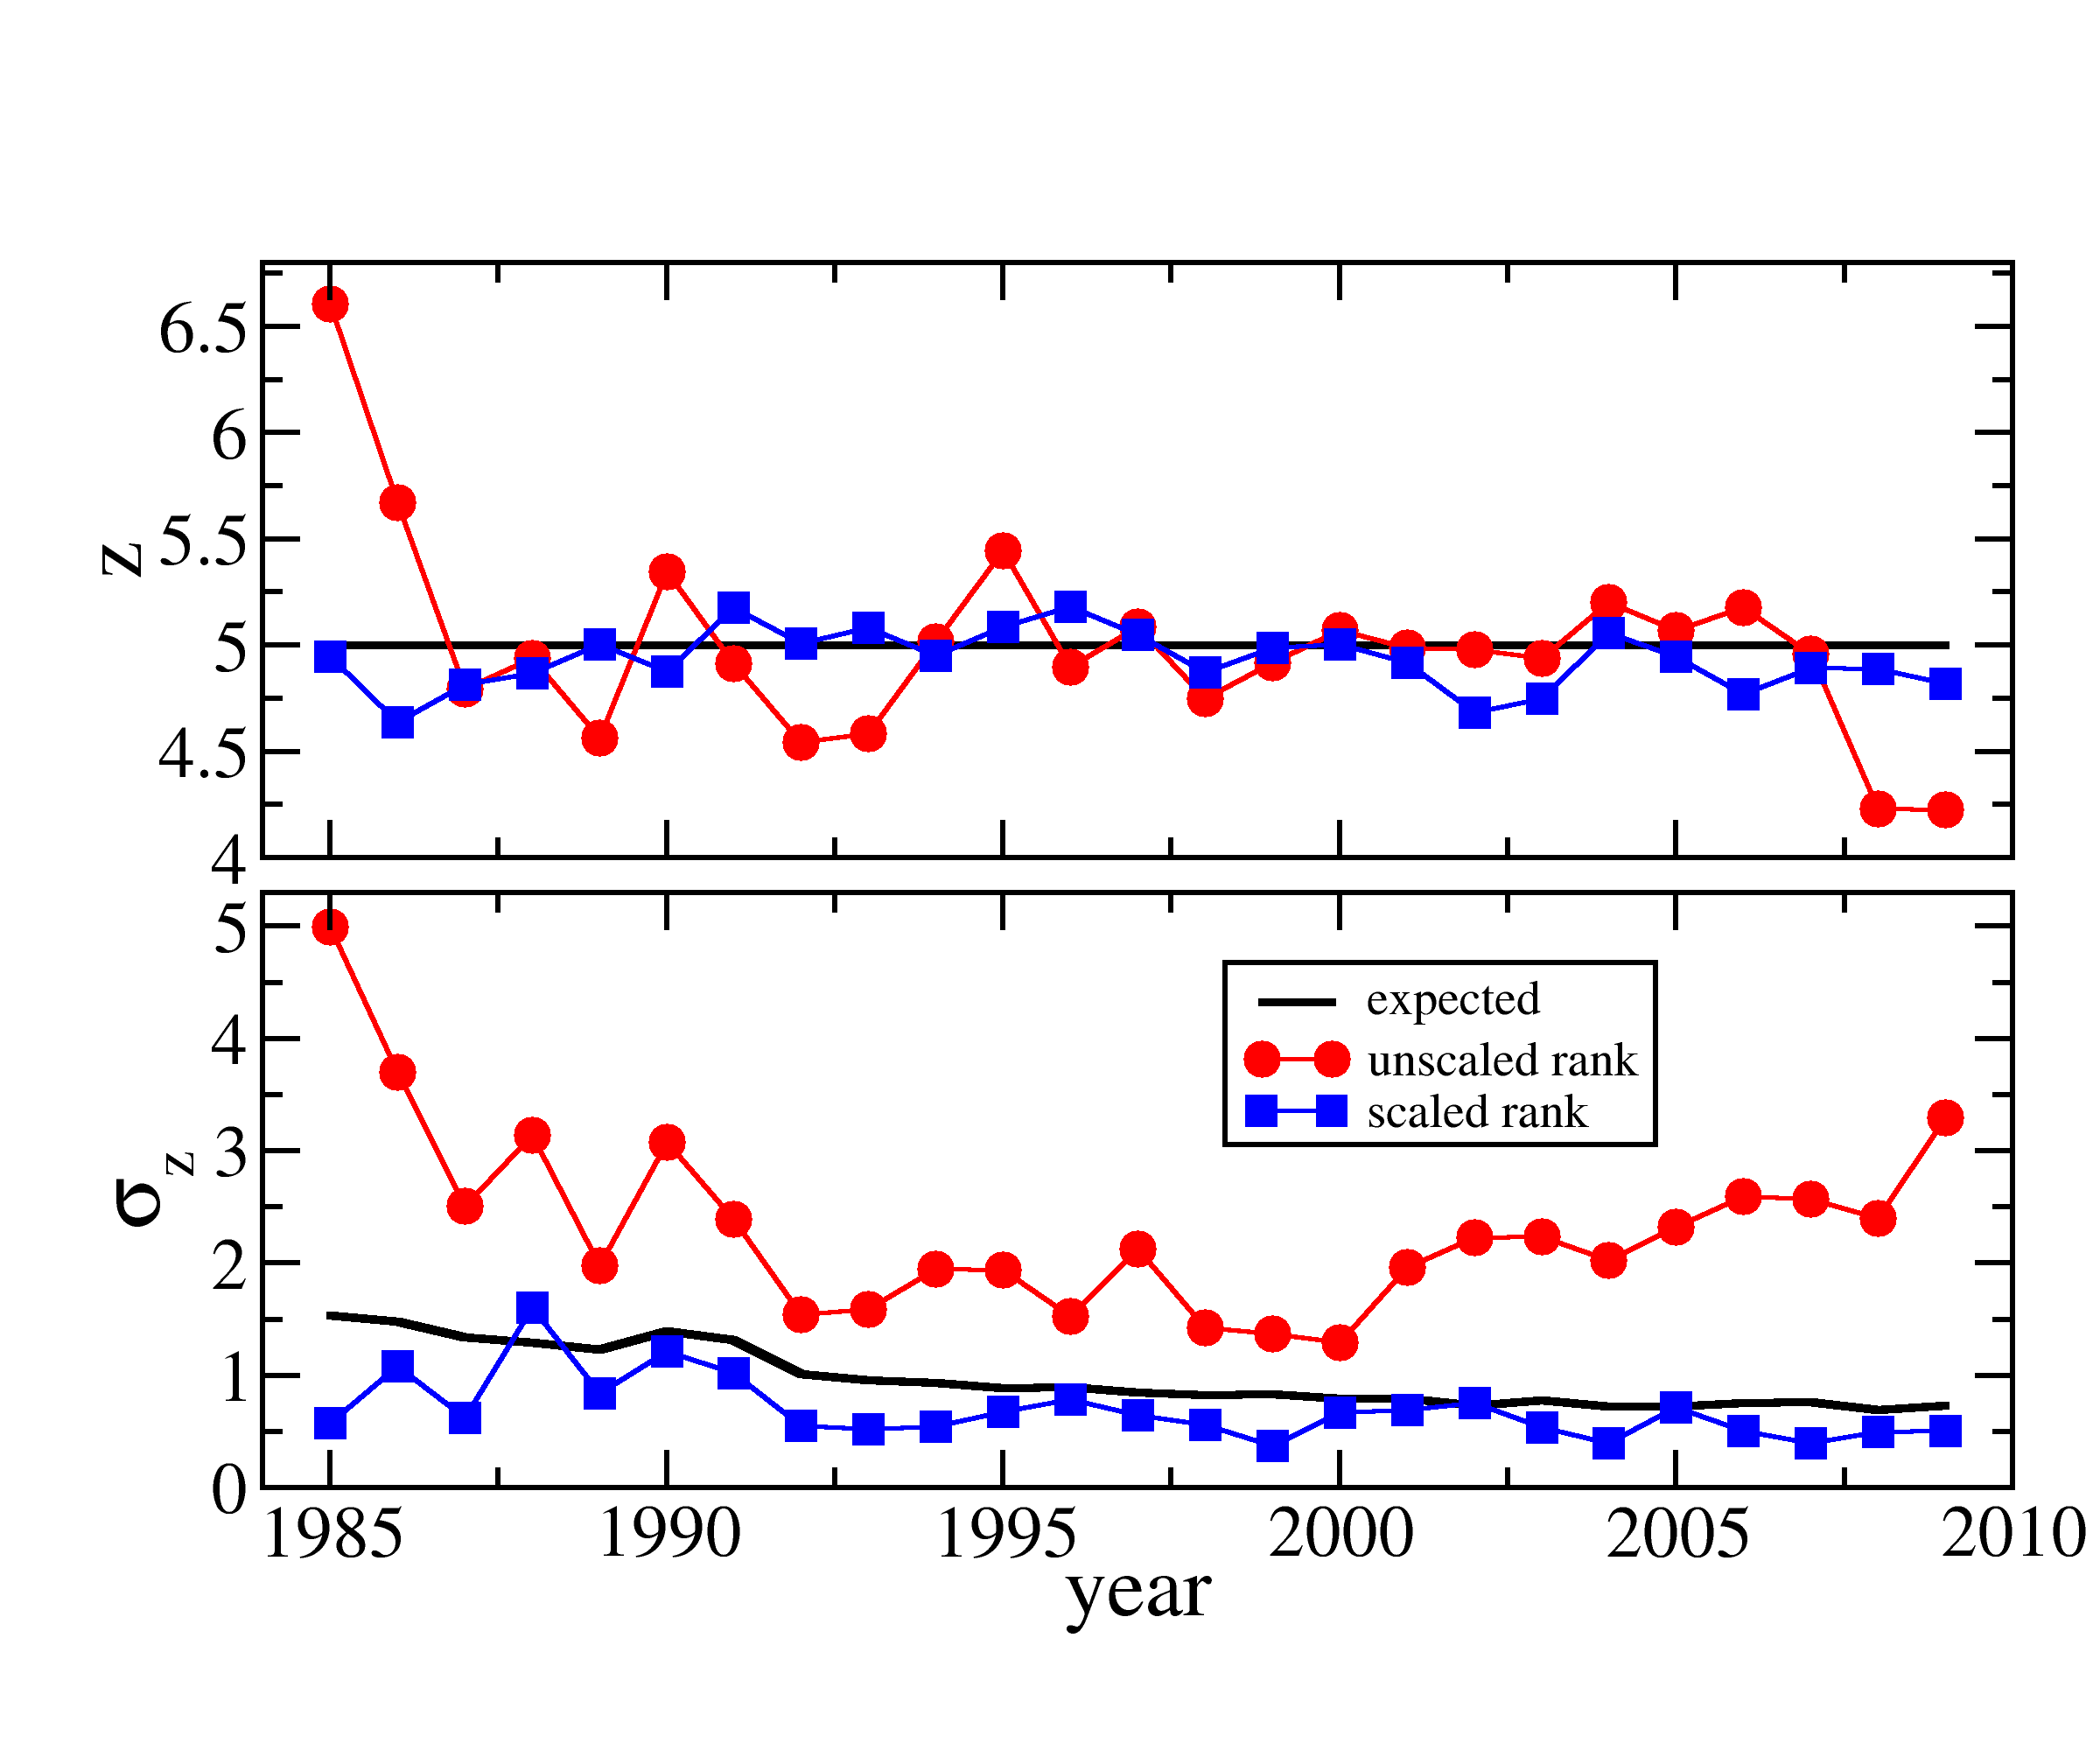
Fig. 4 clearly shows that when articles are ranked according to the unnormalized number of citations there are wide variations among fields. Such variations are dramatically reduced when the relative indicator is used. More quantitatively, assuming that the distributions for the various fields are the same, the expected value of the bin height in Fig. 4 is with a standard deviation
| (2) |
where is the number of categories and the number of articles in the -th category. When the ranking is performed according to we find (Fig. 5) a very good agreement with the hypothesis that the ranking is unbiased, while strong evidence that the ranking is biased is found when is used.
We show in Figs. 6, 7 and 8 the results obtained for different publication years, but fixed PACS categories.
The results presented in the figures demonstrate that the ranking based on is fair, the fluctuations around the expected value being accounted for by finite sample effects. On the contrary, when the raw number of citations is used, some sets are largely overrepresented and others underrepresented in the top group. Similar results (not shown) are obtained for other values of .
V Renormalized citation counts for authors
In this section we present a practical application to the comparison of individual researchers, showing how the rescaled indicator is correlated but far from being equivalent to the raw number of citations . We have considered all papers published in APS journals from to and labeled with PACS numbers, and indicated, for the generic paper , with and the number of citations received and the relative indicator, respectively. We have then identified, for each author , the set of her/his publications 111This procedure is subject to many potential errors in the identification of authors. However, this problem is not big radicchi09 ., and computed the total number of her/his citations and the corresponding total value of the her/his relative indicator .
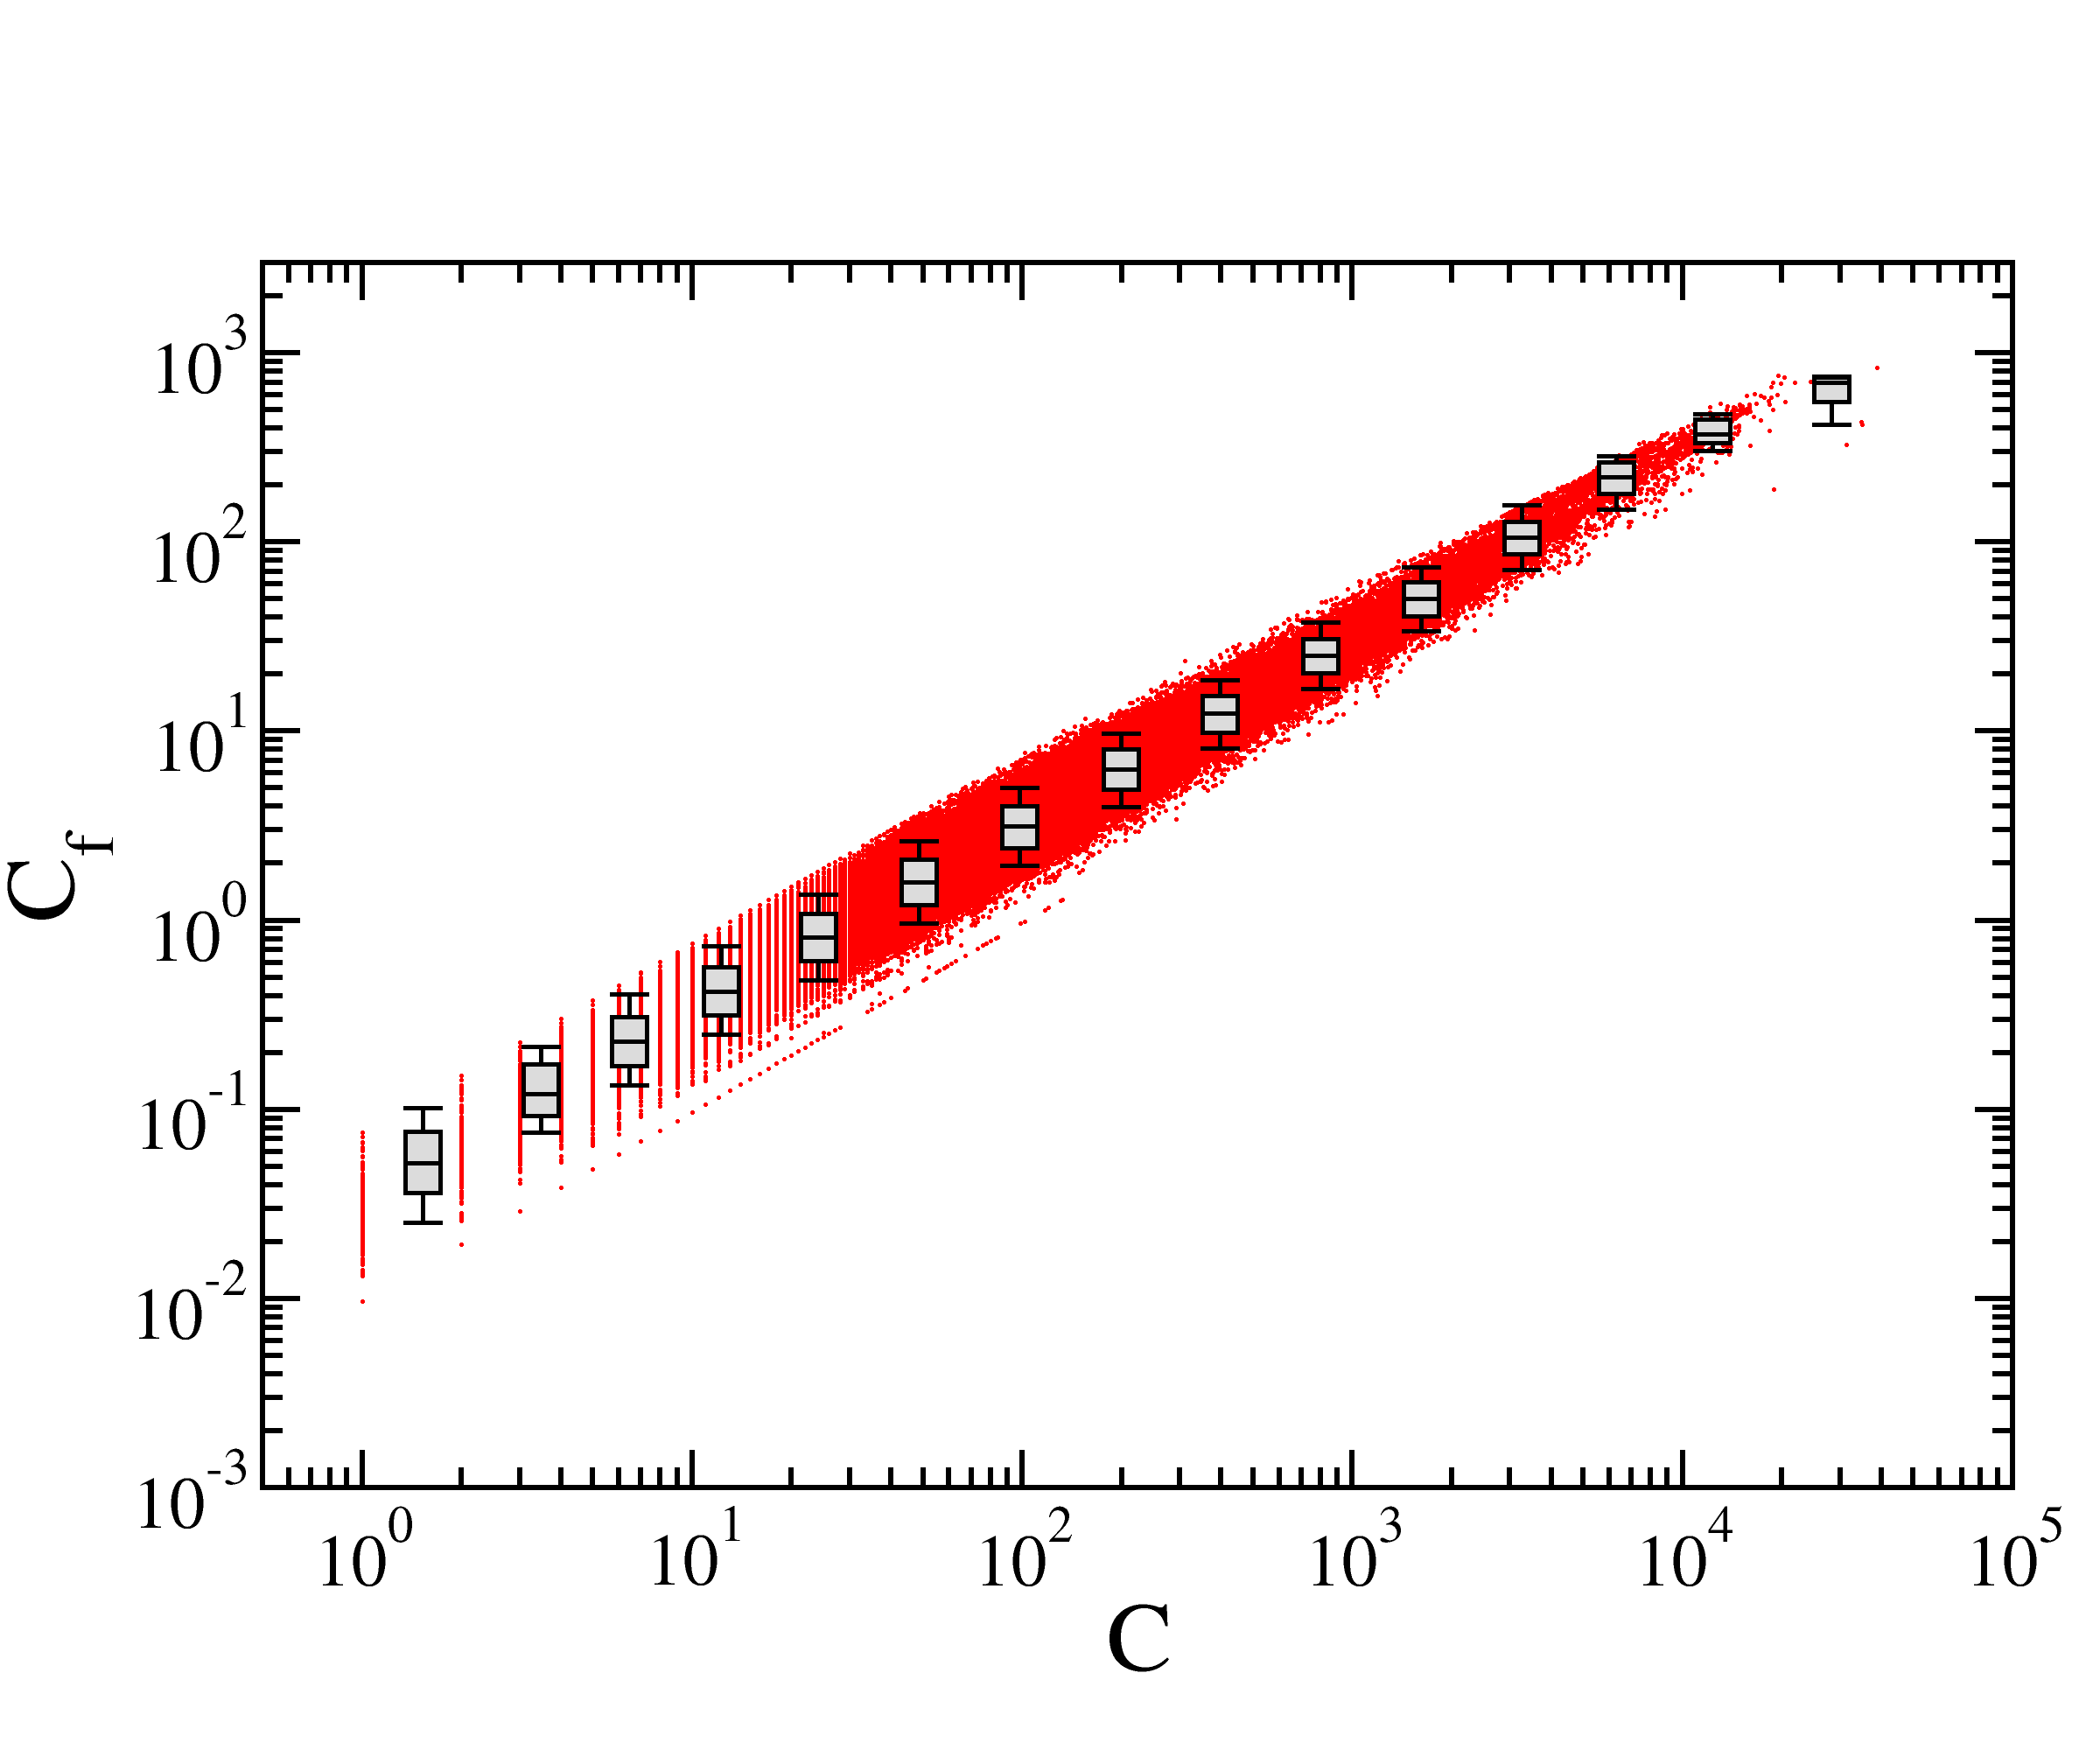
Fig. 9 reports for each author the value of the total rescaled indicator as a function of the total number of raw citations . The correlation is very good , but not perfect. For a single value of one indicator there are often values of the other spanning one order of magnitude, indicating again that authors with a very different number of raw citations may be equivalent once differences across subfields and time are considered. An even more striking result is obtained when the relative indicator is further rescaled by the number of authors for each paper: , where is the number of authors of the -th paper. This rescaling is aimed at taking into account multiple authorship price81 ; egghe00 ; hsu09 and it is based on the assumption that all authors contribute equally to each publication 222This is for sure largely incorrect in many cases, but it is the most reasonable assumption as long as precise statements about individual contributions are not be published for each article..
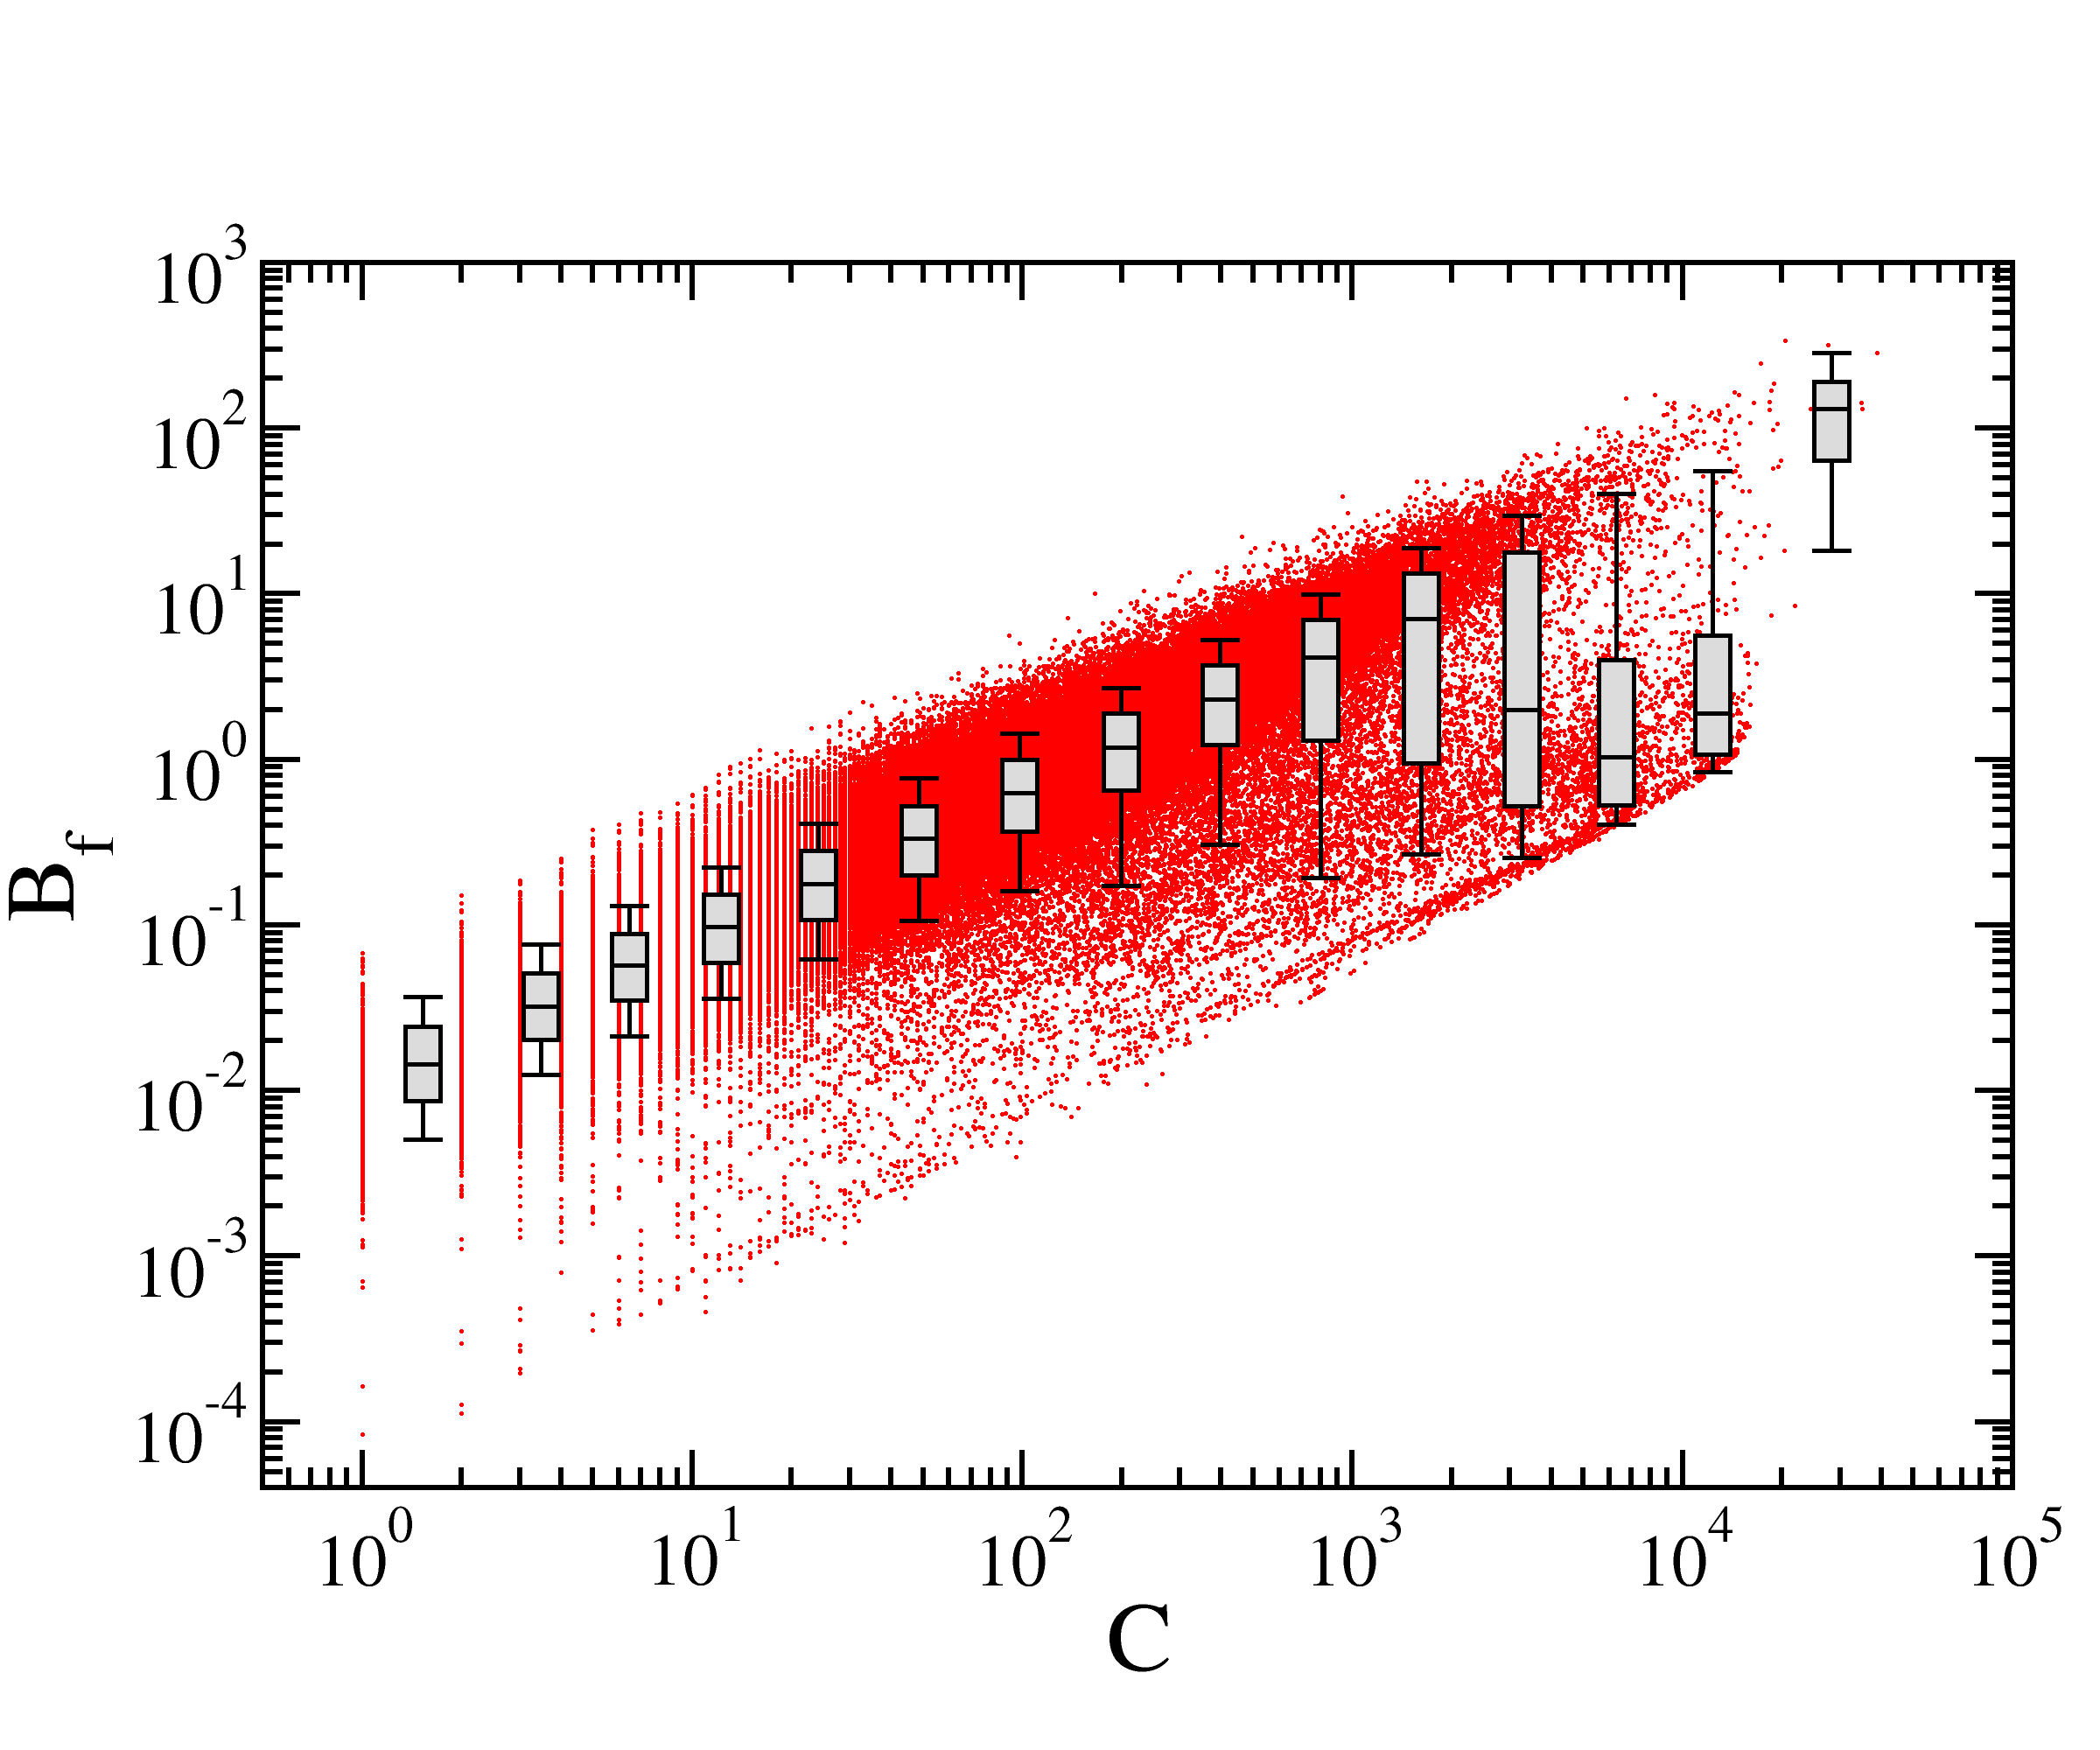
In this case, the range of variations of for each value of is much increased (the -value is reduced to ), reaching in many case two orders of magnitudes. Fig. 10 leads to the striking observation that a researcher with citations may have a number of rescaled citations equal to a colleague whose publications have been cited only less than times!
VI Conclusions
In this paper we have investigated the possibility to compare in a fair manner the citations of papers published in APS journals in different years and/or in different fields of Physics. We have shown that the raw number of citations is not a suitable indicator, since there are remarkable differences depending on the field and on the year of publication. A fair comparison is obtained instead if the relative number of citations (i.e., the number of citations divided by the average number of cites for the same category and year) is considered. The normalization rescales essentially all distributions on top of each other and this is further confirmed by checking that ranking papers according to does not introduce any bias. For completeness, we have performed (but not shown here) the same type of analysis by using as renormalization factor the median value instead of the average. The median is less sensitive to possible extreme events such as the presence of highly cited papers, but diving the raw number of cites by the median value leads to less fair comparisons and only for sufficiently old publications ().
In this paper we have considered fields as identified by the first digit of the first number in the PACS code. This classifies all papers in Physics in very broad categories. In principle one can pursue further this line of investigation, considering more refined levels of categorization. A natural next step would be the consideration of distinct categories, each identified by the whole first field of the PACS code. However, the number of papers published each year in each of these categories is typically very small, and this gives rise to huge fluctuations that do not allow to extract reliable conclusions.
We believe that these results are very important in view of the increasing trend towards quantitative evaluation of research performance. We strongly encourage researchers dealing with such issue to consider relative citation numbers as the basis of all their evaluations. All indicators for sets of publications (individual authors, groups, research institutions) must be constructed based on the relative citation numbers. This is important also for very large sets (e.g., at the institution level) in order to weigh in a balanced manner the contribution of all fields. For this reason the values of the average number of citations for each category and each year will be available at the web page filrad.homelinux.org/resources, where they will be updated periodically.
APS journals are an important but clearly partial domain of the whole range of dissemination outlets available for researchers in Physics. The extension of the work presented here to include also all other journals where research about Physics is published is a much needed step toward a more reliable citation-based research performance evaluation. Finally, let us stress that the attribution of citations of multi-authored papers to individual contributors is a crucial and much overlooked issue. Different ways of dealing with this problem lead to completely different results, as Figs. 9 and 10 demonstrate. The current common habit of attributing all citations to all authors, with no normalization, is unfair and it encourages the misconduct of inflating author lists with individuals who did not actually contribute to the work.
VII Acknowledgments
We acknowledge the American Physical Society for providing the data about Physical Review’s journals. We thank L.A.N. Amaral and M. Cencini for discussions and feedback on the manuscript.
References
- (1) D.J. de Solla Price, Science 149, 510–-515 (1965).
- (2) L. Egghe, and R. Rousseau, Introduction to Informetrics: Quantitative Methods in Library, Documentation and Information Science, (Springer, Amsterdam, 1990).
- (3) H. Moed, Citation analysis in research evaluation (Springer, Dordrecht, 2005).
- (4) J. E. Hirsch, Proc. Natl. Acad. Sci. USA 102 16569-16572 (2005).
- (5) J. Bar-Ilan, Journal of Informetrics 2, 1–-52 (2008).
- (6) M. J. Stringer, M. Sales-Pardo, and L.A.N. Amaral, PLoS ONE, 3, e1683 (2008).
- (7) A. M. Petersen, F. Wang, and H. E. Stanley, Phys. Rev. E 81, 036114 (2010).
- (8) M.J. Stringer, M. Sales-Pardo, and L.A.N. Amaral J. Am. Soc. Information Sci. Technol. 61, 1377–-1385 (2010)
- (9) M. H. Macroberts and B. R. Macroberts, Scientometrics 36, 435-444 (1996).
- (10) R. Adler, J. Ewing, and P. Taylor, Statist. Sci 24, 1-14 (2009).
- (11) L. Bornmann, H.-D. Daniel, J. Docum., 64, 45-80 (2008).
- (12) L. Bornmann, Annu. Rev. Inform. Sci., 45, 199-245 (2011).
- (13) J. Lane, Nature, 464, 488-489 (2010).
- (14) A. Schubert, and T. Braun T, Scientometrics, 9 281-291 (1986).
- (15) L. Leydesdorff and T. Opthof, Journal of Informetrics, 4, 423-430 (2010).
- (16) L. Waltman et al., arXiv:1003.2167
- (17) F. Radicchi, S. Fortunato, and C. Castellano, Proc. Natl. Acad. Sci. USA 105, 17268 (2008).
- (18) C. Castellano, and F. Radicchi Arch. Immunol. Ther. Ex. 57, 85–90 (2009).
- (19) publish.aps.org/PACS
- (20) http://publish.aps.org/datasets-announcement
- (21) S. Redner, Physics Today, 58, 49-54 (2005).
- (22) K. W. Boyack, R. Klavans, and K. Börner, Scientometrics, 64, 351-374 (2005).
- (23) C. Lee, W. Yang, and R.G. Parr, Phys. Rev. B 37, 785–-789 (1988).
- (24) F. Radicchi, S. Fortunato, B. Markines, and A. Vespignani, Phys. Rev. E 80, 056103 (2009).
- (25) D. J. De Solla Price, Science 212, 987 (1981).
- (26) L. Egghe, R. Rousseau, and G. Van Hooydonk, J. Am. Soc. Inform. Sci. 51, 145-157 (2000).
- (27) J. W. Hsu and D. W. Huang, Phys. Rev. E 80, 057101 (2009).