Fundamental Vibrational Transition of CO during the Outburst of EX Lupi in 2008 11affiliation: Based on data collected in the course of CRIRES Large program [179.C-0151] and DDT program [281.C-4031(D,E,F)] at the VLT on Cerro Paranal (Chile), which is operated by the European Southern Observatory (ESO). 22affiliation: Based on data collected at Subaru Telescope, which is operated by the National Astronomical Observatory of Japan.
Abstract
We report monitoring observations of the T Tauri star EX Lupi during its outburst in 2008 in the CO fundamental band at 4.6–5.0 m. The observations were carried out at the VLT and the Subaru Telescope at six epochs from April to August 2008, covering the plateau of the outburst and the fading phase to a quiescent state. The line flux of CO emission declines with the visual brightness of the star and the continuum flux at 5 m, but composed of two subcomponents that decay with different rates. The narrow line emission (50 km s-1 in FWHM) is near the systemic velocity of EX Lupi. These emission lines appear exclusively in v=1-0. The line widths translate to a characteristic orbiting radius of 0.4 AU. The broad line component (FWZI 150 km s-1) is highly excited upto v6. The line flux of the component decreases faster than the narrow line emission. Simple modeling of the line profiles implies that the broad-line emitting gas is orbiting around the star at 0.04–0.4 AU. The excitation state, the decay speed of the line flux, and the line profile, indicate that the broad-line emission component is physically distinct from the narrow-line emission component, and more tightly related to the outburst event.
Subject headings:
circumstellar matter — planetary systems: protoplanetary disks — stars: activity: other — stars: pre-main sequence — stars: formation — stars: individual (EX Lupi)1. Introduction
EX Lupi, the prototype of the class of the eruptive pre-main sequence stars called EXors,111The group of low-mass stars with large variability is coined as EXors by Herbig (1989) for its nature of the outburst similar to FU Ori variables that are collectively called FUors. underwent its largest outburst recorded in the past 50 years in early 2008 (history of the observations of EX Lupi and EXors: Herbig, 2007, 2008). The observational definition of EXor variables relies strongly on the prototype EX Lupi, which spectroscopically looks like a classical T Tauri star in the quiescent phase (Herbig, 1950, 2001), but flares by 1–3 magnitudes in the visible roughly once a decade, with each outbreak lasting about a year (Herbig, 2007). The spectroscopic behavior in the outburst is complicated, and sometimes related to an expanding stellar shell (e.g. Herbig, 1989). It is increasingly accepted, however, that the circumstellar disk plays the primary role in the outbursts, in which mass accreted from the envelope is stalled somewhere in the disk, until it reaches a critical surface density and triggers a disk instability.
The idea that EXor outbursts arise inside the accretion disk originates in their observational similarity with FUors. The most compelling evidence that the FUor outburst has its origin in a disk is the split absorption lines in the visible to the near-infrared with wavelength separation of two absorption peaks gradually decreasing with the wavelength (Hartmann, Hinkle, & Calvet, 2004). This is most naturally accounted for when the absorption lines at long wavelengths arise from the cool outer part of the disk, where the orbital velocity is slower (e.g. Zhu et al., 2009). FUors and EXors are historically considered as different classes of eruptive pre-main sequence stars. However, both classes may represent a similar eruptive event, and differ only quantitatively in terms of flare amplitude, outburst duration, and outburst frequency. Recent outbursts of V1647 Ori (the central source of “McNeal’s Nebula”, e.g. Aspin, Beck, & Reipurth, 2008) are recurrent like EXors, yet the amplitude of the outburst is more compatible with FUors, which fills the gap between these two classes. The mass accreted in a single outburst and the frequency of the outbursts indicates that an EXor/FUor star acquires a substantial fraction of its mass solely during the outbursts. It lends circumstantial support to the theory that EXors/FUors are not a group of special variable stars, but a state of the accretion phase that stars commonly experience during their evolution (e.g. Hartmann & Kenyon, 1996). However, there are indeed qualitative differences between FUors and normal T Tauri stars, such as the clustering nature, as FUors tend to be in isolation, while other T Tauri stars are in clusters (Herbig, Petrov, & Duemmler, 2003). Moreover, the number of known FUors in the Orion Nebula Cluster falls short if all class I sources go through the FUor phase with a finite duty cycle (Fedele et al., 2007), although the number may increase with the inclusion of the “FUor-like” stars being identified recently (Greene, Aspin, & Reipurth, 2008). The current focus of EXor studies is to understand (1) what is the mechanism of the disk instability, (2) what is the relationship between EXors and FUors, and (3) what is the role of EXor/FUor events in the context of star formation.
In this report, we will concentrate on the cause of the disk instability and the physical scale of the outburst, as it often gives a clue to the trigger of the instability. The most favored model to date, thermal instability in a disk, is induced by ionization, and subsequent opacity increase due to negative hydrogen ions (Bell, Lin & Ruden, 1991; Clarke et al., 1989). The thermal instability is therefore only operational within a limited disk radius, where atomic hydrogen is subject to thermal ionization. If the physical size of the outburst is larger, magnetohydrodynamic (MHD) instability may be favored, as it predicts a massive accretion in the magnetic dead zone at 1–10 AU (Armitage et al., 2001). If the outburst involves the whole disk, the scenario of an unseen companions leading to global disk instability may also work (Bonnell & Bastien, 1992).
The vibrational transitions of CO are a unique probe of the inner regions of disks (0.01–1 AU) due to their high critical density ( cm-3) and high excitation energy ( K). Measurement of the location of the emitting gas is relatively straightforward under the assumption that the gas is in Keplerian rotation (e.g. Najita et al., 1996). We utilized multi-epoch observations of CO vibrational transitions in EX Lupi to constrain where in the disk the hot gas is located during the outburst, and how its physical property develops with time. The present study is part of the first multi-wavelength campaign of EX Lupi from the optical (Sicilia-Aguilar et al., 2010), near-infrared (Kóspál et al., 2010) to mid-infrared wavelengths (Ábrahám et al., 2009; Juhász et al., 2010) during the 2008 eruption. We will use pc as the distance to EX Lupi from Lombardi et al. (2008), and the stellar parameters from Gras-Velázquez & Ray (2005) following Sipos et al. (2009) (Table 1).
2. Observations
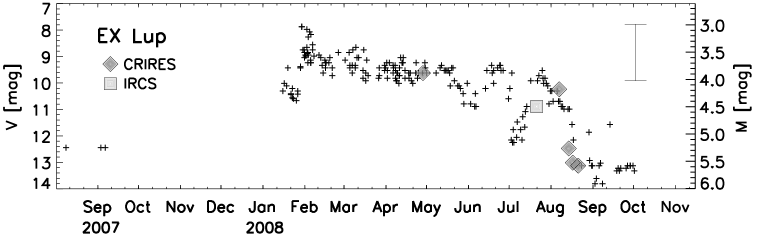
The spectroscopic observations of the CO fundamental band were performed at the VLT and the Subaru Telescope over a total of 6 epochs (Figure 1). Half of the data were obtained in the director’s discretionary time (DDT) on 14, 17, and 21 August 2008 at the VLT. Two wavelength intervals of the CO fundamental band (4.66–4.77 m and 4.86–4.99 m with gaps between the four detector chips) were observed with CRIRES (Käufl et al., 2004) to cover the low [(1)–(11)] and the high [(21)–(32)] rotational transitions of v=1-0 in order to provide good constraints on the rotational excitation temperature of the hot gas. The slit width was 02, corresponding to a nominal spectral resolution of =100,000 (=3 km s-1). The spectra were recorded by nodding the telescope along the slit to remove the sky background. The slit was oriented along P.A. = 0°, 180°, 90° and 270° by rotating the image rotator for the possible use of the data for spectroastrometry. Unfortunately, the achieved signal to noise ratio was not sufficient to extract any meaningful astrometric signal. The data obtained with different P.A. were simply summed and reduced as classical spectroscopic data. The total integration time was 12 and 16 minute for each grating setting. The MACAO adaptive optics system (Bonnet et al., 2004) was used with EX Lupi itself as the guide star. Spectroscopic standard stars were observed at close airmass with a same instrument setup.
EX Lupi was also observed by CRIRES at the VLT in the framework of the ESO large program 179.C-0151 on April 28 and August 7 in 2008. The observations covered the CO spectrum at 4.65–4.77 m with additional coverage at 4.81–4.90 m in the August observations. The slit width and the AO settings were the same as during the DDT observations. The total exposure times were about 20 min per grating setting in both of the nights.
IRCS (Tokunaga et al., 1998) at the Subaru Telescope was used to obtain CO fundamental band spectra of EX Lupi on 21 July 2008. The angle of the echelle grating was set so that the spectral interval of 4.65–4.74 m was covered by the detector. The 015 slit was used resulting in a spectral resolution of =20,000 (km s-1). The spectra were recorded by nodding the tip-tilt mirror inside the AO system 34 along the slit to remove the sky background. The observation was performed through a large airmass ( 2) with 5 times lower spectral resolution than CRIRES. Thus, the data quality is significantly lower. The total integration time was 14 minutes. The adaptive optics system (Hayano et al., 2008) was also used here with EX Lupi as the guide star. The observations of all 6 epochs are summarized in Table 2.
One-dimensional spectra were extracted from the CRIRES dataset using the crires_spec_jitter recipe222CRIRES Pipeline User Manual VLT-MAN-ESO-19500-4406. on the ESO gasgano platform333http://www.eso.org/sci/data-processing/software/gasgano/.. A custom-written IDL code was used to divide the spectra of EX Lupi by standard star spectra to eliminate telluric absorption lines. In the cases where the precipitable water vapor varied during the night, the water absorption was removed from both the object and the standard spectra beforehand by dividing them by the ATRAN atmospheric transmission model (Lord, 1992). The IDL code further corrected wavelength offsets between EX Lupi and the spectroscopic standard spectra, slight differences in spectral resolution, and mismatches of the airmass. The wavelength calibration was performed by maximizing the cross-correlation between the observed spectra and the atmospheric transmission curve. The wavelength calibration error depends on the density of the telluric lines, and is less than a few pixels (5 km s-1).
The IRCS data were reduced in the same way, except that the IRAF444IRAF is distributed by the National Optical Astronomy Observatories, which are operated by the Association of Universities for Research in Astronomy, Inc., under cooperative agreement with the National Science Foundation. aperture extraction package was used to extract the one-dimensional spectra.
EX Lupi is an M0 star in its quiescent phase with CO bandhead absorption at 2.3 m (Sipos et al., 2009). Nevertheless, the photospheric correction for the CO absorption lines was not performed at 4.7 m, as the photospheric temperature during the outburst is unknown. The contribution of the stellar photosphere at 5 m is less than 20% in the quiescent phase (Sipos et al., 2009), and expected to be less during the outburst (Juhász et al., 2010).
| Epoch | Program | JD | V | M | Spectrograph | Telescope | Velocity | Wavelength | Integration | Standard | Spectral |
|---|---|---|---|---|---|---|---|---|---|---|---|
| [mag]aaFrom AAVSO http://www.aavso.org/. | [mag]bbPhotometry is done with respect to the spectroscopic standard stars. The accuracy is 0.5 mag. | Resolution | Coverage | Time [min]ccFor one grating setting. | Star | Type | |||||
| 28 Apr 2008 | 179.C-0151(D) | 2454585 | 9.7 | 3.88 | CRIRES | VLT | 3 km s-1 | 4.65–4.77 m | 20 | HR 6084 | B1 III |
| 21 Jul 2008 | DDT | 2454669 | 10.0 | 4.50 | IRCS | Subaru | 15 km s-1 | 4.65–4.74 m | 14 | HR 5987 | B2.5Vn |
| 7 Aug 2008 | 179.C-0151(D) | 2454686 | 10.8 | 4.18 | CRIRES | VLT | 3 km s-1 | 4.65-4.77m, 4.80-4.90m | 20 | HR 6084 | B1 III |
| 14 Aug 2008 | 281.C-4031(D) | 2454693 | 11.1 | 5.27 | CRIRES | VLT | 3 km s-1 | 4.66–4.77mddWith gaps between the four detector chips. 4.86-4.99mddWith gaps between the four detector chips. | 12, 16 | HR 6508 | B2IV |
| 17 Aug 2008 | 281.C-4031(E) | 2454696 | 12.3 | 5.53 | CRIRES | VLT | 3 km s-1 | 4.66-4.77mddWith gaps between the four detector chips. 4.86-4.99mddWith gaps between the four detector chips. | 12, 16 | HR 6508 | B2IV |
| 21 Aug 2008 | 281.C-4031(F) | 2454700 | 13.3 | 5.58 | CRIRES | VLT | 3 km s-1 | 4.66-4.77mddWith gaps between the four detector chips. 4.86-4.99mddWith gaps between the four detector chips. | 12, 16 | HR 6508 | B2IV |
Since there is no simultaneous photometry available at 5 m, the absolute flux calibration was performed against the spectroscopic standard stars HR 6084, HR 5987, and HR 6508. HR 6084 is a B1 III star with an band magnitude of 2.42 mag555http://www.jach.hawaii.edu/UKIRT/astronomy/calib/phot_ cal/bright_stds.html. HR 5987 and HR 6508 are B2.5 Vn and B2 IV stars with magnitudes of 4.70 and 3.18 mag, respectively, but without accurate band brightness documented. We applied a color correction of mag taken from of early B stars [Tokunaga (1999) with the original from Koornneef (1983)], that gives and 3.23 mag, respectively. The precise correction is unimportant, since the overall photometric accuracy is only 0.5 mag. The main source of photometric error is the variable slit transmission at the time of the observation up to a factor of three even in a pair of consecutive frames. The variable atmospheric transmission during the nights adds another 30% to the photometric uncertainty. EX Lupi becomes fainter from 3.9 to 5.6 mag in the band over 4 months (Table 2). The photometric value on 28 April is surprisingly bright, as Spitzer spectroscopy in April 2008 indicates 1.5 Jy at 5 m, or 5.0 mag (Juhász et al., 2010). Since then, the star became fainter at optical wavelengths666AAVSO http://www.aavso.org/., albeit with significant variability on timescales of days to weeks. The data counts in the raw frames are at least consistent with those of =3.9–5.6 mag stars, as simulated by the exposure time calculator of CRIRES777http://www.eso.org/observing/etc/..
3. Analysis
3.1. Two Emission Components
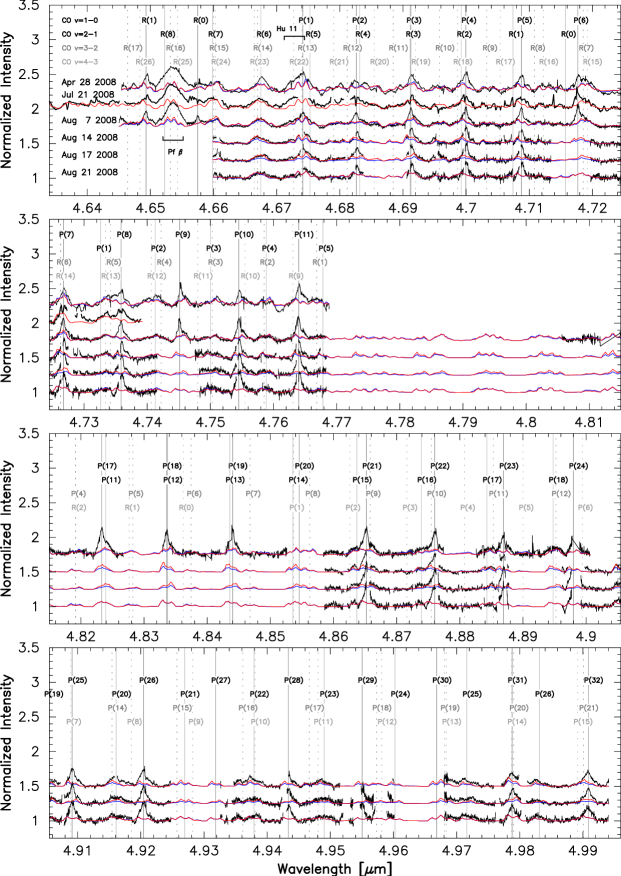
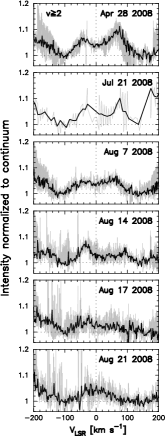
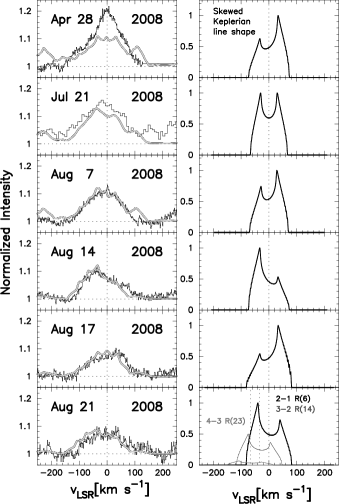
All spectra from the 6 epochs are shown in Fig. 2 after having been normalized to the continuum and corrected to the local standard of the rest. Two spectral components are immediately noticeable in the CO spectra, one broad [full width at zero intensity (FWZI) km s-1] and one narrow [full width at half maximum (FWHM) km s-1] overlaid on each other. The broad line emission is characterized by the hot vibrational transitions up to v=6 confirmed. This is in agreement with the first overtone band in emission seen at least up to v=5-3 in the SINFONI spectra (Kóspál et al., 2010) observed on 25-31 July prior to the CRIRES DDT runs during the outburst. In order to illustrate the broad line profiles of the former, a few lines from v2 levels, which are relatively isolated from others, such as (3) v=2-1 at 4.750 m and (9) v=3-2 at 4.703 m, are combined and shown in the left panel of Fig. 3. The broad emission lines are most clearly seen in the April 28 data, taken during the outburst, a few months after the optical maximum.
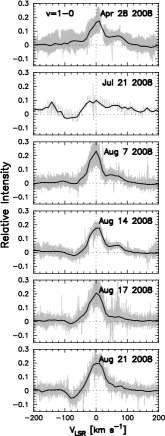
The sharp emission lines on top of the broad component are close to the systemic velocity of EX Lupi ( km s-1; Herbig, Petrov, & Duemmler, 2003). The intensity of the narrow lines is 10–20% above the continuum level throughout the observations. The line profile of the emission lines does not change significantly during and at the end of the outburst (Fig. 3, right). The line widths, markedly smaller than the broad line component, imply that the emission arises from regions of the disk outside where the broad and highly-excited emission lines comes from.
The spectral profile, composed of two distinct kinematic components, is somewhat similar to Fe II at 5018 Å observed with the HIRES spectrograph () at Keck in 1998 when EX Lupi was at the maximum in a previous outburst. Herbig (2007) attributed the broad line emission to the accretion funnels, as the Fe II emission had inverse P Cyg profile with broad absorption longward at km s-1. The velocity widths of the broad and the narrow components are 140 km s-1 and 23 km s-1 in Fe II 5018 Å, similar to the CO lines at 4.7 m. We looked for similar systematic redward absorption in the CO lines, and found that they are not present in either epoch of the observations. Moreover, as we discuss later, the line profile in the outburst is double-peaked, which implies that the emitting gas is orbiting around the star. We conclude that the origin of the broad CO emission is not the stellar photosphere or accretion columns, but the circumstellar disk. We will deconvolve the broad and the narrow emission components using a simple slab model in the next sections.
3.2. Population Diagrams
First, population diagrams were constructed to obtain an overview of the physical property of the hot emitting gas in the disk. Equivalent widths of the emission lines were measured integrating v=1-0 -branch lines over 120 km s-1. They thus include v=1-0 emission of both broad and narrow components without correcting for the overlapping higher vibrational transitions. The column density at each rotational level is calculated as from the equivalent widths . is the continuum flux coming from the -band photometry. The specific radius of the emitting area is set to 0.2 AU, so that it is roughly consistent with the line width of the broad line emission. The column density normalized by the degeneracy of the levels is plotted against the energy levels in Fig. 4. The observed population diagrams show turnovers at – K, which testifies the emitting gas is optically thick. The vertical offset of the diagrams over 6 epochs spanned roughly an order of magnitude. The population diagram was initially fit by a thermodynamical model with and as free parameters. However, in order to reproduce the sequences of in the optical thick regime with an order of magnitude dispersion, has to be adjusted by several orders of magnitude up to cm-2, which is apparently overstretching the capability of the model. We therefore fixed the column density to the minimum value of 6 epochs ( cm-2) found in the first path of the fitting, and tried to match the absolute levels of by changing the size of the emitting area. The column density cm-2 is close to the upper limit of the physically feasible value of the relatively small area of the disk ( AU, =0.1, [C/H]=10-4, cm-3). The fractional column density at v=1 level was calculated with the vibrational temperature set equal to . The best-fit is constrained within 1100–2400 K and tabulated in Table 3 with the corresponding emitting radii of the disk . The line profile is assumed to be a Gaussian function of km s-1.
3.3. Slab Model
Second, we used a simple slab model to incorporate the geometry and the rotation of the disk to reproduce the observed spectra. The slab model is a gas disk with no geometrical thickness, and meant to reproduce the underlying broad line emission only. The fundamental transition of CO is used as the sole opacity source at the wavelength concerned. No isotopomers are included, as this does not change the quality of the fit within the given signal-to-noise ratio of the spectra. Rotational levels up to , and vibrational levels up to v=8 are taken into account. The wavelengths, energy levels, and Einstein coefficients are taken from Goorvitch (1994). Ro-vibrational levels are populated according to the single-temperature Boltzmann distribution. Thermal broadening at the rotational temperature is taken as the only source of the intrinsic line width. The input parameters of thermodynamics, the total column density , and the rotational and vibrational temperatures and , are kept constant without radial dependency. The resulting spectrum is calculated as , where is the line source function , and is the opacity with being the dimensionless line profile, and being the disk inclination angle.
We tested a model with the opacity of the dust grains uniformly mixed with the gas. If we take the mass absorption coefficient 2000 cm2 g-1, as calculated by Ossenkopf & Henning (1994), the line emission of CO will be entirely suppressed by the dust continuum emission, unless the gas to dust mass ratio is larger than 10,000. We infer that the continuum emission at 5 m comes from the region outside the broad line emission region. The continuum emission is therefore removed from the observed spectra, and only the remaining line emission part is produced by the slab model, without dust continuum opacity in the radiation.
The disk is divided into annuli from the inner () to the outer disk () boundary in the way that is constant. The ro-vibrational emission spectrum is calculated in a small segment of each annulus with the given rotational and vibrational temperatures. The line spectra are then shifted by the radial velocity of the Keplerian rotation at the given azimuthal location, and added together. The stellar mass is assumed to be 0.6 (Gras-Velázquez & Ray, 2005). The line emission spectra at the different radii are combined with an arbitrary weighting function , where is fixed to 2.5 in the present modeling. The inclination angles between 40° and 50° give reasonably good fits to the spectra at all the epochs. We therefore fixed it to 45° without further adjustment. The disk model of Sipos et al. (2009), which reproduces the optical-infrared SED of EX Lupi in the quiescent phase favors face-on geometry with the most plausible inclination angle being 20°. Sipos et al. (2009) found, however, that changing the inclination angle from 0° to 40° changes the output SED little; as the SED is relatively insensitive to the inclination angle, unless the disk is heavily optically thick. The inclination angle we adopt here is near the upper limit of this range.
| aaRadius of the emitting area from the population diagram in Fig. 4. | bbTotal column density of CO fixed to cm-2. | ccInclination angle from face-on. | ddInner radius. | eeOuter radius. | ffWeight function of the intensity at different radius . | ggTotal column density of CO. | hhVibrational excitation temperature. | iiRotational excitation temperature, fixed to 4500 K. | jjAsymmetry factor of line profile. | kkFlux density at the continuum level. | llfootnotemark: | |
|---|---|---|---|---|---|---|---|---|---|---|---|---|
| Epoch | [AU] | [1019cm-2] | [K] | [°] | [AU] | [AU] | [1019cm-2] | [K] | [K] | [ 10-13 W mm-1] | ||
| 28 Apr 2008 | 0.5 | 20 | 2100 | 45 | 0.05 | 0.3 | 2.5 | 6 | 3000 | 4500 | 0.7 | 5.9 |
| 21 Jul 2008 | 0.3 | 20 | 2400 | 45 | 0.05 | 0.3 | 2.5 | 4 | 2500 | 4500 | 1.0 | 3.4 |
| 7 Aug 2008 | 0.4 | 20 | 2200 | 45 | 0.055 | 0.4 | 2.5 | 2 | 2700 | 4500 | 0.8 | 4.5 |
| 14 Aug 2008 | 0.4 | 20 | 1300 | 45 | 0.05 | 0.3 | 2.5 | 1.5 | 2000 | 4500 | 0.6 | 1.7 |
| 17 Aug 2008 | 0.5 | 20 | 1100 | 45 | 0.04 | 0.3 | 2.5 | 4 | 1800 | 4500 | 0.6 | 1.3 |
| 21 Aug 2008 | 0.4 | 20 | 1200 | 45 | 0.04 | 0.2 | 2.5 | 2 | 2000 | 4500 | 0.8 | 1.2 |

4. Discussion
4.1. Spectral Components
4.1.1 Broad Line Emission
The disk parameters of the broad line emission that we modeled in the previous section, , , , and are not independent, but interlocked in a non-trivial way. The line width of km s-1 on Apr 28 testifies that the radius of the inner edge of the disk is not larger than 0.09 AU. On the other hand, the disk cannot be too small in order to account for the absolute line flux. In the cases when the line profile is not simple and the signal-to-noise ratio is not high, such as the present case, the photometric calibration is important because the absolute line flux effectively constrains the size of the emitting region and therefore the disk radius. If we take the photometry at 5 m derived based on the spectroscopic data as face value, the single line flux ranges from 10-14 to 10-13 erg cm-2. The maximum flux density that we could retrieve from a disk at pc away is , where is the Planck function. Given the blackbody temperature of = 2000 K, the distance of pc, and the line width of 100 km s-1, we will get erg s-1cm-2, if we assume a disk radius of 0.01 AU. This is too small to account for the observed line flux, therefore the radius of the inner hot disk cannot be smaller. The lower limit for the disk radius then calls for the inclination angle to be larger than 30° to match the observed line width.
We first applied and to the models as determined by the optically thick population diagrams, and optimized gas radius to fit the line profiles best. The vibrational temperatures are set equal to . The results underestimate the absolute line flux, because the outer radius that is consistent with the kinematics in the line profiles is larger than the specific emitting radius we used to reproduce the population diagrams. The model spectra are normalized by the square of and shown in Fig. 2 in blue lines. The absolute line flux is reproduced without such an arbitrary scaling, by increasing the excitation temperature, allowing it to differ from . However, when the emitting gas is hotter than 3000 K, the line ratios of different rotational transitions diminish in a short wavelength interval. It becomes less straightforward to determine uniquely. In the optically thick regime, increasing and imposes similar effects on the output spectra. In order to cope with the degeneracy, and avoid increasing the optical depth any further, which our simple model cannot handle, the rotational temperature was set to 4500 K, as the thermal dissociation temperature of CO is 4500–4600 K (Tatum, 1966). is adjusted so that the model reproduce the absolute line flux under the condition of K. The second model with 4500 K is shown in Fig. 2 in red lines. The two solutions (Table 3) can be regarded as the two extreme cases of the spectral models, and provide a fair idea how the model is affected by the degeneracy of the parameters. The best-fit line profile of a disk in Keplerian rotation sets the inner and the outer radius at 0.04–0.05 AU (5–7 ) and 0.2–0.4 AU, respectively, for all epochs with the fixed inclination angle of 45°. These geometric parameters are commonly used in the two representative models discussed above, and less subjected to the degeneracy. The optical depth is 0–1000 at the line center in the model with , and 0–100 for K, assuming the line is only thermal broadened.
Although the heavy overlap of the lines makes it difficult to discern the shape clearly, the line profile looks double-peaked (Fig. 3). This is the first time that the line profile is found to be double peaked in EXors. It lends support to the underlying similarity of the two classes of variable stars, FUors and EXors, and the origin of EXor outbursts associated with the circumstellar disk. Hartmann and his school (e.g. Hartmann & Kenyon, 1996; Hartmann, Hinkle, & Calvet, 2004; Zhu et al., 2009) attribute the split absorption lines of FUors, unusually broad for a stellar photosphere, to the gas in Keplerian rotation in unstable disks. The interval of line splitting is smaller in the near-infrared than in the visible. This is naturally explained if the absorption lines at longer wavelengths arise from the cooler, more distant, slow-rotating region (Zhu et al., 2009). On the other hand, Herbig, Petrov, & Duemmler (2003) and Petrov & Herbig (2008) found no correlation between the line widths and the excitation potentials of the visible absorption lines of FU Ori, which should be present if the lines arise from the disk, and the disk has a temperature gradient. They argued against the disk origin of the optical lines, and claimed that the split lines are better reproduced by a large cool spot at the polar region on a rapidly rotating star. Moreover, the absorption lines of FUors are not perfectly Keplerian, but have a rectangular shape at the bottom (e.g. Hartmann, Hinkle, & Calvet, 2004). It is hard to distinguish whether the unusual line shape represents the turbulence in the upper layer of the disk through which the absorption takes place, or a particular morphology and geometry of the cool spot on the surface of a star (e.g. Petrov & Herbig, 2008). The line profile of EX Lupi is found to be double peaked, but in emission. The double peaked emission lines would not be compatible with the stellar spot hypothesis, unless the stellar surface is extended to at least a few times the stellar radius.
The line profiles are asymmetric between the blue and the red peaks. Figure 5 shows the blow-up view of the spectra near (6) v=2-1 (4.6675 m). There are minor contributions from (14) v=3-2 and (23) v=4-3 at 4.6665 m and 4.6670 m, respectively. The asymmetric line profile, however, cannot be fully explained by changing the vibrational temperature, thus the relative contribution of the three lines. The line profile is fitted better if we artificially introduce intrinsic asymmetry in the Keplerian line profile by modulating the azimuthal intensity distribution sinusoidally [, where is the asymmetric factor] by down to 0.6. Asymmetries in infrared CO line emission have been found by Goto et al. (2006) in HD 141569 A, where the v=2-1 emission is three times brighter in the northern disk than in the southern disk in the spatially resolved spectroscopy. Pontoppidan et al. (2008) proposed that the transition disks around SR 21 and HD 135344B have azimuthal structures, as the spectroastrometric signal of CO v=1-0 is asymmetric, which is consistent with the millimeter dust continuum imaging (Brown et al., 2009). The line asymmetry of EX Lupi varies with time.
4.1.2 Narrow Line Emission
The single peak profile of the narrow line emission with 50 km s-1 line-width in FWHM defies pure Keplerian rotation modeling, if the line intensity decreases as a power law of the radius. Instead, the line width is simply taken as the orbital velocity of the gas, and is translated to the disk radius of 0.4 AU, using the same inclination angle as the broad line emission. FWHM was used instead of FWZI, as the latter is hard to measure unambiguously because of the overlap with the broad line components. The disk radius above does not mean the inner truncation, but a characteristic radius where the narrow line emission arise from. The quiescent line emission comes exclusively from the v=1-0 transition with no obvious higher vibrational transitions. Except the emergence of absorption at the blue shoulder implying a disk wind, no significant changes are found either in the equivalent width or in the line shape (Fig. 6; Fig. 3, right). Note that the small equivalent width on July 21 is of less significance than other epochs, as the data suffer from the low spectral resolution and the limited signal-to-noise ratio, which makes the removal of the telluric CO absorption challenging. The systematic error brought in by the telluric correction is magnified by the subtraction of the outburst model. The broad line emission is less subject to such problems in the measurements of the equivalent widths. The equivalent width of the narrow line component looks constant in time.
4.1.3 Disk Wind
The model spectra of the broad line emission systematically overestimate the flux of v=1-0 lines in the blue shoulder, and underestimate the red. After subtracting the spectral model, therefore, the v=1-0 lines systematically show a blue depression between 40 and 100 km s-1 with excess emission at the red shoulder at 80 km s-1, which is similar to a P Cyg profile overlaid on the sharp quiescent emission (Fig. 3, right). This blueshifted absorption is more prominent toward the later epoch. The absorption lines can be noted at (21) to (26) on August 21, implying that the absorbing cloud is warm (100 K). The absorption is not likely photospheric, although EX Lupi is an M-type star in its quiescence, as the amount of blueshift is too large. The emergence of blue shifted absorption is also observed in infrared CO spectra of V1647 Ori toward the end of an outburst (Brittain et al., 2007). We infer that the blue absorption in the EX Lupi spectra also represents the disk wind, similarly to the case of V1647 Ori.
4.2. Heating Mechanism
The excitation mechanism of the CO vibrational band is somewhat ambiguous. The elevated accretion energy can be directly converted to the kinetic energy of the gas through the viscous heating. In this case, the broad line emission that we locate at 0.04–0.4 AU traces the region where the accretion rate is high. On the other hand, the connection between the CO emission and the outburst could be indirect. The radiation from the central star, either from the hot accretion funnels or the footprints of the magnetic field lines, is first raised by the high disk accretion. The gas in the disk is heated afterwards by the enhanced irradiation. The primary difference of the two mechanisms is the vertical structure of the temperature that the heating imposes. In the case that the gas is viscously heated by the accretion, the disk is hottest near the mid-plane, and gradually cools down toward the surface. The emergent spectrum should be in absorption, as is the case for FUors (Hartmann, Hinkle, & Calvet, 2004). When the irradiative heating is dominant, the temperature gradient is inverse with emission lines from the upper layer of the disk surface (Calvet et al., 1991a).
The irradiative heating has a few advantages to account for the CO line emission of EX Lupi. First, most of the infrared CO emission lines observed today are thought to come from the hot surface of a disk, irradiatively heated (e.g. Najita et al., 2003). This is fully consistent with the line flux of the narrow line emission closely following the continuum level. A critical problem of the direct heating of gas by the accretion is the cooling time of the outburst. The duration of the EX Lupi outburst as is seen in the visible light curve, is roughly 8 months, from January to August 2008. The viscous time scale on which the gas accretes on the star is given by
for standard prescription of an accretion disk. The viscous time scale at 0.04 AU is 150 to 600 days, depending on from 0.05 to 0.025 at the radius, even for the fastest case with being unity. The observed time scale of the outburst is uncomfortably short compared to the most optimistic case (Juhász et al., 2010).
On the other hand, some features of the EX Lupi outburst are not fully explained by the irradiative heating either. The line flux of both broad and narrow components decline with the visual magnitude and the continuum flux at 5 m (Fig. 6, upper panels), but on the slightly different decay rates. The narrow line emission is diminished by the factor of 4 from April to August (Table 4), which is the same factor with the decline of 5 m continuum flux, while the broad line emission is decreased faster by the factor of 10.
In order to contrast the decay rates, the equivalent widths are calculated in the same manner with the line flux. While the equivalent width of the narrow line emission maintains the level of 1.510-4 m at the end of the outburst (Fig 6, bottom right), where the visible magnitude of EX Lupi returned to 12–13 mag, comparable to the level of the pre-outburst brightness in 2007 (Fig. 1), the equivalent width of the broad line emission declines, keeping pace with the continuum flux at the visual wavelength. The differential time scale of the two line components is not accounted for, if the broad and the narrow line emissions are a single disk component radiatively heated in the identical manner.
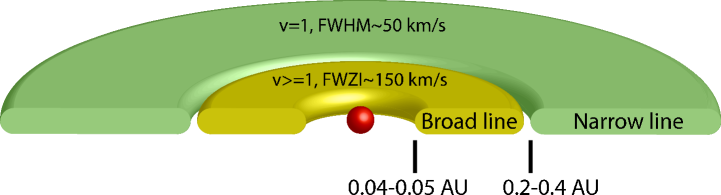
In addition, the excitation state and the kinematics are distinct in two emission components, with no smooth transition between them. The characteristic radius where the narrow line emission arises from is 0.4 AU, and is constant as seen in the stable line width. The radius is immediately outside of the broad line emitting region at 0.04–0.4 AU (Fig. 7). The location of this transition zone is close to the inner-rim of the dust disk found by the SED modeling by Juhász et al. (2010). With the vibrational excitation state upto v=6, and the faster decay of the line flux than the radiatively heated narrow line component, the broad line emission apparently traces the outburst event more directly.

| Epoch | JD | Line flux | Equivalent width | |||
|---|---|---|---|---|---|---|
| [10-12 Wm-2m-1] | [10-17 Wm-2] | [10-4 m] | ||||
| v2aaIntegrated over 120 km s-1. | v1-0bbRotational excitation temperature from the population diagram in Fig. 4. | v2 | v1-0 | |||
| 28 Apr 2008 | 2454585 | 4.5 | 9.7 1.8 | 8.3 0.8 | 1.6 0.3 | 1.4 0.1 |
| 21 Jul 2008 | 2454669 | 3.4 | 4.9 2.5 | 2.7 0.6 | 1.4 0.7 | 0.8 0.2 |
| 7 Aug 2008 | 2454686 | 1.6 | 5.5 1.0 | 7.5 0.5 | 1.2 0.2 | 1.7 0.1 |
| 14 Aug 2008 | 2454693 | 1.2 | 1.7 0.5 | 2.3 0.2 | 1.0 0.3 | 1.4 0.1 |
| 17 Aug 2008 | 2454696 | 0.4 | 1.0 0.5 | 2.1 0.2 | 0.8 0.4 | 1.6 0.2 |
| 21 Aug 2008 | 2454700 | 0.2 | 0.9 0.4 | 2.2 0.2 | 0.7 0.3 | 1.7 0.1 |
The heating mechanism of similar outburst variables, FUors, is most likely the elevated accretion near the disk-midplane, as the broad and double-peak CO lines in absorption testify (e.g. Hartmann, Hinkle, & Calvet, 2004). To the contrary, the CO vibrational lines of EX Lupi are observed in emission in both overtone (Kóspál et al., 2010) and fundamental bands. The critical difference that might explain the emergent spectra of the two classes of the outburst variables is the optical depth of the disk. The broad line emitting region of EX Lupi is likely free of dust as is discussed above. The SED analysis by Juhász et al. (2010) also excludes the optically thick continuum emission either by gas or by dust grains within 0.3 AU during the outburst. Moreover, the accretion rate during the outburst is a few orders magnitude smaller in EX Lupi ( yr-1) than FUors ( yr-1), implying the lower disk surface density. The disk close to the midplane that is viscously heated by the accretion might be more exposed to the surface in the case of EX Lupi, which possibly makes the CO vibrational band observed in emission.
4.3. Origin of Outburst
Let us extend our speculation to the trigger of the outburst, taking the physical scale of it being traced by the broad line emission. The physical size of the outburst on the scale of 0.2–0.4 AU argues against mechanisms that predict a global disk instability. Bonnell & Bastien (1992) proposed that a binary system can tidally disrupt the disks of each other in a close encounter, and temporarily increase the accretion rate up to 10 yr-1. The tidal disruption by a companion is attractive because it naturally explains the repetitive nature of EXor outbursts. The binary fraction among low-mass pre-main sequence stars is indeed high (e.g. Ghez et al., 1993). FU Ori, the prototype FUor, has a close companion (Wang et al., 2004), and there are even FUor-like binaries where both of the binary components are FUor-like, which is statistically unlikely if two are randomly paired (Reipurth & Aspin, 2004). The gravitational disruption by a binary companion may work for the present case as a trigger of the disk instability combined with other mechanisms, but most likely does not explain the small radius of the high mass-accretion region by itself. No visible (Ghez et al., 1997; Bailey, 1998) or spectroscopic companion (Herbig, 2007) to EX Lupi has been identified as of today.
Vorobyov & Basu (2006) argued that planetary cores – which possibly have already formed in a gravitationally unstable disk – can trigger an FUor outburst when they migrate inward and eventually fall into the central star. Protoplanetary clumps form at 10–50 AU away from the star. The migration from the outer disk over this distance does not explain the discrete boundary at 0.2–0.4 AU either. Their simulation ends at the inner radius of 0.5 AU. Further investigation how the infalling a protoplanetary clump behaves in the final 0.5 AU is awaited.
When mass inflow from the outer disk is faster than what the inner disk can transport further in, the accretion slows down, and piles up material at the boundary between the inner and the outer disk. The elevated surface density triggers a local disk instability, and the accretion mode switches to a higher state. The mass accretion could slow down at a certain radius simply because the disk viscosity is too low, or the viscosity is locally too low because of the decoupling of the disk and the magnetic field, or if the disk has a gap, or if it is magnetically truncated.
The disk viscosity is provided by the coupling of the magnetic field and slightly ionized medium in the MHD instability model. Deep inside the disk where the stellar radiation no longer penetrates, there is a low ionization region called the dead zone, where the viscosity is close to zero. The incoming mass piles up there, until the surface density becomes high enough to heat the disk to 1000 K to restore the coupling with the magnetic field.
A dead zone starts at 0.1 AU, and extends beyond 1 AU in a disk around a solar mass star (Gammie, 1996). The disk instability is triggered at the coldest region of the dead zone near the outer boundary (Armitage et al., 2001). Zhu et al. (2007) constructed a radiation transfer model of the disk around FU Ori in outburst, and calculated the size of the active region to be around 1 AU, which naturally fits with MHD disk instability. The observed transition region of EX Lupi is a few times smaller than the typical size of a dead zone. This may not be surprising, as the luminosity of EX Lupi in quiescence is small as well [ in Gras-Velázquez & Ray (2005), in Sipos et al. (2009)].
Wünsch et al. (2005) discovered another type of instability near the inner edge of the dead zone in their numerical model. When a small perturbation is applied to the height of the dead zone, the mass inflow locally increases while the outgoing mass decreases. The height of the perturbed region grows, until it splits up from the dead zone and triggers a ring instability, or the inner edge of the dead zone starts oscillating radially (Wünsch et al., 2006). This instability works at the correct physical scale of 0.1–0.2 AU with small accretion rates yr-1 which are appropriate for EX Lupi. However, the predicted timescale of the outburst is 100 yrs or longer. This is close to the observed timescales of FUor outburst, but is too long for EX Lupi (1 yr).
When a star is strongly magnetized, the gas infall stops at the radius where the Keplerian angular velocity is equal to the stellar rotation, as the orbital motion of the gas is tied to the star. The matter piles up at the co-rotation radius, until the surface density becomes so high that the thermal pressure of the gas overcomes the magnetic pressure (D’Angelo & Spruit, 2010). This mechanism requires the presence of a strong magnetic field. Among young eruptive stars, FU Ori is the first where a magnetic field was discovered in its disk (Donati et al, 2005). There are no attempts known to date, however, to measure the magnetic field of EX Lupi. The inner rim of the high accretion region we measured (0.04–0.05 AU) translates to a period of 4–5 days assuming Keplerian rotation. The typical rotation time for T Tauri stars is a few days to a week (e.g. Rodríguez-Ledesma et al., 2009). The rotation period of EX Lupi itself is however not known yet.
A self-regulated thermal instability theory assumes relatively high, constant inflow of mass ( yr-1– yr-1, Clarke et al., 1989; Bell & Lin, 1994). The constant mass transportation is hindered at a certain radius, where the viscosity is simply too low to drain the incoming mass in time. The material piles up until the surface density becomes high enough to thermally ionize the gas. Near the ionization front, the disk opacity increases with temperature due to negative hydrogen ions adding continuum opacity (Faulkner, Lin, & Papaloizou, 1983). Thermal instability is triggered by the runaway local heating of the disk. The transition front propagates outward until the instability is suppressed at the radius where the viscous heating is no longer effective to keep the disk warm. The radius at which the thermal instability is turned off is a function of the mass accretion. It is 0.1 AU for a fiducial star of 1 with 3 with a constant mass accretion of (Bell & Lin, 1994).
Self-regulating thermal instability is well studied in the parameter space suited to FUors. The mechanism seems to work with accretion rates from yr-1 to yr-1, and is able to reproduce the observed flaring magnitude at optical wavelengths (5 mag), the rise time to the maximum ( 1 year), and the duration of the outburst (decades to a century). These physical parameters are one order of magnitude smaller in the case of EX Lupi, with the quiescent phase accretion rate being yr-1 (Sipos et al., 2009), which goes up to yr-1 in the outburst (Juhász et al., 2010) with the rise time of a month, and duration of about a year. It is yet to be seen if the self-regulating thermal instability works for the small accretion rate with no external triggers to cooperate.
An interesting possible triggering mechanism is an embedded planet. When a protoplanet opens a gap, the mass transportation stops at its outer edge. The mass is banked up until the thermal instability is triggered (Lodato & Clarke, 2004; Clarke & Syer, 1996). With the additional degrees of freedom of the mass of the planet and its location, this model could cover a wider parameter space, and closely reproduce the observed properties of FUor outbursts. The triggering via embedded planet makes the instability propagate initially outside in, and qualitatively reduces the rise time. The smaller the mass of the planet, the smaller the outburst, triggered by the smaller accretion rate. It is still to be seen though, if the mechanism works for EX Lupi, as the exact parameter space of EX Lupi outburst is not covered in the models by Lodato & Clarke (2004).
4.4. Variation of Line Profile Asymmetry
Nevertheless, a possible planet in the disk is interesting in connection with the temporal variation of the line symmetry in CO emission spectra (Fig. 5). The line asymmetry indicates that the receding side of the disk was brighter on August 7, but by August 14 the approaching side became brighter. The receding part is again brighter 3 days later, which again moved to the other side in 4 days. The modulation of the line profile on the timescale of 3–4 days was known in the visible spectra of FU Ori and V1057 Cyg. Herbig, Petrov, & Duemmler (2003) discussed two possible origins of the variation, that the modulation comes from the stellar spot and that it comes from the hot spot in the circumstellar disk, which may or may not be related to the hot accretion columns rising out of the disk. In the case of V1057 Cyg, the line modulation is not accompanied by photospheric variability, which makes the stellar spot hypothesis difficult. On the other hand, the line modulation in V1057 Cyg is stable over 3 yrs, which also makes the hot spot on a differentially rotating disk unlikely. The question of whether the hot spot resides on the photosphere or on the disk is therefore still open.
The period of the spectroscopic modulation of EX Lupi is hard to constrain with only six epochs of observations. If we simply take 7 and 3.5 days as half the period of the orbit in the first and the second half of August, the locations of the hot spot are 0.06 and 0.04 AU, respectively. This is within the span of the active disk that we derived from the outburst model, with the latter location close to the inner edge. Further spectroscopic monitoring with finer temporal sampling should be done in order to tell whether this represents real migration of a hot spot in the disk, as well as the theoretical study on the fate of protoplanteary clumps that fall into the star (Vorobyov & Basu, 2006). A more general discussion on the line asymmetry caused by a planet embedded in the disk is found in Regály et al. (2010).
5. Summary
Here is the summary of our results, and possible directions for future investigations.
-
•
We reported the results of a spectroscopic monitoring campaign of EX Lupi in the CO vibrational fundamental band at 4.6–5.0 m. The observations covered six epochs in the outburst, which started in early 2008.
-
•
We detected high temperature CO gas in the emission-line spectra, that apparently consist of two distinct components. The equivalent width of the broad line emission (FWZI km s-1) decays with the visual brightness of the star. The gas is vibrationally hot with the highly excited lines detected up to v=6.
-
•
The line profiles of the broad line component are double peaked, indicating that the gas is in a circumstellar disk. We used a simple slab model to locate the hot gas to the annulus 0.04–0.4 AU. There is strong asymmetry in the line profiles that varies with time on the order of days to week, implying the presence of a hot spot on the disk.
-
•
There is a second component of the line emission near the systemic velocity of EX Lupi with much narrower line profiles (FWHM50 km s-1). The narrow line emission is vibrationally cool; it exclusively consists of v=1-0 transitions. The line width indicates that the characteristic radius of the emitting gas is 0.4 AU, larger than the radius where the broad line emission arises. The equivalent widths of the narrow lines are constant over the whole observing period.
-
•
An additional disk wind is found as absorption lines centered at 80 km s-1 toward the end of the outburst. A similar disk wind was observed previously in V1647 Ori.
-
•
The two emission components are distinct in the decay rate, the excitation state, and the kinematics. If the broad line emission traces the high accretion region, its compact size favors local disk instabilities where a disk goes through bimodal accretion. Major local disk instability theories, such as thermal instability, magnetohydrodynamical instability, magnetospheric truncation of a disk partially fit to the profile of the outburst, albeit our data did not allow to distinguish between these theories. The origin of the outburst involving global disk instabilities are unlikely.
Most of the disk instability theories today have been tested against FUor outbursts, but little theoretical work has been done for EXors. It is not clear at the moment if the missing proper model for EX Lupi outbursts is due to an intrinsic difficulty in reproducing such small and frequent outbursts with low accretion rate, or is due to a lack of exploration in the parameter space that fits to EXor outbursts. Our attempts to remedy this are also hindered by missing fundamental parameters of EX Lupi. The period of the stellar rotation and magnetism, as well as an accurate simultaneous photometric calibration of the spectra at the time of the observation would help to improve the modeling of the outburst.
References
- Ábrahám et al. (2009) Ábrahám, P., Juhász, A., Dullemond, C. P., Kóspál, Á., van Boekel, R., Bouwman, J., Henning, T., Moór, A., Mosoni, L., Sicilia-Aguilar, A., & Sipos, N. 2009, Nature, 459, 224
- Aikawa & Nomura (2007) Aikawa, Y., Nomura, H. 2006, ApJ, 642, 1152
- Armitage et al. (2001) Armitage, P. J., Livio, M., & Pringle, J. E. 2001, MNRAS, 324, 705
- Aspin, Beck, & Reipurth (2008) Aspin, C., Beck, T. L., & Reipurth, B. 2008, AJ, 135, 423
- Bailey (1998) Bailey, J. 1998, MNRAS, 301, 168
- Bell & Lin (1994) Bell, K. R., & Lin, D. N. C. 1994, ApJ, 427, 987
- Bell, Lin & Ruden (1991) Bell, K., R., Lin, D. N. C., & Ruden, S. P. 1991, ApJ, 372, 633
- Bonnell & Bastien (1992) Bonnell, I., & Bastien, P. 1992, ApJ, 401, L31
- Bonnet et al. (2004) Bonnet et al. 2004, The ESO Messenger, 117, 17
- Brittain et al. (2007) Brittain, S., Rettig, T. W., Simon, T., Balsara, D. S., Tilley, D., Gibb, E., & Hinkle, K. 2007, ApJ, 670, L29
- Brown et al. (2009) Brown, J. M., Blake, G. A., Qi, C., Dullemond, C. P., Wilner, D. J. , & Williams, J. P. 2009, ApJ, 704, 496
- Calvet et al. (1991a) Calvet, N., Hartmann, L., & Kenyon S. J. , 1991, ApJ, 383, 752
- Calvet et al. (1991b) Calvet, N,. Patino, A., Magris, G. C., & D’Alessio, P. 1991, ApJ, 380, 617
- Clarke et al. (1989) Clarke, C. J., Lin, D. N. C., & Papaloizou, J. C. B. 1989, MNRAS, 236, 495
- Clarke & Syer (1996) Clarke, C. J. & Syer, D. 1996, MNRAS, 278, L23
- D’Angelo & Spruit (2010) D’Angelo, C. R., & Spruit, H. astro-ph/arXiv:1001.1742
- Donati et al (2005) Donati, J.-F., Paletou, F., Bouvier, J., & Ferreira, J. 2005, Nature, 438, 466
- Faulkner, Lin, & Papaloizou (1983) Faulkner, J., Lin, D. N. C., & Papaloizou, J. 1983, MNRAS, 205, 359
- Fedele et al. (2007) Fedele, D., van den Ancker, M. E., Petr-Gotzens, M. G., & Rafanelli, P. 2007, A&A, 472, 207
- Gammie (1996) Gammie, C. F. 1996, ApJ, 457, 355
- Ghez et al. (1997) Ghez, A. M., McCarthy, D. W., & Patience, J. L. 1997, ApJ, 481, 378
- Ghez et al. (1993) Ghez, A. M., Neugebauer, G., & Matthews, K. 1993, AJ, 106, 5
- Goorvitch (1994) Goorvitch, D., 1994, ApJS, 95, 535
- Goto et al. (2006) Goto, M., Usuda, T., Dullemond, C. P., Henning, Th., Linz, H., Stecklum, B., & Suto, H. 2006, ApJ, 652, 758
- Gras-Velázquez & Ray (2005) Gras-Velázquez, Á., & Ray, T. P. 2005, A&A, 443, 541
- Greene, Aspin, & Reipurth (2008) Greene, T. P., Aspin, C., & Reipurth, B. 2008, ApJ, 135, 1421
- Hartmann & Kenyon (1996) Hartmann, L., & Kenyon, S. J. 1996, ARA&A, 34, 207
- Hartmann, Hinkle, & Calvet (2004) Hartmann, L., Hinkle, K., & Calvet, N. 2004, ApJ, 609, 906
- Hayano et al. (2008) Hayano, Y. et al SPIE, 2008, Proc. SPIE, 7015, 25
- Herbig (1950) Herbig, G. H. 1950, PASP, 62, 211
- Herbig (2001) Herbig, G. H., Aspin, C., Gilmore, A. C., Imhoff, C. L., & Jones, A. F. 2001, PASP, 113, 1547
- Herbig (1989) Herbig, G. H. 1989, ESO Workshop on Low Mass Star Formation and Pre-Main Sequence Objects, p. 233 - 246
- Herbig, Petrov, & Duemmler (2003) Herbig, G. H., Petrov, P. P., & Duemmler, R. 2003, ApJ, 595, 384
- Herbig (2007) Herbig, G. H. 2007, AJ, 133, 2679
- Herbig (2008) Herbig, G. H. 2008, ApJ, 135, 637
- Juhász et al. (2010) Juhász, A., et al. 2010, in prep.
- Käufl et al. (2004) Käufl, H. U., et al. 2004, Proc. SPIE, 5492, 1218 .
- Koornneef (1983) Koornneef, J. 1983, A&A, 128, 84
- Kóspál et al. (2010) Kóspál,Á. et al. 2010, in prep.
- Lodato & Clarke (2004) Lodato, G., & Clarke, C. J. 2004, MNRAS, 353, 841
- Lombardi et al. (2008) Lombardi, M., Lada, C. J., & Alves, J. 2008, A&A480, 785
- Lord (1992) Lord, S. D. 1992, A New Software Tool for Computing Earth’s Atmosphere Transmissions of Near- and Far-Infrared Radiation, NASA Technical Memoir 103957 (Moffett Field, CA: NASA Ames Research Center)
- Najita et al. (1996) Najita, J., Carr, J. S., Glassgold, A. E., Shu, F. H.,& Tokunaga, A. T. 1996, ApJ, 462, 919
- Najita et al. (2003) Najita, J., Carr, J. S., & Mathieu, R. D. 2003, ApJ, 589, 931
- Ossenkopf & Henning (1994) Ossenkopf, V., & Henning, Th. 1994, A&A, 291, 943
- Reipurth & Aspin (2004) Reipurth, B., & Aspin, C. 2004, ApJ, 608, L65
- Rettig et al. (2004) Rettig, T. W., Haywood, J., Simon, Th., Brittain, S. D., & Gibb, E. 2004, ApJ, 616, L163
- Regály et al. (2010) Regály, Zs. et al. in press.
- Rodríguez-Ledesma et al. (2009) Rodríguez-Ledesma, M. V., Mundt, R. & Eislöffel, J. 2009, A&A, 502, 883
- Petrov & Herbig (2008) Petrov, P. P., & Herbig, G. H. 2008, AJ, 136, 676
- Pontoppidan et al. (2008) Pontoppidan, K. M., Blake, G. A., van Dishoeck, E. F., Smette, A., Ireland, M. J., & Brown, J. 2008 ApJ, 684, 1323
- Sicilia-Aguilar et al. (2010) Sicilia-Aguilar, A. et al. 2010, in prep.
- Sipos et al. (2009) Sipos, N., Ábrahám. P., Acosta-Pulido, J., Juhász, A., Kóspál, Á., Kun, M., Moór, A., & Setiawan, J. 2009, A&A, 507, 881
- Tatum (1966) Tatum, J. B., 1966, Publ. Dom. Astrophys. Obs. Victoria, 13, 1
- Tokunaga et al. (1998) Tokunaga, A. T., et al. 1998, Proc. SPIE, 3354, 512
- Tokunaga (1999) Infrared Astronomy, in Chapter 7 pp.143-164, ’Allen’s Astrophysical Quantities Fourth Edition’ ed. A. N. Cox Springer-Verlag, New York, Berlin, Heidelberg
- Vorobyov & Basu (2006) Vorobyov E. I., & Basu, S. 2006, ApJ, 650, 956
- Wang et al. (2004) Wang, H., Apai, D., Th. Henning, & Pascucci, I. 2004, ApJ, 601, L83
- Wünsch et al. (2006) Wünsch, R., Gawryszczak, A., Klahr, H,. Różyczka, M. 2006, MNRAS, 367, 773
- Wünsch et al. (2005) Wünsch, R., Klahr, H,. Różyczka, M. 2005, MNRAS, 362, 361
- Zhu et al. (2009) Zhu, Zhaohuan, Espaillat, C., Hinkle, K., Hernandez, J., Hartmann, L., & Calvet, N., 2009, ApJ, 694, L64
- Zhu et al. (2007) Zhu, Zhaohuan, Hartmann, L., Calvet, N., Hernandez, J., Muzerolle, J., & Tannirkulam, A.-K. 2007, ApJ, 669, 483