Alex.Lobel@oma.be; alobel@sdf.lonestar.org
Oscillator strength measurements of atomic absorption lines from stellar spectra††thanks: Based in part on observations made with the Mercator Telescope, operated on the island of La Palma by the Flemish Community, at the Spanish Observatorio del Roque de los Muchachos of the Instituto de Astrofísica de Canarias.
Abstract
We develop a new method to determine oscillator strength values of atomic absorption lines with state-of-the-art detailed spectral synthesis calculations of the optical spectrum of the Sun and of standard spectral reference stars. We update the log(gf)-values of 911 neutral lines observed in the KPNO-FTS flux spectrum of the Sun and high-resolution echelle spectra (=80,000) of Procyon (F5 IV-V) and Eri (K2 V) observed with large signal-to-noise (S/N) ratios of 2,000 using the new Mercator-Hermes spectrograph at La Palma Observatory (Spain).
We find for 483 Fe i, 85 Ni i, and 51 Si i absorption lines in the sample a systematic over-estimation of the literature log(gf)-values with central line depths below 15 %. We employ a curve-of-growth analysis technique to test the accuracy of the new oscillator strength values and compare calculated equivalent line widths to the Moore, Minnaert, & Houtgast atlas of the Sun.
The online SpectroWeb database at spectra.freeshell.org interactively displays the observed and synthetic spectra and provides the new log(gf)-values together with important atomic line data. The graphical database is under development for stellar reference spectra of every spectral sub-class observed with large spectral resolution and S/N ratios.
1 Introduction
Accurate oscillator strength values are of central importance for the analysis and interpretation of astrophysical spectra. Detailed radiative transfer modeling of the profiles of absorption and emission lines observed in the spectrum of the Sun and stars requires reliable atomic data to correctly infer the physical properties of the atmospheric line formation region. These data are however currently unavailable for a large fraction of the weak and medium-strong absorption lines observed in optical stellar spectra. In recent years a number of online databases have become available that offer atomic line data compiled from a large variety of sources in the scientific literature, such as nist, vald, the Kurucz website, Topbase, etc. Thanks to the efforts of the atomic database developers the detailed synthesis of stellar spectra has become much more accessible to astrophysicists without having to fully address the fundamental atomic physics needed to acquire these important atomic input data. On the other hand, the successful application of publicly available atomic databases entirely depends on the quality of the data compiled in them, but which is frequently not (or more appropriately cannot always be) guaranteed.
The demand for spectral standard star atlases is steadily increasing with the fast improvements of resolving power and the quality by which stars of all spectral types are observed with modern spectrographs. Printed atlases of stellar spectra often only provide a small list of identified features without an assessment of the reliability of the spectral line identifications. Users often have no means to determine if the spectral line identifications are valid, or if they have been revised since publication. On the other hand, many atomic databases offer line data (that can be text queried online) based in part on theoretical calculations that have not been tested against observed stellar spectra. Users cannot readily verify the quality of the line data, or if it applies to their spectroscopic observations. The data can contain line identifications that do not apply to an observed stellar spectrum because of unknown atmospheric formation conditions or elemental abundance differences with the solar values. Conversely, observed spectral features often cannot be identified because the quality of the provided atomic and molecular line data is limited and requires further improvements.
In this paper we present a critical evaluation of 911 oscillator strength values of astrophysical importance based on detailed spectral synthesis calculations of the weak and medium-strong neutral lines spectrum of the Sun between 400 nm and 680 nm, and of two bright spectroscopic reference stars, Procyon and Eri, observed with large spectral dispersion, and with S/N ratios exceeding 2,000. The observed and best-fit theoretical spectra are publicly available in the online SpectroWeb111alobel.freeshell.org/spectrowebl.html database [1]. Users can directly assess the quality of the absorption line identifications by comparing the observed spectra with state-of-the-art computed spectra. The graphical web interface enables users to select 10 or 25 Å wide spectral regions-of-interest from an interactive list of observed wavelengths, together with the employed atomic line data. We investigate the accuracy of the log(gf)-values obtained with best fits to the observed spectra using an average curve-of growth analysis method. We also discuss a comparison of computed and observed line equivalent widths to investigate remarkable trends in a number of important neutral elements that reveal systematic over-estimations of literature (e.g., that are offered in online atomic databases) log(gf)-values for weak Fe i, Ni i, and Si i lines with central line depths below 15 %.
2 Observations
We observe the optical spectra of the white F5-type main sequence star Procyon ( CMi A; HD 61421) and the narrow-lined K2-type dwarf Eri (HD 22049) with the new Hermes spectrometer on the 1.2 m Mercator telescope at La Palma Observatory, Canary Islands. The instrument is a prism-cross-dispersed fiber-fed bench-mounted echelle spectrograph that observes the complete wavelength range from 377 nm to 900 nm in a single exposure. In high-resolution mode the spectral resolving power is =80,000 using a 2.5 arcsec fiber equipped with an image slicer and optimized for very high efficiency of 25% in the optical band. For Procyon () we achieve a combined S/N ratio2,200 with 50 consecutive exposures of 20 seconds, while for Eri () the S/N ratio2,000 with 20 exposures of 160 seconds.
The spectra are calibrated with a data reduction pipeline developed at the ROB. The typical echelle pipeline calibration steps are performed starting with bias subtraction, optimal order extraction, division of the science exposures with an averaged flat-field frame, and followed by the order wavelength calibration using a Th-Ar lamp spectrum. The flat-fielding step also removes the blaze-function before co-addition of all exposures. It yields a final 1-D order-merged spectrum with a rather characteristic low-frequency shape we utilize for an initial estimate of the complete continuum flux normalized spectrum. Careful design including efficient baffling and use of high-quality optical components, allow Hermes to deliver very clean spectra, comparing favorably with many other echelle spectrographs. The distribution of scattered light in the spectrograph is very local. The inter-order background signal fluctuates around 0.1 % of the flux in the adjacent orders [2].
The high-resolution spectrum of the Sun observed in 1981 with the NSO/KPNO Fourier Transform Spectrograph (FTS) at the McMath-Pierce Solar Facility is offered in [3]. The spectral resolution of the FTS flux spectrum is 350,000, with an estimated S/N ratio2,500. More information about the calibration of the solar intensity (averaged over the solar disk) atlas is provided in [4].
3 Continuum normalization and spectrum synthesis calculations
An important problem for modeling absorption lines in large S/N ratio spectra is the flux normalization to the stellar continuum flux level. The placement of continuum is crucial for accurate improvements of atomic line data with detailed synthesis calculations. Firstly, we apply a standard continuum normalization procedure to the Hermes spectra. The initial normalization step is fully automated because the blaze-function is very precisely removed. It searches for continuum flux reference points in pre-selected wavelength regions void of broad stellar lines and telluric absorption features, and computes the overall shape of the spectrum using a mean weighted flux method. The normalized fluxes are generally very accurate. In the second normalization step the observed spectra are correlated with synthetic spectra which improves the accuracy of the placement of the continuum level to typically 1%-2%.
The synthetic spectra are calculated with the LTE radiative transfer scanspec222alobel.freeshell.org/scan.html code. The code is based on the older scan code ([5]), extensively used for studies of microturbulence velocities in massive cool stars. It iteratively solves the Milne-Eddington LTE transfer equation in 1-D stellar atmosphere models[6]. Important line broadening effects for strong resonance lines and the stellar continua are treated, which also incorporates an opacity distribution function. The equation of state includes the most important hydrides, , CN, CO, and a number of oxides with updated partition functions. Hyperfine splitting in Mn i, Cu i, Co i, and in lines of some other elements is currently not treated. The line-of-sight microturbulence velocity is assumed to be constant with depth in the atmosphere model. Extensive statisitcal studies with scan of the formation of optical Fe i and Fe ii lines observed in Canopus [7] and in Leo [8] show that the microturbulence velocities are practically constant with depth in 1-D atmosphere models of these stars.
We use atmosphere model parameters for the Sun of ( in K, log in , in ) = (5777, 4.438, 1.1). For Procyon we use (6550, 4.0, 1.2), and (5050, 4.5, 0.55) for Eri. The microturbulence velocities are varied until an overall best fit to the observed spectra is obtained. The synthetic spectra are convolved with the geometric mean of the sin and macroturbulence velocity values. 2.5 is used for the Sun, 3.6 for Procyon, and 2.3 for Eri. Notice the small broadening in Eri (i.e., [9] finds sin=2 ) yielding the very narrow absorption lines in this orange-red dwarf 700 K cooler than the Sun. The theoretical spectra are convolved with the appropriate filter functions that simulate the instrumental resolving power.
We adopt the line broadening parameters (the four line damping constants) in the vald-2[10] database. The input values of log(gf), the line rest wavelengths, and the transition energy levels are adopted either from nist, vald-2, or the Kurucz website, providing the best initial fit to the observed absorption line positions and depths. A large number of diatomic molecular lines of [11] is also included to improve the computed fluxes due to weak molecular background absorption we clearly observe in Eri. The spectra are currently computed for solar elemental abundance values with atmosphere models of [M/H]=0.0. We use surface abundance values of [12] for consistency with the models. For example, we adopt an iron abundance of 7.67, instead of the more recent and appreciably smaller (meteoritic) value of 7.5 [13]. Procyon and Eri have published metallicities essentially equal to the solar values. [14] finds [Fe/H]=0.010.08 for Eri (see also [16]). [15] provides [Fe/H]=0.040.06. [16] derives for Procyon an average iron abundance from Fe i lines identical to the solar value. More recently, [17] applied an iron surface abundance of [Fe/H]=0.050.03.
Variability of the spectral line depths or shapes is not observed in these optically bright dwarfs. Observations with the Hipparcos satellite in 1990-1993 reveal only small variability with for Procyon, and for Eri (see [18]). [19] find a granulation signal in Procyon observed with the WIRE satellite over 10 days. Variability in the visual brightness curves with very small amplitudes of 8.52 ppm are found to be consistent with possible stellar p-mode oscillations. [20] observe =- over 10 to 12 days attributed to the rotation of small surface starspots on Eri.
4 Log(gf) measurements in the Sun, Procyon, and Eri
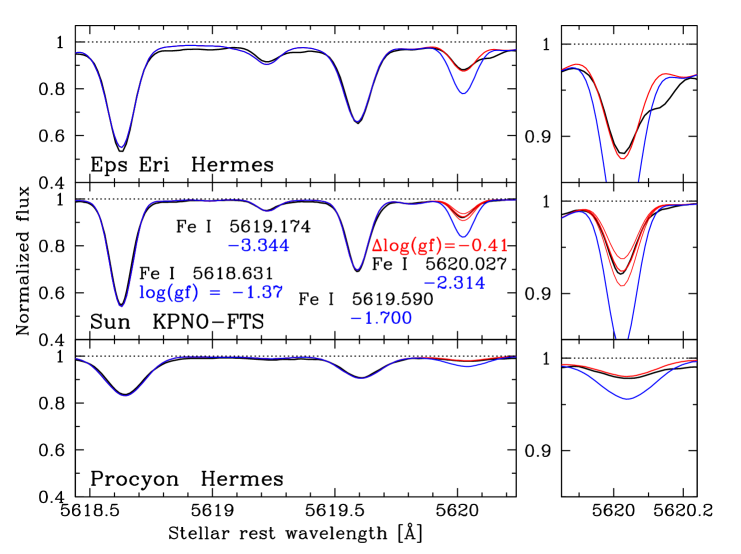
We show in Fig. 1 a comparison of computed and observed spectra of Eri (top panels), the Sun (middle panels), and Procyon (bottom panels) for 1.8 Å around 5619 Å. The observed spectra (solid black lines) show two weak (=5619.174 Å and 5620.027 Å), and two medium-strong Fe i absorption lines (=5618.631 Å and 5619.590 Å). The line depths and shapes of three lines in the theoretical spectra (solid blue lines) correctly fit (e.g., within 1% to 2%) the observed spectra of the three stars using literature (viz. atomic database) log(gf)-values. The weak Fe i line at 5620.027 Å, however, does not fit the observed line depths. The line with adopted log(gf)=2.324 is computed 10% too strong in Eri, 9% in the Sun, and 3% in Procyon. We iteratively adapt the log(gf)-value until we find a best fit to the depth of the line observed in the three spectra. We obtain the best fit for log(gf)=2.724 (solid red lines), or by decreasing the initial log(gf)-value with log(gf)=0.41. To limit long iteration times the minimum step size is set fixed to 0.1 dex, except for the final iteration step size which is determined by linear interpolation. For comparison we also show the line computed in the solar spectrum with log(gf)=2.7240.1 (thin drawn solid red lines in the middle panels).
We perform the iterative log(gf)-adjustment procedure for 911 neutral lines observed between 400 nm and 680 nm. The measured lines are almost uniformally distributed over this range of wavelengths. Figures 2 & 3 of [21] show a somewhat smaller number of medium-strong Fe i lines we adjust longward of 600 nm because the total number of medium-strong lines also decreases over this wavelength range.We select lines with clearly observed flux minima, if possible rejecting strong blends. We do not select strong lines on the root part of the curve of growth (c-o-g). All selected lines are on the linear part and a small number are on the lower portion of the flat part of the c-o-g (Sect. 5). We reject candidate lines with nearby telluric features or that reveal obvious contamination.
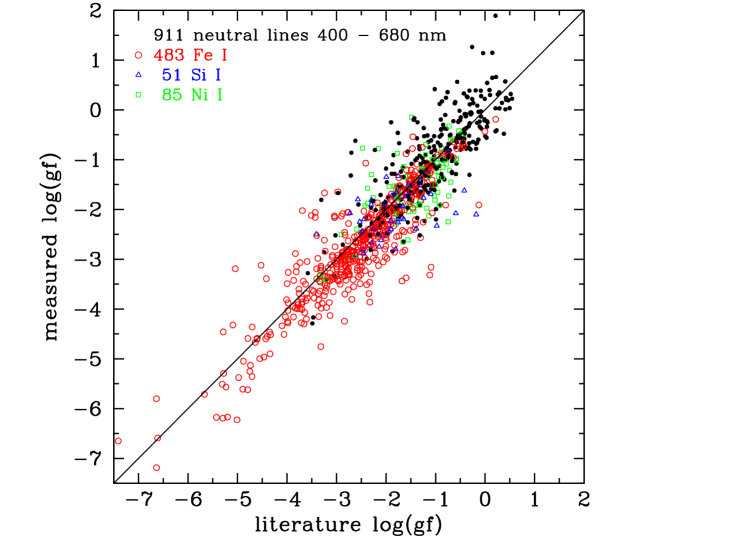
We find a remarkable systematic trend in the log(gf)-values (hereafter called ‘s’) in Fig. 2. The major fraction of weak lines in the sample of 911 neutral lines have adopted log(gf)-values we must substantially decrease to correctly fit the line depths observed in the three stars. The log(gf)-values we measure for 483 Fe i lines (open red circles) are on average below the diagonal, and the s become systematically more negative towards smaller log(gf)-values below 2. The log(gf)-values we measure for 51 Si i lines (open blue triangle symbols) and for 85 Ni i lines (open green square symbols) are on average smaller than the literature log(gf)-values. However, towards the stronger lines (e.g., log(gf) 2) we measure log(gf)-values that on average exceed the literature values, or the medium-strong lines of the sample require systematically more positive -values (solid black symbols).
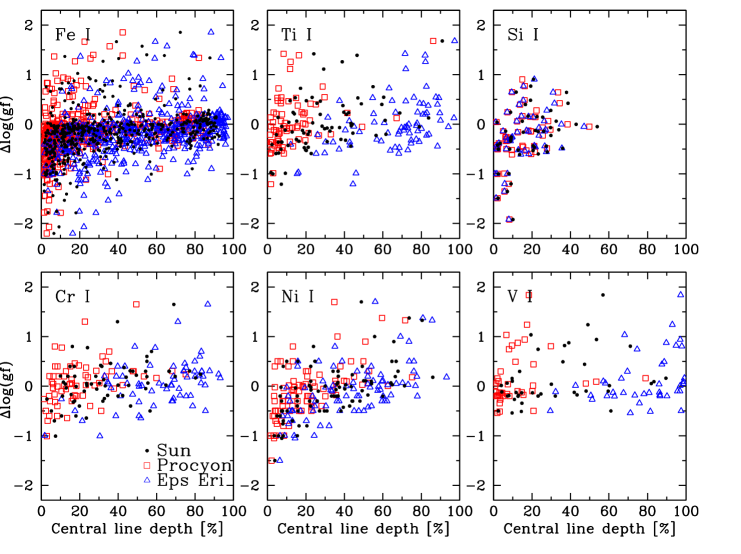
Figure 3 shows a plot of the s with the (computed) central depths of the atomic lines we adjust in the three stars. Note that the continuum normalized line depths are computed without instrumental broadening. We observe systematic trends of more negative s towards weaker Fe i (upper left-hand panel) and Ni i lines (lower middle panel). The trends are more obvious in Eri (open blue triangle symbols) than in the Sun (solid black symbols) (and Procyon) because the neutral lines spectrum is stronger in cooler stars. Smaller systematic trends are also observed in lines of two other important iron-peak elements Ti i (82 lines) (upper middle panel) and Cr i (75 lines) (lower left-hand panel). However, we do not find a similar systematic trend in 41 measured V i lines (lower right-hand panel) of our sample. We investigate the lines of 13 other neutral elements but do not statistically significantly detect systematic trends, except for 47 Co i lines for which we measure a rather weak trend.
In the next section we investigate possible causes for the systematic trends in Fe i and Si i lines for which we adjust the log(gf)-values adopted from atomic databases. For this purpose we compare computed and observed (e.g., published) equivalent line widths. We show that the remarkable trends cannot be attributed to large systematic errors in the spectrum synthesis calculations.
5 Observed equivalent line widths and curve of growth analyses
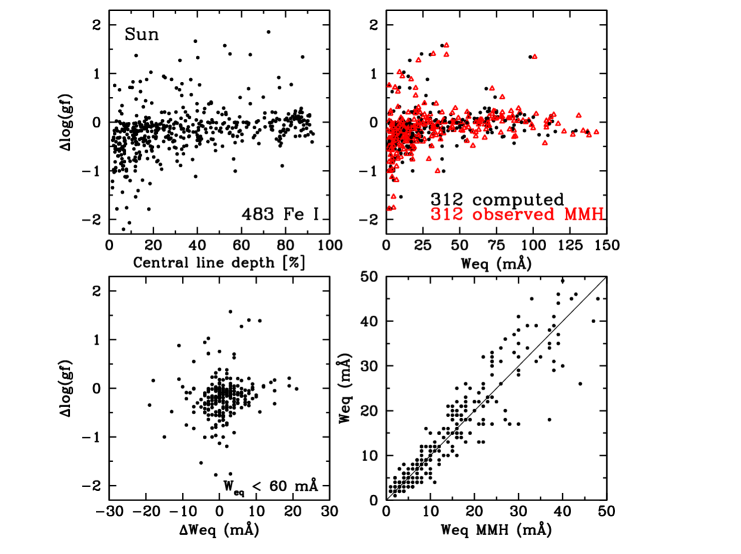
We investigate the systematic trends in the s of Fe i and Si i lines by comparing with the equivalent line widths (Weq) observed in the Sun by [22] (hereafter MMH). The MMH atlas offers observed Weq-values (and reduced widths) of 24,000 (revised) identified solar absorption lines the authors systematically measure with a procedure that can also disentangle blended weak lines. The Weq-values of 312 identified Fe i lines offered in the MMH atlas are calculated with the log(gf)-values we measure in Sect. 4. Figure 4 plots the s with the central depths of 483 lines (upper left-hand panel), and with the Weq-values computed below 150 mÅ for these 312 lines (upper right-hand panel). We find a strong correlation of the computed and observed Fe i Weq-values (lower right-hand panel). The lower left-hand panel shows the s compared to the differences between the observed and computed equivalent line widths (Weq) for Weq 60 mÅ. It reveals that there are no systematic dependences of the s on the Weq-values. We find that the (Weq, )-values are nearly symmetrically distributed around the center-of-gravity of the points cloud. The mean difference between observed and computed Weq-values is 5 to 10 mÅ, with maximum Weq-values below 20 mÅ for the strongest lines of the sample. The near-symmetry of the (Weq, )-values shows that the mean errors of the s for weak lines are essentially randomly distributed. Possible systematic errors in our spectrum synthesis calculations therefore must remain sufficiently small compared to the random errors. Note that such random errors in Weq measurements are often due to inaccurate placements of the local continuum flux level, scattered (stray) light in the spectrograph not precisely removed during spectrum calibration, poor multi-Gaussian fits to overlap of the line wings, unaccounted hidden line blending i.e. from weak unidentified molecular absorption features, etc.
A comparable analysis of 48 Ni i and 31 Si i solar lines in the MMH atlas reveals a similar near-symmetry of the (Weq, )-distributions. It signals that the sources for the systematic trends we measure in these elements are present in the log(gf)-values we adopt from the atomic databases in Sect. 4. We test this hypothesis by calculating the standard mean errors of the log(gf)-values we measure from the observed spectra based on an average curve-of-growth method.
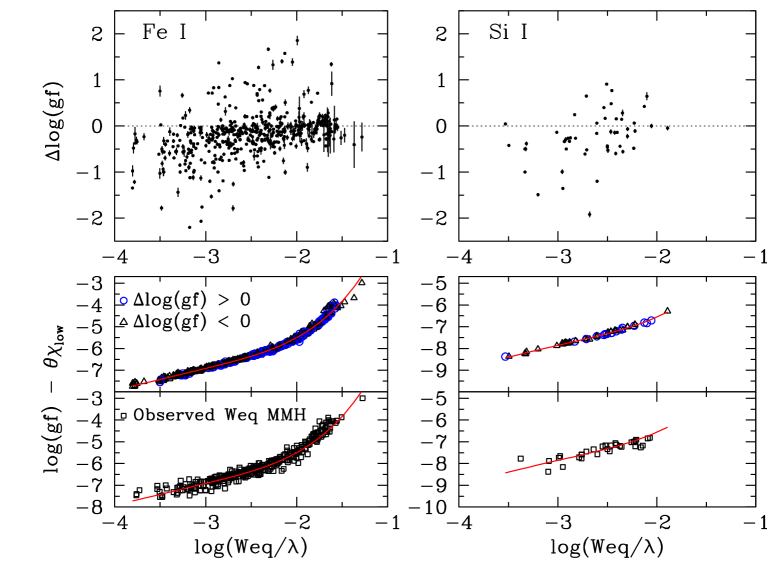
The upper panels of Fig. 5 show the s of 483 Fe i lines (left-hand panel) and of 51 Si i lines (right-hand panel) with the reduced equivalent line width log(Weq/) we compute in the Sun. The middle panels show the corresponding curves-of-growth computed with the log(gf)-values we measure for all lines of each species. The measured log(gf)-values are subtracted by , where is the lower excitation energy level (in eV), and =5040 K / is the inverse temperature. The curves-of-growth of both elements are sharply defined and can be utilized to compute relative errors from the mean of measured log(gf)-values. We compute the mean (curves-of-growth) with a least-squares -order polynomial regression fit to the log(Weq/)-values (solid red lines). We find that medium-strong Fe i lines with log(gf) are on the flat part of the curve-of-growth. On the other hand, all the Si i lines we measure are on the linear part of the curve-of-growth (lower right-hand panel).
For the medium-strong Fe i lines we compute maximum residual errors (relative to the mean curve-of-growth) that are typically a few -values. The residual errors of the measured log(gf)-values are marked with the errorbars in the upper panels. Weak Fe i lines with log(gf) are on the linear part of the curve-of-growth and reveal typical residual errors below one- value of 0.05 to 0.1 dex (they are often smaller than the size of the marked symbols in the upper panel). Hence, the residual error values of the s of the weak lines are typically smaller than the minimum step size of 0.1 dex we apply to iteratively adjust (with a final interpolated step size below 0.1 dex) the log(gf)-values we adopt from atomic databases. It signals that our semi-empirically determined log(gf)-values are accurately measured using the spectral line synthesis iteration method with three stars outlined in Sect. 4.
We compute similar curves-of-growth of all other important neutral elements for which we measure the log(gf)-values in the Sun, Eri, and Procyon. The residual errors of the log(gf)-values of weak lines computed from an average curve-of growth analysis are typically below one- value (0.1 dex). It strongly indicates that the systematic trends we find for the weak Fe i, Ni i, and Si i lines cannot be attributed to large systematic errors in the spectral line synthesis measurement method. The small relative errors of the measured log(gf)-values point to systematic trends in the log(gf)-values we adopt from atomic databases for weak lines with normalized central depths below 15 %.
We also plot for comparison in the lower panels of Fig. 5 the curves-of-growth based on observed Weq-values of 312 Fe i (left-hand panel) and 31 Si i (right-hand panel) lines identified and measured by MMH in the solar spectrum. The standard deviation () of the log(gf)-values we measure with respect to the mean curves-of-growth (solid red lines) are a factor 4 to 5 times larger (0.5 dex) than the -values of 0.1 dex we compute for the curves-of-growth based on computed Weq-values (middle panels). The -values of these curves-of-growth are substantially larger due to random errors in the observed Weq-values compared to computed Weq-values in Fig. 4. The residual errors with respect to the mean are however too small to account for the large log(gf)-values (up to 2 dex) we measure for the majority of weak Fe i and Si i lines. It is of note that the -values of the curves-of-growth based on observed Weq-values are useful to compute absolute errors of log(gf)-values we iteratively measure with the detailed spectral synthesis method. The minimization of the standard deviation of the curves-of-growth is useful to test if stellar atmosphere models with for example depth-dependent microturbulence velocity or elemental abundance gradients can further improve the overall best fits to optical stellar spectra. However, more advanced radiative transfer modeling work (multi-D, non-LTE, etc.) to determine very accurate elemental abundance values from a mean curve-of-growth method should be based on carefully selected sets of spectral lines of which the atomic input data (e.g., log(gf)-values, energy levels, damping constants) are obtained from laboratory measurements. However, laboratory measurements are currently not available for the majority of neutral optical lines of which we adjust log(gf)-values provided in atomic databases. The atomic input data of the lines spectrum has to be predicted with advanced semi-empiric computations using specialized computer codes (i.e. HFR Cowan codes). Such computations of approximate log(gf)-values are very important to provide sufficient amounts of line opacity for stellar spectral synthesis calculations required to develop realistic models of astrophysical stellar plasmas (e.g., thermodynamic models of stellar atmospheres).
A likely source for the systematic trends we find in Fe i, Ni i, and Si i lines therefore is the limited accuracy of predicted log(gf)-values derived from semi-empiric computations of weak lines. For a large number of weak lines only predicted restwavelengths, log(gf)-values, and damping constants are offered in atomic line databases. The accuracy of predicted log(gf)-values for weak lines of atoms with complex energy level structures is known to be limited. We find that they tend to be systematically over-estimated for many weak lines of neutral atoms. The Si i lines we adjust belong to the same multiplets with lower energy levels () high in the atom (i.e. 4.95 eV and 5.619 eV). Semi-empiric computations of predicted log(gf)-values using high energy levels are less accurate. In contrast, we do not find a systematic trend in the s of 41 V i lines because many weak lines we adjust belong to multiplets with -values of 0.27 - 0.30 eV and 1.05 - 1.21 eV, rather close to the ground level. These energy levels, rather low in the atom, are more accurately determined and yield on average predicted log(gf)-values that are more precise. For many high levels it is hard to compute the mixing in the eigenvectors correctly. Since the strengths of weak lines sensitively depend on the mixing the lines have large errors. The problem of the limited accuracy of predicted atomic data for weak optical lines is also clear from the fact that we must remove 7 predicted Si i lines and 14 Fe i lines from the spectrum synthesis input lists because they are not observed in the Sun and other stars.
6 Conclusions
We measure accurate log(gf)-values of 911 atomic absorption lines of neutral elements observed in high-resolution stellar spectra. We perform detailed synthesis calculations of the optical spectrum of the Sun, Procyon, and Eri observed with very large S/N ratios exceeding 2,000. We find systematic over-estimations in the log(gf)-values adopted from atomic databases for weak lines of iron-peak elements (such as Fe i, Ni i, Cr i, and Ti i), and of Si i. We demonstrate that the computed equivalent line widths strongly correlate to observed values previously published for the lines in the optical spectrum of the Sun. An average curve-of-growth analysis reveals that the errors of the log(gf)-values we measure for weak lines are smaller than the standard mean error. The systematic trends we find for weak lines therefore cannot be attributed to large systematic errors in the detailed spectral line synthesis modeling method of the three stars. We attribute the remarkable systematic trends to the limited accuracy of predicted log(gf)-values of weak absorption lines having central depths below 15 % currently offered in online atomic databases. The adjusted log(gf)-values we measure are available in the online SpectroWeb database, together with the observed and computed spectra and the central line depths and equivalent width values computed for the three stars. Further updates of the log(gf)-values and other atomic line data based on accurate laboratory measurements and advanced semi-empiric computations are urgently needed for reliable line identifications in the optical spectra of stars of all spectral subtypes.
Acknowledgements
The author acknowledges funding from the ESA/Belgian Federal Science Policy in the framework of the PRODEX programme (C90290). Mr. P. De Poorter and Mr. T. Hendrix are gratefully acknowledged for assistance with the spectral line measurements. We thank the referees for serveral useful comments and questions. The Hermes project is a collaboration between the KULeuven, the Université Libre de Bruxelles and the Royal Observatory of Belgium with contributions from the Observatoire de Genève (Switzerland) and the Thüringer Landessternwarte Tautenburg (Germany). Hermes is funded by the Fund for Scientific Research of Flanders (FWO) under the grant G.0472.04, from the Research Council of K.U.Leuven under grant GST-B4443, from the Fonds National de la Recherche Scientifique under contracts IISN4.4506.05 and FRFC 2.4533.09, and financial support from Lotto (2004) assigned to the Royal Observatory of Belgium.
References
- [1] Lobel A 2007 Proc. of XXVIth IAU Joint Discussion 4 The Ultraviolet Universe: Stars from Birth to Death 16-17 August 2006 Prague, ed A Gomez de Castro and M Barstow (Madrid: Complutense Univ. of Madrid Publ.) 167
- [2] Raskin G, Van Winckel H, Hensberge H, Jorissen A, Lehmann H, Waelkens C, et al. 2011 Astr. & Astroph, submitted
- [3] Neckel H 1999 Solar Phys. 184 421
- [4] Neckel H and Labs D 1984 Solar Phys. 90 205
- [5] Nieuwenhuijzen H and de Jager C 2000 Astr. and Astroph. 353 163
- [6] Kurucz R L 1994 Solar Abundance Model Atmospheres for 1, 2, 4, 8 km/s (Cambridge, Mass.) Kurucz CD-ROM No. 13
- [7] Achmad L, de Jager C, and Nieuwenhuijzen H 1991 Astr. and Astroph 249 192
- [8] Lobel A, Achmad L, de Jager C, and Nieuwenhuijzen H 1992, Astr. and Astroph 256, 199
- [9] Takeda Y 2007 Publ. Astron. Soc. of Japan 59 335
- [10] Kupka F, Piskunov N E, Ryabchikova, T A, Stemples H C and Weiss W W 1999 Astr. and Astroph. Suppl. Ser. 139 119
- [11] Kurucz R L and Bell B 1995 (Cambridge Mass.) Kurucz CD-ROM No. 23
- [12] Anders E, and Grevesse N 1989 Geochimica et Cosmochimica Acta 53 197
- [13] Grevesse N, and Sauval J 1998 Space Sci. Rev. 85 161
- [14] Heiter U, and Luck R E 2003 Astron. J. 126 2015
- [15] Luck R E, and Heiter U 2006 Astron. J. 131 3069
- [16] Kato K, Watanabe Y, and Sadakane Y 1996 Publ. Astron. Soc. of Japan 48 601
- [17] Kervella P, Thévenin F, Morel P, Berthomieu G, Bordé, and Provost J 2004, Astr. and Astroph. 413 251
- [18] van Leeuwen F, Evans D W, Grenon M, Grossmann V, Mignard F, Perryman M A C 1997 Astr. and Astroph 323 61
- [19] Bruntt H, Kjeldsen H, Buzasi D L, and Bedding T R 2005 Astroph. J. 633 440
- [20] Frey G J, Hall D S, Mattingly P, Robb S, Wood J, Zeigler K, and Grim B 1991 Astron. J. 102 1813
- [21] Lobel A 2008 J. Phys. Conf. Ser. 130 0120215
- [22] Moore C, Minnaert M G J, and Houtgast J 1966, The Solar Spectrum 2935 Å to 8770 Å Nat. Bureau of Standards Monograph 61 (Washington, D.C.: Int. Astron. Union)