First VLBI Detection of the Radio Remnant of Supernova 1987A: Evidence for Small-scale Features
Abstract
We present a detailed analysis of the first very long baseline interferometry (VLBI) detection of the radio remnant of supernova 1987A. The VLBI data taken in 2007 and 2008 at 1.4 and 1.7 GHz, respectively, provide images sensitive to angular scales from 01 to 07, the highest resolution to date at radio frequencies. The results reveal two extended lobes with an overall morphology consistent with observations at lower resolutions. We find evidence of small-scale features in the radio shell, which possibly consist of compact clumps near the inner surface of the shell. These features have angular extent smaller than 02 and contribute less than 13% of the total remnant flux density. No central source is detected in the VLBI images. We place a 3 flux density limit of 0.3 mJy on any pulsar or pulsar wind nebula at 1.7 GHz.
Subject headings:
Instrumentation: high angular resolution — supernovae: individual (SN 1987A) — ISM: supernova remnants1. Introduction
Supernova (SN) 1987A (catalog SN 1987A) in the Large Magellanic Cloud is the only nearby core-collapse supernova observed in the age of modern astrophysical instrumentation and has been intensively studied over the last two decades. Optical observations reveal a triple-ring nebula centered on the supernova, as part of the circumstellar material (CSM) expelled by the progenitor star in its late evolution stage (Crotts & Heathcote, 1991). With a radius of 086, the nebula’s inner ring marks the inner surface of the dense CSM (Plait et al., 1995). Images from the Hubble Space Telescope (HST) show hot spots emerging from the inner ring since 1995 (Lawrence et al., 2000). There are currently about 30 optical hot spots encircling the entire ring (France et al., 2010), which are believed to be clumps of inward-protruding CSM shocked by the supernova blast wave (Pun et al., 2002). In recent years, the interaction between the blast wave and the inner ring has led to a rapid increase in the radio and soft X-ray emission (Zanardo et al., 2010; Park et al., 2007), providing a good opportunity to study the shock interaction with the CSM.
At radio frequencies, the initial outburst was detected with the Molonglo Observatory Synthesis Telescope (Turtle et al., 1987), the radio flux then decayed rapidly and re-emerged in mid-1990, marking the birth of a radio remnant (Turtle et al., 1990). Since then, the source has been monitored regularly with the Australia Telescope Compact Array (ATCA) (see Ng et al., 2008; Zanardo et al., 2010, and references therein). Super-resolved images at 9 GHz reveal a two-lobe structure of the radio shell (Staveley-Smith et al., 1993; Gaensler et al., 1997), which was later confirmed with diffraction-limited images at higher resolutions at 18 and 36 GHz (Manchester et al., 2005; Potter et al., 2009).
High spatial resolution is the key to study the supernova shock evolution and its interaction with the CSM. The first very long baseline interferometry (VLBI) observations of SN 1987A were made 5.2 days after the explosion. Although the radio emission was completely resolved and hence no detection was made, the observations posted a lower limit of km s-1 on the expansion velocity (Jauncey et al., 1988). A subsequent attempt at VLBI in 2003 September also resulted in a non-detection (J. Lovell & R.W. Hunstead 2007, private communication). The first VLBI detection of the radio remnant of SN 1987A was made with the Australian Long Baseline Array (LBA)111http://www.atnf.csiro.au/vlbi/overview/ in 2007, and initial results have been reported by Tingay et al. (2009). In this Letter, we present a detailed analysis of the 2007 dataset, together with new observations in 2008, and present evidence of small-scale features in the radio shell.
2. Observations and Data Reduction
VLBI observations of SN 1987A were carried out on 2007 October 7 and 2008 November 26 at 1.4 and 1.7 GHz, respectively, with about 10 hours integration time each, using part of the LBA including the ATCA ( m antennas used as a tied array in 2007, and 5 antennas in 2008), Parkes (64 m) and Mopra (22 m) telescopes of the Australia Telescope National Facility. The 2008 epoch has additional data taken from the NASA DSS 43 antenna at Tidbinbilla (70 m) for three hours to boost the - coverage and sensitivity. The observation parameters are listed in Table 1, and the - coverage is plotted in Figure 1. The 2007 and 2008 data are centered on 1.382 and 1.666 GHz, respectively, with four dual-polarization intermediate frequencies and a total bandwidth of 64 MHz divided into four bands (except from the Tidbinbilla antenna, where only the left circular polarization is available). A nearby calibrator, PKS 0530727, was observed every 10 minutes for phase referencing purposes.
| Parameter | 2007 | 2008 |
|---|---|---|
| Observation Parameters | ||
| Date | 2007 October 7 | 2008 November 26 |
| Day since explosion | 7531 | 7947 |
| Center frequency (GHz) | 1.382 | 1.666 |
| No. of stations | 3 | 4 |
| Integration time (hr) | 9 | 10 |
| Baseline (k) | 2601250 | 3002510 |
| Baseline-hour | 27 | 36 |
| Best-fit Truncated-shell Parametersaaobtained with (i.e. weighted) fits; difference between the weighted and unweighted fits give the reported uncertainties. | ||
| Radius (″) | ||
| Half-opening Angle (°) | ||
| Thickness (%) | ||
| 0.81/25848 | 0.61/5122 | |
The 2007 observations were made as part of an Express Production Real-time e-VLBI Service (EXPReS) demonstration of a global real-time interferometer. The digital data for four dual-polarization 16 MHz bands were transferred in real time from each antenna in Australia via a dedicated 1 Gbps lightpath to the correlation facility on the opposite side of the Earth (Joint Institute for VLBI in Europe [JIVE] in the Netherlands), using standard gigabit Ethernet network adapters and switches within the observatories. All four stokes parameters were correlated at the European VLBI Network (EVN) MarkIV correlator at JIVE. Technical details on the lightpaths and correlation process have been reported by Tingay et al. (2009). The 2008 observations were performed in regular VLBI mode where the voltage data was recorded on disk, and subsequently correlated at the Curtin University facility.
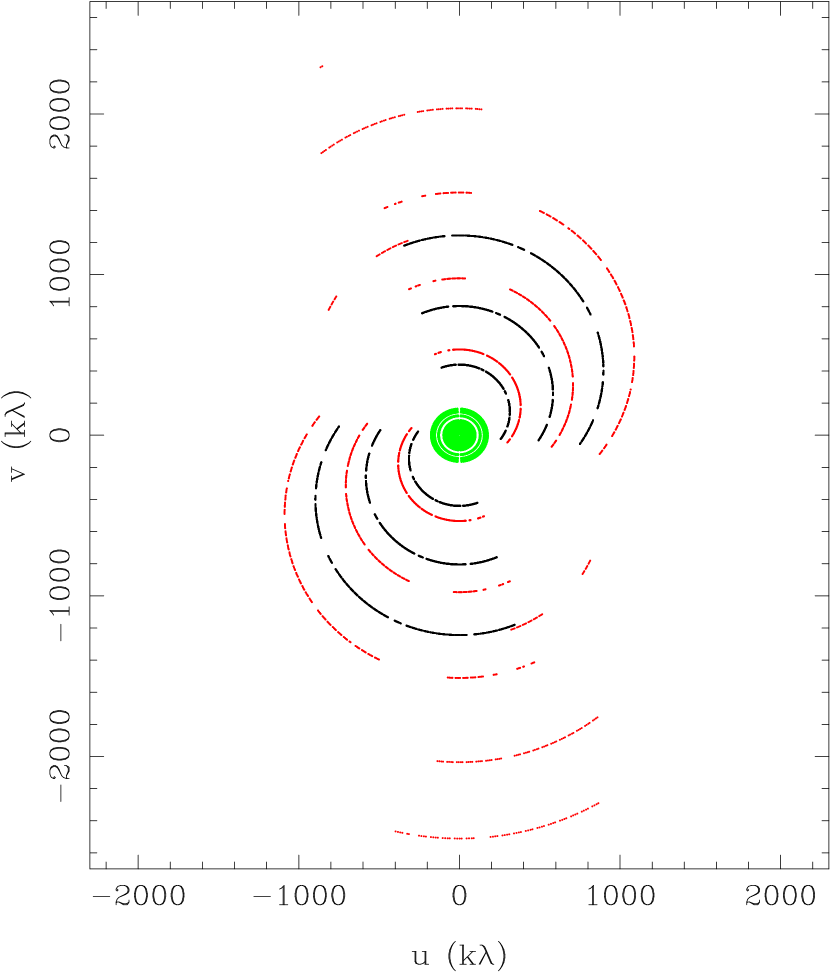
All post-correlation calibration and processing were carried out with the AIPS package. Images were formed with natural weighting and then deconvolved using the CLEAN algorithm (Clark, 1980). We performed self-calibration with a three-minute timescale. Since the calibrator delivers high quality phase corrections, this offers only a minimal improvement to the images. Figure 2a shows the final intensity maps of the 2007 and 2008 observations, which have rms noise of 0.35 mJy beam-1 and 0.1 mJy beam-1, and restoring beams of FWHM and , respectively.
3. Results and Discussion
3.1. VLBI Results and Comparison with Observations at other Frequencies
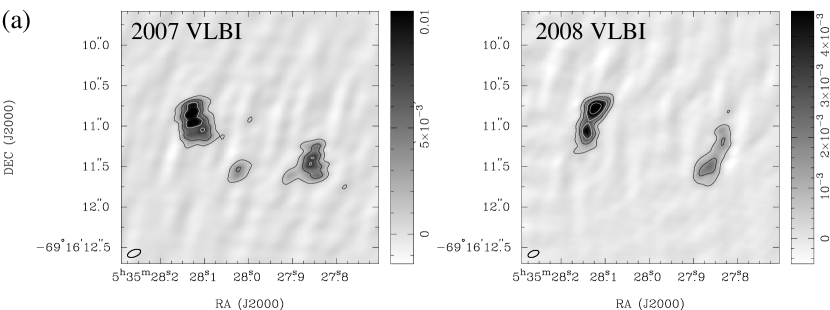
The VLBI images of SN 1987A in Figure 2a clearly resolve the remnant structure and show a two-lobe morphology. The lobes are separated by 15 and are each extended with a size , a few times larger the restoring beams. The eastern lobe has a higher flux density than the western one by a factor of 2.5. There is some hint that the lobes consist of distinct peaks. A comparison between the 2007 and 2008 images show a similar overall morphology, but the lobes in the former appears to be more extended in R.A. and have slightly different orientations than those in the latter. There is also additional emission in 2007 to the south between the two lobes, which is not observed in 2008. We believe that these discrepancies are mostly due to artifacts in the image reconstruction, as a result of sparse - sampling of the data (see Heywood et al., 2009). On the other hand, we argue that the two main lobes are physical, because they are present in both observations which have different hour angle coverage. The total cleaned flux density in the 2007 and 2008 images are 120 and 50 mJy, respectively, much lower than the values 350 and 410 mJy obtained from ATCA monitoring at a similar frequency in the same time period (Zanardo et al., 2010). With a minimum baseline of 300 k, the VLBI observations are insensitive to features larger than . Hence, our result indicates that the majority of the remnant flux density is contributed by smooth diffuse emission of at least a comparable scale, implying a substantial thickness of the radio shell.
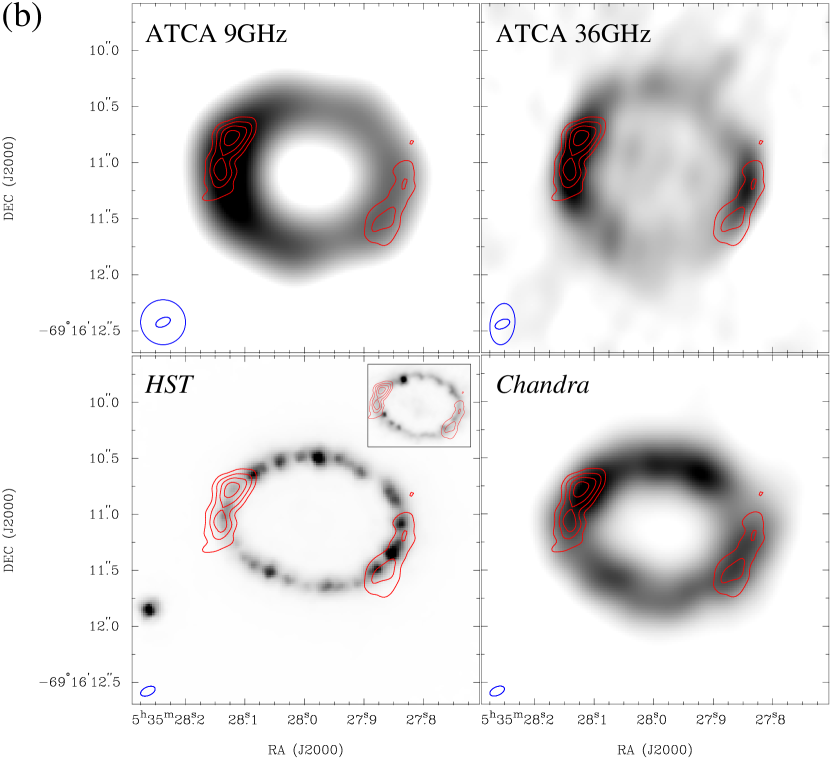
In Figure 2b the 2008 VLBI image is compared to lower resolution ATCA images at 9 and 36 GHz taken at similar epochs (2008 October) (Ng et al., 2008; Potter et al., 2009). Since all these observations are phase-referenced to the same nearby calibrator, we estimate that the astrometric accuracy should be mas and therefore did not perform any manual alignment. The lobes found in the VLBI images closely match the brightest part of the shell at 9 and 36 GHz. However, regions of lower brightness temperature tracing the remainder of the remnant, seen in the latter two images, are not detected in the VLBI observations. This is likely because the large-scale diffuse emission is resolved out in the VLBI images, and any compact features (see §3.3 below) fall below the detection sensitivity. Figure 2b also presents a comparison of the VLBI result to H and X-ray images obtained from the HST and the Chandra X-ray Observatory on 2007 May and 2008 April, respectively (J.C.S. Pun, private communication; Ng et al., 2009). These images were fitted to a simple torus to determine the remnant center, then aligned with the VLBI image using the supernova position reported by Potter et al. (2009). There appears to be no detailed correlation of the brightness distribution at small scales in the radio, optical and X-ray bands. Moreover, the images indicate that the radio shell has a comparable size to the optical inner ring and the X-ray shell. The latter result is consistent with the findings by Ng et al. (2009).
3.2. Fourier Modeling
To quantify the remnant geometry, we employed the Fourier modeling technique described by Ng et al. (2008) to fit the VLBI visibility data with a truncated-shell model tilted at 434 to the line-of-sight (Pun, 2007). The model parameters include the center position, flux, mean shell radius (averaged between the inner and outer shells), half-opening angle, shell thickness, and a linear gradient in the surface emissivity that accounts for the observed asymmetry (see Figure 3 in Ng et al., 2008, for a detailed definition of all these parameters,). Given the limited - coverage of the data, we fixed the gradient using the 9 GHz results (Potter et al., 2009) in order to improve the fit stability. The level of gradient is fixed at 36% (ratio between the surface brightness at the edge and at the center) with a position angle at 109° (measured from the observer’s line-of-sight projected on the shell’s equatorial plane). All other parameters, including position, flux, radius, half-opening angle and thickness, are free to vary in the fit. The values are calculated by weighting the fit residuals with the measurement uncertainties of each data point, which are estimated from the scatter of the visibility amplitudes among the four channels, because information on individual measurement errors were not available. Table 1 summarizes the main results: the best-fit models have radii 082 and 084 in 2007 and 2008, respectively, half-opening angle and thickness of the radius. We note that the measured thickness should be considered only as a lower limit, since the data are insensitive to large-scale structure. The small reduced values suggest that the measurement uncertainties are likely overestimated. To determine the confidence intervals of the best-fit parameters, we scaled the uncertainties such that the reduced , and found very small formal statistical errors. This implies that the systematic errors dominate, which could be introduced by calibration errors or by the weighting scheme of the fits. While the former is difficult to estimate, we attempted to quantify the latter with simple least-square fits (i.e. without weighting). The difference in the model parameters give the uncertainties reported in Table 1.


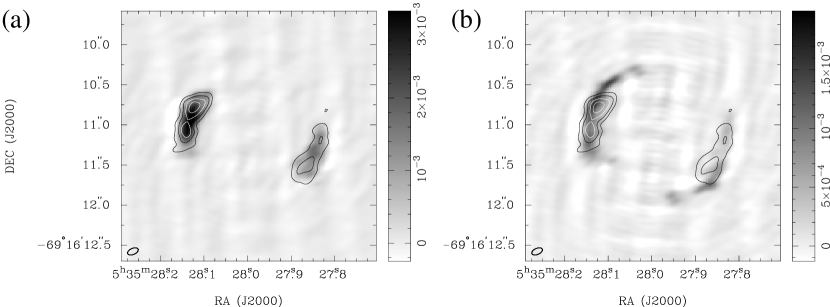
Based on the best-fit model parameters for 2008, we simulated a visibility data set using the - sampling of the 2008 VLBI data. The simulated data were then imaged and deconvolved identically as the real observations, and the resulting image is shown in Figure 3a. The truncated-shell model successfully captures the overall shell morphology, but fails to reproduce the double-peak feature of the eastern lobe. A direct comparison between the best-fit parameters in 2007 and 2008 indicates no significant change in the shell’s geometry. The difference in radius gives an expansion velocity of km s-1, consistent with the result from Ng et al. (2008), within the sizeable error due to the relatively short time period between the observations. The VLBI images show no obvious point source at the remnant center, and the 2008 VLBI image gives a 3 upper limit of 0.3 mJy on the flux density of any possible central object, such as a radio pulsar or pulsar wind nebula at 1.7 GHz.
As listed in Table 1, the best-fit radii are significantly smaller than the value 089 obtained from the ATCA 9 GHz observations in 2008 (Potter et al., 2009). To determine if the discrepancy could be caused by the limited - coverage of the VLBI data, we simulated an image with the best-fit truncated-shell model of the 9 GHz data, and using the 2008 VLBI observations’ - coverage. The result is shown in Figure 3b, clearly indicating a larger shell size than observed. This suggests that if the 9 GHz model were the correct description of the remnant geometry, then the VLBI observations should be able to recover the geometric parameters. We compare in Figure 4a the mean shell radius obtained from Fourier modeling of different radio observations (Ng et al., 2008; Potter et al., 2009), and found that the best-fit radius appears to be largest at 9 GHz and smallest at 1.4 GHz, while the sizes at 18 and 36 GHz are in between.
Discrepancy in shell radius at different frequencies has been claimed for the radio remnant of SN 1993J, with a progressively smaller radius at 5 GHz than at 1.6 GHz since day 1500 (Marcaide et al., 2009).222However, we note that Bartel et al. (2002) did not find such a correlation using the same dataset. A few possible explanations have been proposed, including difference in electron synchrotron lifetimes, a radially increasing magnetic field, or frequency-dependent changes in the opacity of the medium (Marcaide et al., 2009). For our case of SN 1987A, the non-monotonic change of the mean shell radius with frequency presents a more complex picture, suggesting that the above physical explanations may not apply. In Figure 4b we plot the deviation of radius from a linear fit to the 9 GHz radius after day 4000 against the theoretical (i.e. diffraction-limited) angular resolution. We found a trend of decreasing radius as the beam size gets smaller, independent of the observing frequency. We have examined whether biases in our fitting technique may give rise to such a result, but as the fits are carried out in the Fourier domain rather than the image domain, our procedure is relatively immune to this. Therefore, we suggest that measurements at higher spatial resolutions are biased by unmodeled components in the radio emission, likely to be bright knots near the shell’s inner surface.
To test this idea, we tried applying the Fourier modeling to the 18 and 36 GHz ATCA data, but restricted on the - range , corresponding to the same coverage as the 9 GHz ATCA observations. In all cases, this results in a % increase in the best-fit radii when compared to fits on the full dataset, giving values closer to the 9 GHz results, thus, providing further support to the picture above. As a final check, we simulated visibility data based on a toy model of a truncated shell plus few point sources. The shell has a radius of 09 and 10% thickness, and we added four point sources, two at each side, at a distance 08 from the center and with a total flux density of 15% of the remnant. Based on this toy model, we simulated two visibility data sets using the - sampling of the 2008 VLBI and ATCA 9 GHz observations, then applied the Fourier modeling as in the real observations. This gives radii of 085 and 088 for the two simulated data sets, respectively, confirming that our radius measurements made with a truncated shell could be biased by compact features in the remnant, especially at high spatial resolution. This result is consistent with previous findings (Manchester et al., 2002; Ng et al., 2008), in which the radius is always smaller when fitted with a single shell than with a shell plus point sources. We note that although previous results at 9 GHz based on Fourier modeling (e.g. Ng et al., 2008) are likely biased too, our simulations suggest that this is at a much lower level than the VLBI case. Also, the bias is systematic, therefore, it should have a minimal effect on the expansion rate measurements.
3.3. Small-scale Features
Results from the Fourier modeling above present evidence of small-scale features in the radio remnant of SN 1987A. As hinted by the double-peak structure of the radio lobes seen in Figure 2a, these features likely consist of discrete clumps near the inner surface of the shell. To constrain their flux density and spatial extent, we assume an extreme case that all diffuse emission is resolved in the VLBI observations, such that the structure seen in the images represents only the compact emission. We fitted the 2008 VLBI visibility data with a simple model of four Gaussian blobs, two at each lobe, and found that the clumps have size smaller than , with a distance 078-083 from the remnant center, and a total flux density 50 mJy. The size limit is only marginally larger than the restoring beam, and converts to a physical extent cm ( pc) at the distance 51.4 kpc. This is comparable to the scale cm of the optical hot spots, for which hydrodynamic simulations suggest a physical size of cm, too small to be resolved by the HST (Pun et al., 2002). While it is tempting to associate the radio clumps with the optical hot spots, which are dense gas protruding inward from the inner ring, Figure 2b shows no correlation between the radio and optical brightness distribution. Also, the first optical hot spot emerged in the northeast with a position angle 29° (see inset of Figure 2b; Lawrence et al., 2000), significantly offset from the radio peak. Alternatively, the compact radio emission could indicate sites of enhanced cosmic ray acceleration, either with magnetic field amplification or with a local field orientation parallel to the shock normal. Hence, tracing the evolution of the clumps in future observations may give direct constraints on the acceleration time scale and the magnetic field strength (see Uchiyama et al., 2007).
4. Conclusion
In this paper, we present a detailed study of VLBI observations of SN 1987A taken in 2007 and 2008 at 1.4 and 1.7 GHz, respectively. This gives the first VLBI detection of the radio remnant, revealing extended lobes that are consistent with the overall shell morphology in previous radio studies. We found that the Fourier modeling made with a simple truncated shell gives a smaller mean shell radius for the VLBI data than for other radio observations at lower spatial resolutions. This suggest small-scale features in the radio emission that are not captured by the smooth model. These features are likely to be discrete clumps near the shell’s inner surface. We obtain a limit of 02 on their spatial scales, with a flux density limit 50 mJy, corresponding to of that of the remnant.
Although only part of the shell is detected in our VLBI observations, this study demonstrated VLBI imaging as a powerful tool to trace the fine structure of the radio emission. Further observations utilizing the full capability of the LBA, including more antennas and wider bandwidth, will offer images with better sensitivity and resolution. In addition, the on-going interaction between the supernova blast wave and the dense CSM has induced a rapid brightening of the remnant. Altogether, we expect future VLBI images to reveal more clumps around the shell, and potentially their substructure. The new observations will also provide a direct measurement of the remnant’s expansion rate, tracing the shock evolution in the CSM. Finally, we note that if in future the clumps start to dominate the remnant flux, this will have a significant impact on the Fourier modeling of the radio data. In particular, the east-west asymmetry of the shell could depend sensitively on the brightness of individual clumps, as a result, the simple linear gradient approximation used by Ng et al. (2008) may no longer hold.
References
- Bartel et al. (2002) Bartel, N., et al. 2002, ApJ, 581, 404
- Bartel et al. (2007) Bartel, N., Bietenholz, M. F., Rupen, M. P., & Dwarkadas, V. V. 2007, ApJ, 668, 924
- Clark (1980) Clark, B. G. 1980, A&A, 89, 377
- Crotts & Heathcote (1991) Crotts, A. P., & Heathcote, S. R. 1991, Nature, 350, 683
- France et al. (2010) France, K., et al. 2010, Science, 329, 1624
- Gaensler et al. (1997) Gaensler, B. M., Manchester, R. N., Staveley-Smith, L., Tzioumis, A. K., Reynolds, J. E., & Kesteven, M. J. 1997, ApJ, 479, 845
- Heywood et al. (2009) Heywood, I., Blundell, K. M., Klöckner, H., & Beasley, A. J. 2009, MNRAS, 392, 855
- Jauncey et al. (1988) Jauncey, D. L., Kemball, A., Bartel, N., Shapiro, I. I., Whitney, A. R., Rogers, A. E. E., Preston, R. A., & Clark, T. A. 1988, Nature, 334, 412
- Lawrence et al. (2000) Lawrence, S. S., Sugerman, B. E., Bouchet, P., Crotts, A. P. S., Uglesich, R., & Heathcote, S. 2000, ApJ, 537, L123
- Manchester et al. (2005) Manchester, R. N., Gaensler, B. M., Staveley-Smith, L., Kesteven, M. J., & Tzioumis, A. K. 2005, ApJ, 628, L131
- Manchester et al. (2002) Manchester, R. N., Gaensler, B. M., Wheaton, V. C., Staveley-Smith, L., Tzioumis, A. K., Bizunok, N. S., Kesteven, M. J., & Reynolds, J. E. 2002, PASA, 19, 207
- Marcaide et al. (2009) Marcaide, J. M., et al. 2009, A&A, 505, 927
- Ng et al. (2009) Ng, C.-Y., Gaensler, B. M., Murray, S. S., Slane, P. O., Park, S., Staveley-Smith, L., Manchester, R. N., & Burrows, D. N. 2009, ApJ, 706, L100
- Ng et al. (2008) Ng, C.-Y., Gaensler, B. M., Staveley-Smith, L., Manchester, R. N., Kesteven, M. J., Ball, L., & Tzioumis, A. K. 2008, ApJ, 684, 481
- Park et al. (2007) Park, S., Burrows, D. N., Garmire, G. P., McCray, R., Racusin, J. L., & Zhekov, S. A. 2007, in AIP Conf. Proc., Vol. 937, Supernova 1987A: 20 Years After: Supernovae and Gamma-Ray Bursters, ed. S. Immler, K. Weiler, & R. McCray (Melville, NY: AIP), 43
- Plait et al. (1995) Plait, P. C., Lundqvist, P., Chevalier, R. A., & Kirshner, R. P. 1995, ApJ, 439, 730
- Potter et al. (2009) Potter, T. M., et al. 2009, ApJ, 705, 261
- Pun (2007) Pun, C. S. J. 2007, in AIP Conf. Proc., Vol. 937, Supernova 1987A: 20 Years After: Supernovae and Gamma-Ray Bursters, ed. S. Immler, K. Weiler, & R. McCray (Melville, NY: AIP), 171
- Pun et al. (2002) Pun, C. S. J., et al. 2002, ApJ, 572, 906
- Staveley-Smith et al. (1993) Staveley-Smith, L., Briggs, D. S., Rowe, A. C. H., Manchester, R. N., Reynolds, J. E., Tzioumis, A. K., & Kesteven, M. J. 1993, Nature, 366, 136
- Tingay et al. (2009) Tingay, S., et al. 2009, in 8th International e-VLBI Workshop, Proceedings of Science, 100, http://pos.sissa.it/archive/conferences/082/100/EXPReS09_100.pdf
- Turtle et al. (1990) Turtle, A. J., Campbell-Wilson, D., Manchester, R. N., Staveley-Smith, L., & Kesteven, M. J. 1990, IAU Circ., 5086, 2
- Turtle et al. (1987) Turtle, A. J., et al. 1987, Nature, 327, 38
- Uchiyama et al. (2007) Uchiyama, Y., Aharonian, F. A., Tanaka, T., Takahashi, T., & Maeda, Y. 2007, Nature, 449, 576
- Zanardo et al. (2010) Zanardo, G., et al. 2010, ApJ, 710, 1515