Shearing of frictional sphere packings
Abstract
We measure shear response in packings of glass beads by pulling a thin, rough, metal plate vertically through a bed of volume fraction , which is set, before the plate is pulled, in the range 0.575 to 0.628. The yield stress is velocity independent over 4 decades and increases exponentially with , with a transition at . An analysis of the measured force fluctuations indicates that the shear modulus is significantly smaller than the bulk modulus.
I Introduction
Granular matter is distinguished in part by its response to shear stress. We examine here the response to shear of beds of glass beads of diameter 200 m. The granular bed is prepared (by fluidization and sedimentation in water) in a well-defined homogeneous volume fraction in the range . We measure the dependence on volume fraction of the response of the bed to shear by pulling a thin, rough, metal plate embedded in the material. We find a transition indicated by a change of slope of yield force as a function of at , consistent with the phase transition at between and reported in Schröter et al. (2007). In the Discussion Section we argue that the transition in the yield slope can be identified with the dilatancy onset, the change in sign of the volume response of a sheared system. Further, we suggest that the yielding itself can be viewed as a separate transition between a solid-like mechanically stable state and a granular fluid state. In recent years the latter transition has often been discussed in the context of the Jamming paradigm van Hecke (2010) proposed by Liu and Nagel Liu and Nagel (1998). We show in the Discussion section how the yield stress can be used to distinguish the regimes in a jamming state diagram Liu and Nagel (1998); O’Hern et al. (2003) for frictional particles.
II Experiment
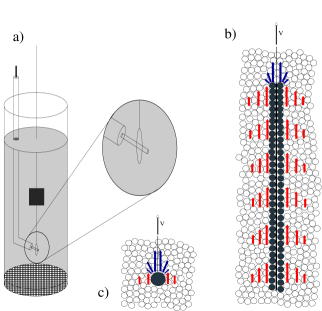
Our experimental set-up (Fig. 1(a)) consists of a vertical glass tube (diameter 38.7 mm, height 550 mm) filled with water and soda-lime glass beads (diameter = 20010 m, average sample height 300 mm). The granular bed is fluidized by a computer-controlled gear pump that produces 1 min long flow pulses, which are followed by a 2 min settling time during which the bed completely sediments Schröter et al. (2007). This yields a homogeneous bed with a packing fraction known with an accuracy of . The packing fraction after sedimentation depends on the flow rate during fluidization: loose packings are obtained using a small number of pulses of flow rates on the order of 50 ml/min, while larger packing fractions are obtained by fluidizing the granular bed repeatedly with pulses of decreasing flow rates. To check for the role of the preparation history we also performed some measurements where the bed was fluidized with a syringe pump.
To measure the shear force needed to initiate a displacement in the granular bed, a thin metallic plate (12.8 mm high 9.8 mm wide 0.1 mm thick) is pulled vertically through the bed (depicted in Fig. 1(b). Both sides of the plate are covered with glass beads (glued there with 3M Bonding film 583); the resulting total thickness of the plate is 0.6 mm. The measured vertical force results both from the shear at the sides of the plate and from compression due to the upward motion of the top edge of the plate. To determine the value of the compression component we made measurements using a horizontal cylindrical rod that has the same length as the plate width (mm) and a diameter the same as the thickness of the plate (mm) (Fig. 1(c)).
The plate is immersed in the bed before fluidization and is connected to a load cell (Honeywell Sensotec Model 31, range 250 g) by a nylon thread (diameter 150 m, length 275 mm, elastic constant 10 N/mm). To keep the plate in place during the fluidization, a nylon thread is attached to the plate bottom and the other end of the thread is attached to a plastic rod (cf. Fig. 1). After the sedimentation following the fluidization pulses, the plastic rod is withdrawn through a metallic cylinder to minimize disturbances to the granular bed. Then the plate is free to move.
During a measurement, a translation stage driven by a DC-Servo motor pulls the plate upwards over a distance of 1 mm at a constant velocity of 0.15 mm/min (except for a set of measurements made to determine the velocity dependence). Before the measurement the upper edge of the plate is 160 5 mm below the sand surface. The shear force is measured with the load cell connected to a bridge amplifier (Omega DMD-465WB); its output voltage is digitized with a 16 bit data acquisition card (NI PCI-6036E) at a frequency of 100 Hz. This corresponds to one data point every grain diameters. The noise level of this setup corresponds to about 1 mN, as determined from a measurement lifting a plate in an empty tube.
III Results
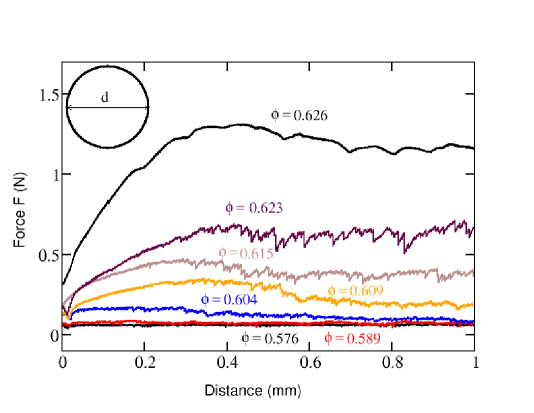
Typical measurements of the force as a function of the displacement of the plate are presented in Fig. 2. For , the force is constant for the whole displacement. For larger the force reaches a maximum value in the first mm before it begins to decrease again. We take this maximum to be the yield stress, the force needed to initiate a reorganization of the structure of the bed. This yield force is measured as the average over a length of approximately two grain diameters centered on the position of the maximum. The dependence of the yield force on packing fraction is shown in Fig. 3 as open circles. Though the data are noisy, there is a clear change in slope at . To test if the noise stems from minute differences in the packing preparation, which are unavoidable using a gear pump, we prepared samples using a syringe pump and two different protocols of flow pulses (cf. the triangular points in Fig. 3). The absence of a systematic shift of these measurements suggests that the noise is due to the finite size of our probe.
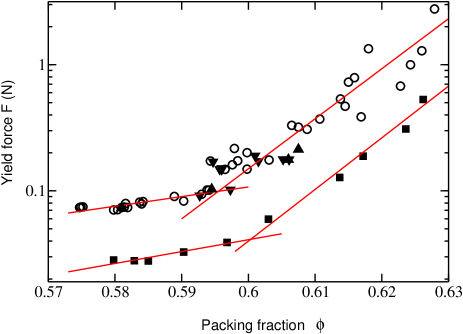
As discussed above, the plate not only shears the sample but also exerts compression. To quantify this compression we measured the yield force when the horizontal rod was pulled vertically (cf. Fig. 1(c)); the results are given by the filled squares in Fig. 3. Again the observations are consistent with the existence of a phase transition, in this case at 0.6. Since the bed yields for a force only about 30% of the plate yield force, we conclude that the plate measurements are indicative of the yield shear stress alone.
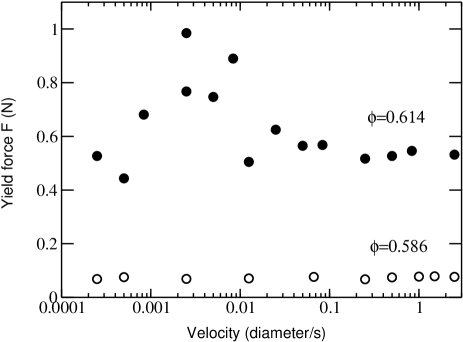
Figure 4 shows that the measured yield force is independent of the velocity of the plate, both above and below = 0.595. The larger fluctuations at lower velocities and higher packing fractions are an unexpected result.
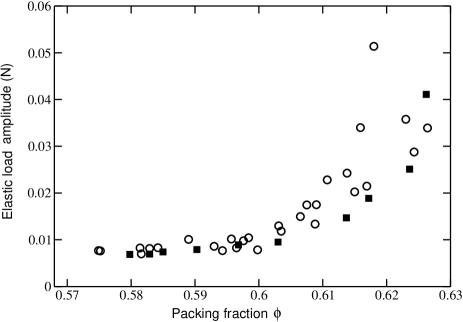
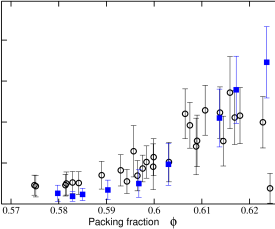
The fluctuations in the force measurements shown in Fig. 2 contain information concerning the elastic response of the granular medium. The force measurements reveal stick-slip motion, that is, smooth “elastic” increases of force followed by rapid plastic decreases, as Fig. 5(a)-(c) illustrates. An analysis of the fluctuations, inspired by work of Cantat and Pitois Cantat and Pitois (2006), yields an elastic constant
| (1) |
where is the slope of the elastic increases (cf. inset of Fig. 6(a)), is the area of the plate, and is the unknown width of the sheared or compressed zone (cf. Fig. 1(b) and (c)). Since the rod mostly compresses the sample, its elastic modulus corresponds to the bulk modulus of the sample. For the plate, the measured force arises from both compression and shear, so is a combination of and the shear modulus .
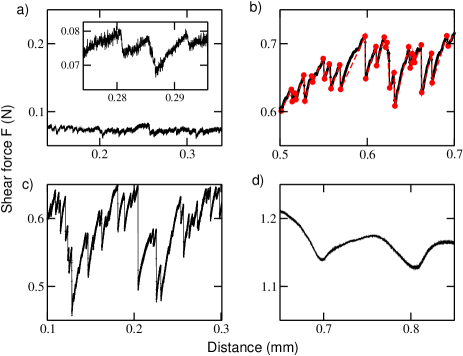
Figure 7 shows the -dependence of the elastic constants for the plate and for the rod. The magnitudes of and are similar. Both elastic and exhibit a change in behavior at , just as found for the average elastic load amplitudes (Fig. 6). Additionally we found to be velocity-independent for a wide range of forcings, just as found for the shear force. The values of in Fig. 7 obtained for the two highest packing fraction values are well below the line given by the nearby data; this is consistent with the absence of measured stick-slip motion in Fig. 5(d).
IV Discussion
We have found that both the yield force and its elastic response exhibit a change in behavior at , the same value of (within experimental uncertainty) as the previously observed phase transition in a penetration experiment Schröter et al. (2007). In contrast with the penetration experiment, the yield force measured here (Fig. 3) is created mostly by shear. Recent measurements show that the onset of dilatancy Kabla and Senden (2009); Gravish et al. (2010) (the change in sign of the volume response of a sheared system) also occurs for about 0.59-0.60, probably with small dependence on friction coefficient. The basic theoretical understanding of dilatancy goes back to Reynolds Reynolds (1885): a dense granular material must expand when sheared since intertwined layers must separate if they are forced past one another, while a low density granular material contracts rather than expands under shear. Whether the dilantancy onset, the transition from contraction to expansion under shear, occurs so suddenly as to constitute a phase transition has not been directly determined experimentally, but on the theory side there is a model predicting this, Aristoff and Radin (2010), an adaption of the Edwards model Edwards and Oakeshott (1989) of granular matter to include the above mechanism of Reynolds.
Thus there are two shear responses, one associated with yield exhibiting a transition (Fig. 3) and the other, dilatancy onset, in which the Reynolds mechanism produces a phase transition in a model. Both responses are observed to occur at the same volume fraction within the experimental uncertainty. In addition, there is a phase transition at the same volume fraction (again, within the experimental uncertainty) indicated by a response to penetration forces that are a mixture of shear and compression. Since a phase transition often leads to discontinuous behavior in a variety of material properties, this suggests that the yield transition data we report here, and dilatancy onset, are aspects of the same phase transition.
A second main point concerns the interpretation of the shear yield stress in Fig. 3. For small shear stress, the system will flow but then arrest in a new configuration, while for shear stress larger than the yield stress the system will flow and not come to rest Grebenkov et al. (2008). These solid-like and liquid-like states can be mapped in a diagram with the axes volume fraction, pressure, and shear stress, as Fig. 8 illustrates. Therefore, the data presented in Fig. 3 correspond to the jammed-unjammed transition in the classical jamming state diagram Liu and Nagel (1998); O’Hern et al. (2003) at a given pressure Zhang et al. (2010) and friction coefficient.
Jamming state diagrams in the literature are usually cartoons, but the separation of jammed and unjammed states could be made quantitative by using experimental data, as in the use of the data from Fig. 3 in Fig. 8. Diagrams for real granular matter might include other phase transitions, for example, a possible transition at random close packing, [13-15]. Including these transitions in a jamming state diagram would emphasize the need for a single theory that could simultaneously model both these phase transitions and the jamming/unjamming transition.
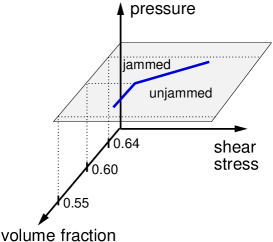
In connecting our results with the jamming state diagram for frictionless spheres, we note some ambiguity in the question of the equivalent of point J in frictional systems. The jamming point obtained in simulations of frictionless soft spheres corresponds to two phenomena. First it is the only possible density of amorphous packings of undeformed pressure-free spheres. Denser packings can only be built from compressed spheres and therefore need to have a finite pressure. This statement is independent of friction and hence also applicable to a physical granular system, as shown in a recent 2-dimensional experiment Majmudar et al. (2007). Second, point J is also the lower limit in which a system supports a positive yield stress. However, with friction there exist (as demonstrated by many experiments), for any pressure, mechanically stable states at a continuum of packing fractions below . The lowest volume fraction at which a finite yield stress can be measured then depends on pressure and friction Jerkins et al. (2008); farrell:10 . Its zero pressure limit is the random loose packing (RLP) limit, and in recent work it has been repeatedly taken as the equivalent of point J Zhang and Makse (2005); Shundyak et al. (2007); Jerkins et al. (2008). Figure 8 is based on such an interpretation.
Extrapolating from the penetration experiments in Schröter et al. (2007), we expect a significant pressure dependence. Additionally, previous measurements have shown that, even at a constant depth in the sample as in our measurements, the pressure depends on volume fraction and sample preparation Vanel and Clément (1999). Therefore, future work should include independent measurements of pressure.
Our results on the elastic properties can be interpreted in the framework of a model in which bulk compression and shear are represented by compression and stretching of parallel elastic springs. These springs can be thought of as the individual force chains originating at the probe. In the plate measurements there are considerably more shear springs present than in the rod measurements. The almost equal outcome for the two cases indicates that the shear elastic response is significantly weaker than the compression elastic response. If we assume that the relevant length scale is about the same for shear and compression, this result is equivalent to assuming that the shear modulus of the granular medium is significantly smaller than its bulk modulus. In comparison, in the jamming paradigm the ratio of the shear modulus to the compression modulus goes to zero when the volume fraction approaches point J from above Makse et al. (1999); O’Hern et al. (2003); Ellenbroek et al. (2009).
The velocity independence of both the yield shear stress and the elastic properties that we find contrasts with the previously observed logarithmic velocity dependence in sheared 2-dimensional photoelastic discs Hartley and Behringer (2003); Behringer et al. (2008). This might be either related to the difference in dimensionality or to the different values of the Young’s moduli of the materials used: 70 GPa/m2 for glass beads and 4 MPa/m2 for photoelastic discs.
In this paper we have focused on unjamming properties under shear of 3-dimensional packings of frictional spheres. We have found that both yield shear stress and shear modulus per length exhibit a transition at packing fraction . As we have discussed, this particular value of could correspond to a phase transition and could coincide with dilatancy onset. In addition, we have shown that the shear stress is velocity independent over a range of four decades, both below and above .
Acknowledgments We acknowledge helpful discussions with Olivier Dauchot. We would like to thank Udo Krafft for experimental support. This research was supported in part by Welch Foundation Grant F-0805 and NSF Grant DMS-0700120.
References
- Schröter et al. (2007) M. Schröter, S. Nägle, C. Radin, and H. L. Swinney, Europhys. Lett. 78, 44004 (2007).
- van Hecke (2010) M. van Hecke, J. Phys.: Cond. Mat. 22, 033101 (2010).
- Liu and Nagel (1998) A. J. Liu and S. R. Nagel, Nature 396, 21 (1998).
- O’Hern et al. (2003) C. S. O’Hern, L. E. Silbert, A. J. Liu, and S. R. Nagel, Phys. Rev. E 68, 011306 (2003).
- Cantat and Pitois (2006) I. Cantat and O. Pitois, Physics of Fluids 18, 083302 (2006).
- Kabla and Senden (2009) A. J. Kabla and T. J. Senden, Phys. Rev. Lett. 102, 228301 (2009).
- Gravish et al. (2010) N. Gravish, P. B. Umbanhowar, and D. I. Goldman, Phys. Rev. Lett. 105, 128301 (2010).
- Reynolds (1885) O. Reynolds, Phil. Mag. Series 5 20, 469 (1885).
- Aristoff and Radin (2010) D. Aristoff and C. Radin, ArXiv e-prints (2010), eprint 1005.1907.
- Edwards and Oakeshott (1989) S. F. Edwards and R. B. S. Oakeshott, Physica A 157, 1080 (1989).
- Grebenkov et al. (2008) D. S. Grebenkov, M. P. Ciamarra, M. Nicodemi, and A. Coniglio, Phys. Rev. Lett. 100, 078001 (2008).
- Zhang et al. (2010) J. Zhang, T. S. Majmudar, M. Sperl, and R. P. Behringer, Soft Matter 6, 2982 (2010).
- Radin (2008) C. Radin, J. Stat. Phys 131, 567 (2008).
- Aristoff and Radin (2010) D. Aristoff and C. Radin, Journal of Mathematical Physics 51, 113302 (2010).
- Jin and Makse (2010) Y. Jin and H. A. Makse, Physica A 389, 5362 (2010).
- Majmudar et al. (2007) T. S. Majmudar, M. Sperl, S. Luding, and R. P. Behringer, Phys. Rev. Lett. 98, 058001 (2007).
- Zhang and Makse (2005) H. P. Zhang and H. A. Makse, Phys. Rev. E 72, 011301 (2005).
- Shundyak et al. (2007) K. Shundyak, M. van Hecke, and W. van Saarloos, Phys. Rev. E 75, 010301 (2007).
- Jerkins et al. (2008) M. Jerkins, M. Schröter, H. L. Swinney, T. J. Senden, M. Saadatfar, and T. Aste, Phys. Rev. Lett. 101, 018301 (2008).
- Vanel and Clément (1999) L. Vanel and E. Clément, Eur. Phys. J. B 11, 525 (1999).
- Makse et al. (1999) H. A. Makse, N. Gland, D. L. Johnson, and L. M. Schwartz, Phys. Rev. Lett. 83, 5070 (1999).
- Ellenbroek et al. (2009) W. G. Ellenbroek, Z. Zeravcic, W. van Saarloos, and M. van Hecke, Euro. Phys. Lett. 87, 34004 (2009).
- Hartley and Behringer (2003) R. R. Hartley and R. P. Behringer, Nature 421, 928 (2003).
- Behringer et al. (2008) R. P. Behringer, D. Bi, B. Chakraborty, S. Henkes, and R. R. Hartley, Phys. Rev. Lett. 101, 268301 (2008).
- (25) G. R. Farell, K. M. Martini, and M. Menon, Soft Matter 6, 2925 (2010).