Time-integrated measurements of the CKM angle in BABAR
Giovanni Marchiori111e-mail: giovanni.marchiori@lpnhe.in2p3.fr on behalf of the B A
B AR Collaboration
Laboratoire de Physique Nucléaire et de Hautes Energies
IN2P3/CNRS, F-75252 Paris, FRANCE
The most recent determinations of the CKM angle by the BABAR Collaboration, using time-integrated observables measured in charged
decays, are presented.
The measurements have been performed on the full sample of 468 million
pairs collected by the BABAR detector at the SLAC
PEP-II asymmetric-energy factory in the years 1999-2007.
PROCEEDINGS OF
CKM2010, the 6th International Workshop on the CKM Unitarity Triangle
University of Warwick, UK
6-10 September 2010
1 Introduction
A theoretically clean measurement of the angle
(also denoted as in the literature)
can be obtained using -violating decays.
The interference between the and
tree amplitudes results in observables that depend
on the relative weak phase , the magnitude ratio , and the relative strong phase
between the two amplitudes.
The hadronic parameters, and , depend on the decay
under investigation; they can not be precisely calculated from theory,
but can be extracted directly from data by simultaneously
reconstructing several different final states.
In this contribution we present the most recent
determinations obtained by B A
B AR, based on the full sample ( decays) of charged mesons produced in
and accumulated in the years
1999-2007. The following decays have been reconstructed:
(i) and , with ,
;
(ii) , with decaying to -eigenstates ;
(iii) , with decaying to .
The results are statistically limited, as the effects that
are being searched for are tiny, since: (i)
the branching fractions of the meson decays considered here
are on the order of or lower; (ii) the
branching fractions for decays, including secondary decays,
range between and ; (iii)
the interference between the and
mediated decay amplitudes is low, as the ratios
are around 0.1 due to CKM factors and the additional
color-suppression of .
The decay final states are completely reconstructed,
with efficiencies between 40% (for low-multiplicity,
low-background decay modes) and 5% (for high-multiplicity decays).
The selection is optimized to maximise the statistical sensitivity
, where the number of expected signal () and background
() events is estimated from simulated samples and data control samples.
Signal decays are distinguished from and continuum
background by means of maximum likelihood fits to two variables exploiting
the kinematic constraint from the known beam energies: the energy-substituted
invariant mass and the
energy difference
. Additional continuum background
discrimination is achieved by including in the likelihood a variable
built, using multivariate analysis tools, from the combination (either a linear
Fisher discriminant, , or a non-linear neural-network, ) of several
event-shape quantities. These variables distinguish spherical events from
more jet-like events and exploit the different angular correlations
in the two event categories. decays, which are 12 times more
abundant than and are expected to show negligible -violating
effects ( in such decays), are discriminated by means of the
excellent pion and kaon identification provided by measured in the
charged particle tracking devices and by the radiation detected in the
Cherenkov detector, and are used as control samples.
2 Dalitz-plot method: ,
We reconstruct , ( and
), and () decays,
followed by neutral meson decays to the 3-body self-conjugate
final states () [1].
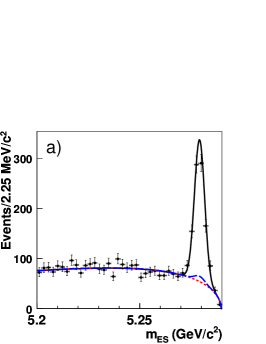
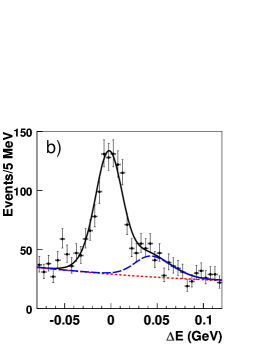
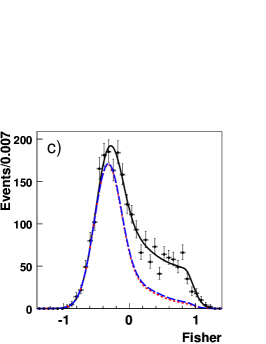
From an extended maximum likelihood fit to , and (Fig. 1)
we determine the signal and background yields in each channel:
we find 268 candidates with and
1507 candidates with .
Figure 1: The (a), (b), and (c)
distributions for , .
for events in the signal region ( ,
MeV, and ), after all the selection criteria,
except the one on the plotted variable, are applied.
The curves represent the fit projections:
signal plus background (solid black lines),
background (dotted red lines),
background (dashed blue lines).
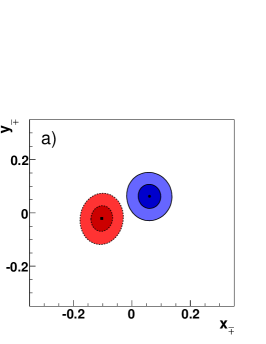
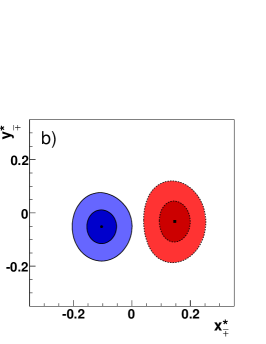
Following the technique proposed in [2],
from a fit to the Dalitz-plot distribution of
the daughters
we determine 2D confidence regions for the
variables and
(Fig. 2).
In the fit we model the and
decay amplitudes to as the coherent sum of
a non-resonant part and several intermediate two-body decays that
proceed through known or resonances. The
model is determined from large () and very
pure () control samples of mesons produced in
decays [3].
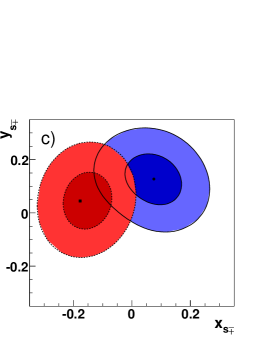
Figure 2: and contours in the
planes for (a) , (b) and (c) ,
for (solid lines) and (dotted lines) decays.
Table 1: Values of and measured with the Dalitz-plot
analysis of
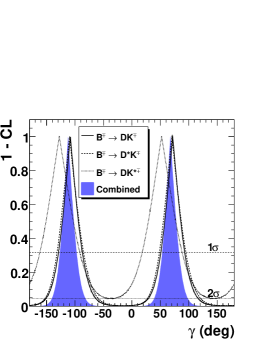
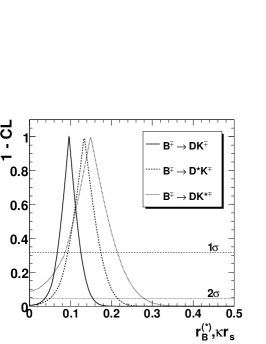
From the confidence regions we determine, using
a frequentist procedure, confidence intervals
for , and (Fig. 3).
We obtain ,
where the three uncertainties are respectively the statistical, the experimental systematic and the Dalitz-model systematic ones.
We find values of around 0.1, confirming that
interference is low in these channels:
; ;
( takes into
account the finite width).
We also measure the strong phases (modulo ):
;
;
.
A evidence of direct violation is found
from the distance between and (0
in absence of CPV) in the three decay channels.
Figure 3: 1-confidence level (CL) as a function of (left), (center) and (right) from the Dalitz-plot analysis.
3 GLW method: ,
We reconstruct decays, with mesons
decaying to non- (), -even (, ) and
-odd (, , ) eigenstates [4].
The partial decay rate charge asymmetries for
-even and -odd final states and the ratios
of the charged-averaged meson partial decay rates in and non- decays
provide a set of four observables from which the three unknowns , and
can be extracted (with an 8-fold discrete ambiguity for the phases) [5].
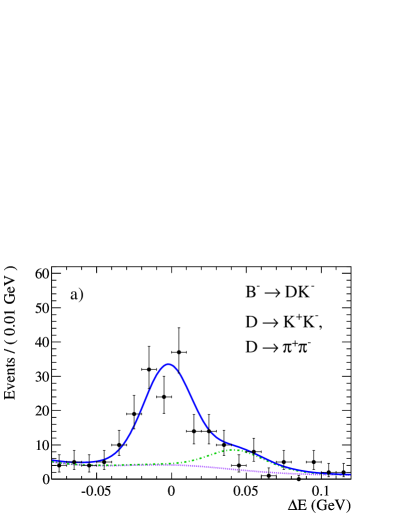
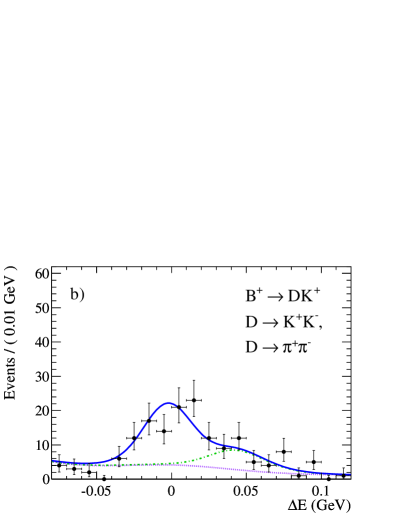
The signal yields, from which the partial decay rates are determined,
are obtained from maximum likelihood fits to , and .
An example is shown in Fig. 4.
We identify about 500 decays with -even final states
and a similar amount of decays with -odd final states.
We measure and
and , respectively, where
the first error is the statistical and the second is
the systematic uncertainty.
The parameter is different from zero with a significance of
3.6 standard deviations, constituting evidence for direct violation. We also measure
and .
Figure 4: projections of the fits to the data: (a) ,
(b) .
The curves are the full PDF (solid, blue), and
(dash-dotted, green) stacked on the remaining backgrounds
(dotted, purple).
We require candidates to lie inside a signal-enriched region:
, , charged particle from the
passing kaon identification criteria.
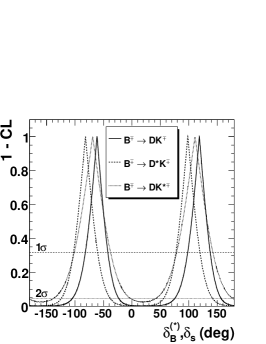
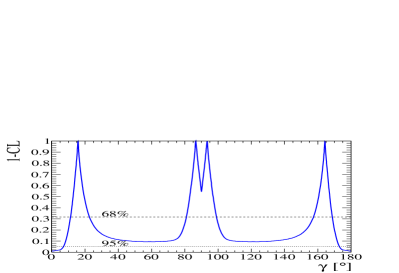
Using a frequentist technique, including statistical and systematic
uncertainties, we obtain
() and, modulo ,
or
or
()
at the 68% (95%) confidence level (Fig. 5).
To facilitate the combination of these measurements with the results
of the Dalitz-plot analysis, we exclude the ,
channel from this analysis – thus removing events common to the two measurements –
and express our results in terms of the variables using
. We find:
and
,
in good agreement with the results from the Dalitz-plot analysis.
Figure 5: 1-CL as a function of mod (left) and (right) from the GLW study.
4 ADS method: ,
We reconstruct and
( and ), followed by decays to both
the doubly-Cabibbo-suppressed final state and the
Cabibbo-allowed final state , which is used as normalization
and control sample [6].
Final states with opposite-sign kaons are produced from the
interference of the CKM favored decay followed by the doubly
Cabibbo-suppressed decay and the CKM- and color- suppressed
decay followed by the Cabibbo-allowed decay, and the asymmetries may be potentially very large. On the other hand, their
overall branching fractions are very small () and
background suppression is crucial.
The three branching fraction ratios () between decays
with opposite-sign and same-sign kaons and the three charge
asymmetries () in decays with opposite-sign kaons provide
six observables that can be used, together with the measurements by
- and -factories of the amplitude ratio and the strong
phase difference between the two decay amplitudes, to
determine (with a 4-fold discrete ambiguity) and the two sets of [7].
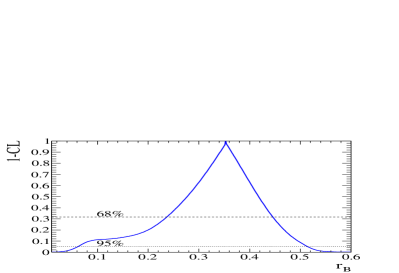
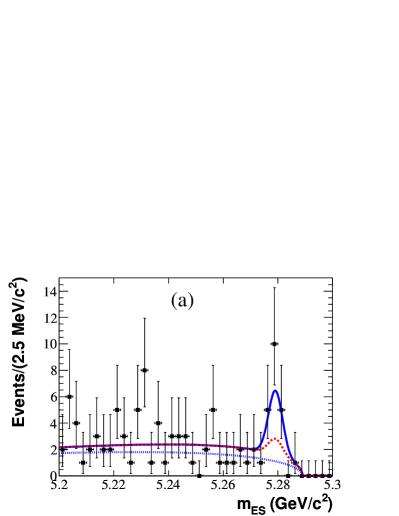
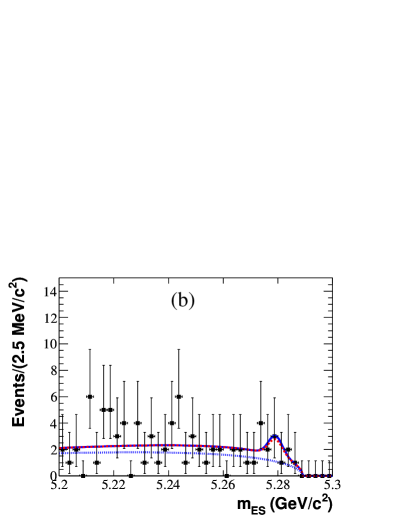
The yields are determined from fits to and (Fig. 6).
Figure 6:
projection of the fit to the data for the ,
decays, for samples enriched in
signal , for (a) and (b)
candidates.
The curves represent the fit projections for
signal plus background (solid), the sum of all background
components (dashed), and the background only (dotted).
We see indications of signals for the
and opposite-sign modes, with significances of
and , respectively. The measured branching fration ratios
are
and .
The asymmetries are large, and . We see no evidence of opposite-sign decays,
and measure and . From these results we infer
,
and
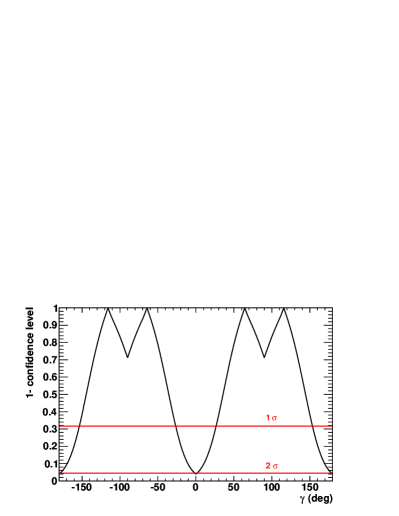
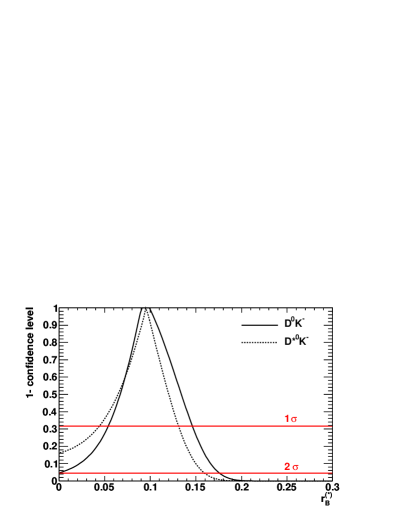
(Fig. 7).
Figure 7: 1-CL as a function of (left) and (right) from the ADS study.
5 Conclusion
The full B A
B AR dataset has been exploited to measure the CKM angle
in several decays using three alternative techniques.
A coherent set of results on and on the hadronic parameters
characterizing the decay amplitudes has been obtained.
The central value for , around , is consistent with
indirect determinations from the CKM fits.
We attained a precision on around , and confirm the theoretical
expectations of significant suppression () of the
mediated decay amplitud with respect to the one.
Finally, two direct CP violation evidences at the level of have been
observed.
References
[1]
P. del Amo Sanchez et al. [BABAR Collaboration],
Phys. Rev. Lett. 105, 121801 (2010).
[2] A. Giri, Y. Grossman, A. Soffer and J. Zupan,
Phys. Rev. D 68, 054018 (2003).
[3]
P. del Amo Sanchez et al. [BABAR Collaboration],
Phys. Rev. Lett. 105, 081803 (2010).
[4]
P. del Amo Sanchez et al. [BABAR Collaboration],
Phys. Rev. D 82, 072004 (2010).
[5]
M. Gronau and D. Wyler, Phys. Lett. B265, 172; M. Gronau
and D. London, Phys. Lett. B253, 483 (1991).
[6]
P. del Amo Sanchez et al. [BABAR Collaboration],
Phys. Rev. D 82, 072006 (2010).
[7]
D. Atwood, I. Dunietz and A. Soni, Phys. Rev. Lett. 78,
3257 (1997).