Internal conversion electrons and supernova light curves
Abstract
Radioactive decays contribute significantly to the re-heating of supernova ejecta. Previous works mainly considered the energy deposited by -rays and positrons produced by , , , , , and . We point out that Auger and internal conversion electrons constitute an additional heat source. At late times, these electrons can contribute significantly to supernova light curves for reasonable nucleosynthetic yields. In particular, the internal conversion electrons emitted in the decay of are an important heating channel for supernovae that have become largely transparent to -rays. We show that when the heating by these electrons is accounted for, the slowing down of the light curves of SN 1998bw and SN 2003hv is naturally obtained for typical nucleosynthetic yields. Additionally, we show that for SN 1987A the effects of internal conversion electrons are likely significant for the derivation of yields from its late time bolometric light curve.
1 Introduction
A great success of nuclear astrophysics was the demonstration that radioactivity powers the light curves of Type Ia supernovae (SN Ia, most likely thermonuclear) and, at least for some events at late times, Type Ib/c and Type II (most likely core collapse) supernovae. Shortly after its explosion a supernova enters a state of homologous expansion. The temperature drops during the expansion until nuclear fusion reactions cease; radioactive decays, however, still take place, since the matter is only slightly ionized. It is now widely accepted that the energy liberated in the decay chain of radioactive is the most important nuclear source for re-heating the supernova ejecta to temperatures high enough for the spectrum to peak at optical wavelengths [1, 2]. At first, the bulk of the heating is produced by the energetic -rays which thermalize and deposit their energy via Compton scattering and photoelectric absorption. In the homologous expansion, the column density (and therefore also approximately the Compton opacity) decreases with time as , and the ejecta become more and more transparent to these high energy photons. Once -rays escape, the positrons produced in the decay of and were thought to be the main heating sources. Here, we draw attention to often overlooked additional leptonic heating channels: Auger and internal conversion electrons. In section 2 we review the physics of nuclear decays relevant for supernova light curves. In section 3 we demonstrate the impact of internal conversion electrons from the decay of on different supernova light curves. We conclude in section 4 with an outlook how this effect could be used to constrain supernova explosion models in the future. For the published refereed journal article that first pointed out the significance of internal conversion electrons on supernova light curves, please see [3].
2 Nuclear decays
The time dependence of nuclide abundances in a ecay chain is governed by the Bateman equations:
| (1) | |||||
| (2) |
For and initial abundances and we get the solution
| (3) | |||||
| (4) |
The decay constants are related to the half-lives and the mean life-time via
| (5) |
The rate of energy deposition by decays of nucleus is given by the activity multiplied by the energy deposited per decay:
| (6) |
where the number is given by eq. 3 or eq. 4 and the energy deposited, , is a function of time due to the increasing escape fraction of -rays and possible late time escape of positrons.
| Nucleus | Auger | IC | X-ray | |
|---|---|---|---|---|
| 7.594 | 10.22 | 0.000 | 3.598 | |
| 3.355 | 0.374 | 115.7 | 1.588 | |
| 3.973 | 0.000 | 0.000 | 1.635 | |
| 3.519 | 7.064 | 0.000 | 0.768 | |
| 0.163 | 0.074 | 595.8 | 0.030 |
Most of the nuclei synthesized in supernova explosions have atomic masses in the range . The isotopes are generally either stable or on the proton-rich side of the valley of stability. For these unstable nuclei, radioactive decay occurs along an isobar towards neutron richness, either by electron capture or positron emission. Electron capture proceeds via the capture of an atomic (typically K or L shell) electron by a proton in the nucleus and corresponding emission of an electron neutrino. Positron emission proceeds via the decay of a proton in the nucleus into a neutron and the corresponding emission of a positron and an electron neutrino. For both processes, the transition to the daughter nucleus is a statistical process to a distribution of (excited) nuclear states. Following electron capture, the daughter is formed with a hole in its atomic electron cloud. Higher lying atomic electrons transition to fill the gaps in the lower lying atomic shells, which results in characteristic X-rays being emitted from the cascade. For every such electron transition, there is also a probability that instead of an X-ray one or more higher lying atomic electrons are ejected. These electrons are known as Auger electrons.

Analogous to the X-ray cascade of the atom, the excited daughter nucleus typically undergoes a series of transitions towards the ground state accompanied by emission of characteristic -ray photons. If the nucleus is surrounded by an electron cloud, then there is again a probability that instead of a -ray one or more atomic electrons are ejected. This process, in which the energy difference of the nuclear levels is carried away by the ejection of an inner atomic electron and there is no -ray photon emitted, is called internal conversion. The probability for internal conversion to occur for a given level is measured by the internal conversion coefficient . is normally small for nuclei with low atomic number, but increases for levels close to the ground state. For the decay of the probability for production of internal conversion electrons is very large, due to the existence of a low-lying nuclear level in the daughter nucleus (see Fig. 1). For the first exited state (14.4 keV ) of , the internal conversion coefficient . This decay is 100% electron capture, and over 99.8% all decays are into the 136 keV level. Captures to the higher lying 366.74 and 706.42 keV levels contribute only marginally. For ground-state to ground-state electron capture transitions, such as in the decay of , no -rays or positrons are emitted. Assuming that the neutrino escapes without interactions, in such transitions the Auger electrons and the X-rays constitute the only sources of radioactive heating.
The following four decay chains contribute most to bolometric supernova light curves:
| (7) | |||
| (8) | |||
| (9) | |||
| (10) |
Here we do not model the radiative transport, we only compare leptonic (and X-ray) energy injection rates. We do not include the energy produced by the pair annihilation and further assume that the kinetic energy of the leptons is completely and locally deposited and thermalized. The energy generation rates presented here do not include any heating due to -rays and therefore are not predictions for bolometric light curves. This approach, however, does allow for a direct comparison of the relative importance of the different leptonic heating channels (positrons from the decays of and and electrons from the decays of and .) The relevant energies of the different decay channels are listed in table 1. These data are taken from the National Nuclear Data Center111http://www.nndc.bnl.gov/.
3 Late-time bolometric light curves
Bolometric light curves have to be reconstructed from multi-band photometry. For reliable reconstruction, the contribution of the UV/optical () and near-infrared () bands have to be included (UVOIR light curve). However, near-IR observations are rare at very late epochs, and sometimes only -through- band observations with a near-IR correction extrapolated from earlier epochs are used [4]. Below, we discuss some aspects and examples of different supernova light curves.
3.1 Type Ia supernovae
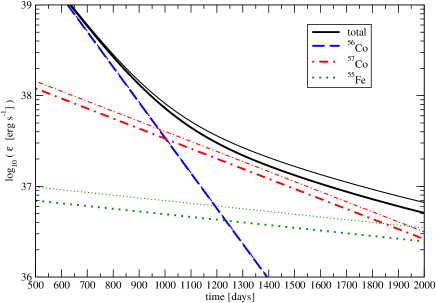
SNe Ia are thought to be thermonuclear disruptions of white dwarf stars and as such do not have an extended envelope. Consequently, their ejecta become transparent to -rays relatively soon and the positron-dominated phase generally starts – days after the explosion [5, 6]. Between and days, the UVOIR light curves fall exponentially with the decay half-life [7], a clear sign that a constant fraction of positrons is trapped. Unfortunately, only few SN Ia were observed at even later times, but there are indications of a slow-down in the light curves of some optical bands after days [6, 8]. A particularly interesting case is SN 2003hv, which shows a slow-down in the bolometric light curve 786 days after B-band maximum light [9]. It has been suggested that additional (possibly radioactive) heating sources may be needed to explain this observed effect. We point out that the magnitude and time of occurrence of the observed slow down of the light curve is expected and a natural consequence of the leptonic energy injection from the decay of . To illustrate this, consider the leptonic energy generation rates of important long lived isotopes between 500 and 2000 days for W7 [10], a common reference SN Ia model (see Fig. 2). For this particular choice of yields [11], the light curve is significantly higher from assuming only heating from positrons after about 750 days. 1000 days after the explosion, the heating from electrons equals the heating from positrons.
3.2 Core collapse supernovae
The progenitors of core collapse SNe are massive stars, which have an extended, massive envelope at the time of explosion, which provides opacity for the emerging -rays. Compared to SNe Ia, the nuclear burning also takes place at higher entropy, which means that core collapse supernovae synthesize more . These differences imply that the moment when internal conversion electrons from significantly contribute to the light curves is delayed. Nevertheless, two observed examples of core collapse SN where internal conversion electrons do significantly alter the shape of the light curve are given below.
3.2.1 SN 1998bw
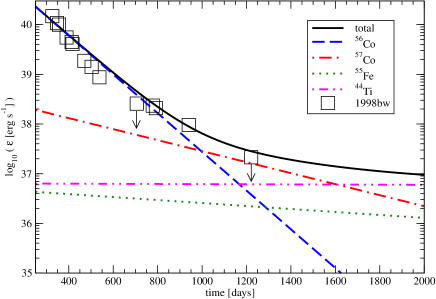
The well observed SN 1998bw, which was the first case of a -ray burst associated with a SN[13], was classified as a SN Ic. The explosion was a very energetic , asymmetric disruption of a massive, stripped stellar core ( ; [14]). The high ejecta velocities and the lack of an extended envelope reduce the -ray opacity such that by days almost all -rays are freely streaming. A nucleosynthetic yield calculation for hypernovae like 1998bw [15] predicts a to mass ratio , times the solar value for the to ratio (which is ; [16]). After modeling the UVOIR light curve to days after the explosion, [4] showed that a simple model without contributions from freeze-out effects, circumstellar interaction, accretion onto a central compact object or light echoes requires a to ratio times greater than solar. This large discrepancy between the value of predicted from explosive nucleosynthesis calculations and the one derived from light curve modeling reduces if the effects of internal conversion and Auger electrons are included in the light-curve calculations. In Fig. 3 we show the combined leptonic and X-ray luminosity corresponding to the nucleosynthetic yield calculations of [15]. The non--ray heating due to is the dominant contribution between and 1600 days. The observed slow down of the light curve of 1998bw at days (see Fig. 3) is thereby naturally obtained without the need for strongly super solar .
3.2.2 SN 1987A
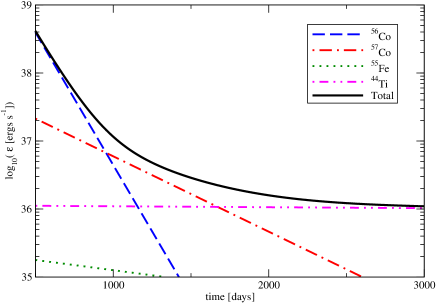
SN 1987A has demonstrated that light curves can be constructed for nearby supernovae extending for several years after the explosion. This has led to the consideration of longer lived radioactive species. The most important of these is , which is expected to be produced in significant amounts as the decay product of the short lived . Due to its relatively longer half-life (271.79 days) and the high opacity of the ejecta to the emitted -rays, its -rays alone may dominate the bolometric light curve, especially of core collapse supernovae, at late times [17, 18]. In fact, due to its extended envelope, the opacity to -rays in the remnant of 1987A remained high for such a long time that it never entered the positron dominated phase [19]. It is argued, that the only other radionuclide which noticeably contributes to the bolometric light curve is [20]. has an even longer half-life of 59.8 years, and the short lived daughter has a strong positron channel, which means that the decay chain is the dominant energy source at very late times. Photometric data of SN 1987A lead to the conclusion that the was rather large, about five times the corresponding solar value [21, 22]. Due to the proximity of SN 1987A, the presence of and was inferred not only photometrically from their imprint on the light curve, but also through a direct detection of escaping -rays from their decays. The observed gamma ray flux from with the Oriented Scintillation Spectrometer Experiment (OSSE) on board the Compton Gamma Ray Observatory [23] favored at most moderate enhancement of (factor 1.5), in good agreement with nuclear reaction network calculations [24]. Similarly, based on the light curve, a rather high abundance was claimed in several studies [22, 25, 26]. The great difficulty of explaining the light curve of 1987A between 1000 and 1500 days without strong overproduction of can be ameliorated by including “freeze-out effects” [27] or by conveniently re-arranging the spatial distribution of the radionuclides [28], but some disagreement of data and models persists. By comparing the various leptonic energy deposition rates for a nucleosynthesis model of 1987A [24], we show that the leptonic channels of decay are significantly contributing between 1000 and 2000 days (see Fig. 4).
4 Conclusion and Outlook
Fitting models to observed late time light curves provides a unique and independent method to directly measure the isotopic yields of prominent radioactive nuclei synthesized in the explosion (in particular , , and ). We have shown that at late times, when the ejecta have become largely transparent to -rays, the energy carried by Auger and internal conversion electrons may constitute a significant source of heating. These additional decay channels have to be considered for reliable isotopic abundance determinations from light curves. In particular, we have shown that a re-analysis of the bolometric light curve of 1987A (taking the hitherto unconsidered effect of internal conversion electrons into account) would likely yield significantly different (smaller) and masses. The new derived values for and would allow us to gain more insight into the explosion mechanism of core collapse supernovae. In particular, observationally driven inferences about the location of the mass cut can be made, which would give us valuable information about the physical processes separating neutron star and black hole formation from massive stars. Last but not least, SNe Ia are considered as the source of the positrons required to explain the Galactic 511 keV annihilation line observed by Integral/SPI [29]. The question whether enough positrons can escape the remnant remains unanswered. An understanding of the physics that underlies the light curves of SNe is a crucial step in order to constrain the escape fraction of positrons.
References
- [1] J. W. Truran, W. D. Arnett, and A. G. W. Cameron. Nucleosynthesis in supernova shock waves. Canadian Journal of Physics, 45:2315–2332, 1967.
- [2] S. A. Colgate and C. McKee. Early supernova luminosity. ApJ, 157:623–643, August 1969.
- [3] I. R. Seitenzahl, S. Taubenberger, and S. A. Sim. Late-time supernova light curves: the effect of internal conversion and Auger electrons. MNRAS, 400:531–535, November 2009.
- [4] J. Sollerman et al. Supernova 1998bw - the final phases. A&A, 386:944–956, May 2002.
- [5] P. A. Milne, L.-S. The, and M. D. Leising. Late light curves of Type Ia supernovae. ApJ, 559:1019–1031, October 2001.
- [6] J. Sollerman et al. The late-time light curve of the Type Ia supernova 2000cx. A&A, 428:555–568, December 2004.
- [7] M. Stritzinger and J. Sollerman. Late-time emission of Type Ia supernovae: optical and near-infrared observations of SN 2001el. A&A, 470:L1–L4, July 2007.
- [8] J. C. Lair, M. D. Leising, P. A. Milne, and G. G. Williams. Late Light Curves of Normal Type Ia Supernovae. AJ, 132:2024–2033, November 2006.
- [9] G. Leloudas et al. The normal type ia SN 2003hv out to very late phases. A&A, 505:265–279, October 2009.
- [10] K. Nomoto, F.-K. Thielemann, and K. Yokoi. Accreting white dwarf models of Type I supernovae. III. carbon deflagration supernovae. ApJ, 286:644–658, November 1984.
- [11] K. Iwamoto, F. Brachwitz, K. Nomoto, N. Kishimoto, H. Umeda, W. R. Hix, and F.-K. Thielemann. Nucleosynthesis in chandrasekhar mass models for Type Ia supernovae and constraints on progenitor systems and burning-front propagation. ApJS, 125:439–462, December 1999.
- [12] T. Nakamura, H. Umeda, K. Iwamoto, K. Nomoto, M.-a. Hashimoto, W. R. Hix, and F.-K. Thielemann. Explosive nucleosynthesis in hypernovae. ApJ, 555:880–899, July 2001.
- [13] T. J. Galama et al. An unusual supernova in the error box of the -ray burst of 25 april 1998. Nature, 395:670–672, October 1998.
- [14] K. Maeda, T. Nakamura, K. Nomoto, P. A. Mazzali, F. Patat, and I. Hachisu. Explosive nucleosynthesis in aspherical hypernova explosions and late-time spectra of SN 1998bw. ApJ, 565:405–412, January 2002.
- [15] T. Nakamura, P. A. Mazzali, K. Nomoto, and K. Iwamoto. Light curve and spectral models for the hypernova SN 1998bw associated with GRB 980425. ApJ, 550:991–999, April 2001.
- [16] K. Lodders. Solar system abundances and condensation temperatures of the elements. ApJ, 591:1220–1247, July 2003.
- [17] P. A. Pinto, S. E. Woosley, and L. M. Ensman. SN 1987A - out on the tail. ApJ, 331:L101–L104, August 1988.
- [18] S. E. Woosley, D. Hartmann, and P. A. Pinto. Hard emission at late times from SN 1987A. ApJ, 346:395–404, November 1989.
- [19] C. Fransson and C. Kozma. Radioactivities and nucleosynthesis in SN 1987A. New Astronomy Review, 46:487–492, July 2002.
- [20] S. Kumagai, T. Shigeyama, K. Nomoto, M. Itoh, J. Nishimura, and S. Tsuruta. Gamma rays, X-rays, and optical light from the cobalt and the neutron star in SN 1987A. ApJ, 345:412–422, October 1989.
- [21] N. B. Suntzeff, M. M. Phillips, J. H. Elias, A. R. Walker, and D. L. Depoy. The energy sources powering the late-time bolometric evolution of SN 1987A. ApJ, 384:L33–L36, January 1992.
- [22] E. Dwek, S. H. Moseley, W. Glaccum, J. R. Graham, R. F. Loewenstein, R. F. Silverberg, and R. K. Smith. Dust and gas contributions to the energy output of SN 1987A on day 1153. ApJ, 389:L21–L24, April 1992.
- [23] J. D. Kurfess et al. Oriented scintillation spectrometer experiment observations of in SN 1987A. ApJ, 399:L137–L140, November 1992.
- [24] K. Nomoto, T. Shigeyama, S. Kumaga, and M.-A. Hashimoto. New developments in theoretical modelling of SN 1987A. Proceedings of the Astronomical Society of Australia, 7:490–504, 1988.
- [25] S. E. Woosley and R. D. Hoffman. and production in SN 1987A. ApJ, 368:L31–L34, February 1991.
- [26] F. X. Timmes, S. E. Woosley, D. H. Hartmann, and R. D. Hoffman. The production of and in supernovae. ApJ, 464:332–+, June 1996.
- [27] C. Fransson and C. Kozma. The freeze-out phase of SN 1987A - implications for the light curve. ApJ, 408:L25–L28, May 1993.
- [28] D. D. Clayton, M. D. Leising, L.-S. The, W. N. Johnson, and J. D. Kurfess. The abundance in SN 1987A. ApJ, 399:L141–L144, November 1992.
- [29] J. Knödlseder et al. The all-sky distribution of 511 kev electron-positron annihilation emission. A&A, 441:513–532, October 2005.