Very Long-term Optical Variability of High Mass X-ray Binaries in the SMC
Abstract
We have studied the very long-term temporal properties of the optical emission from Be X-ray binaries (BeX) in the Small Magellanic Cloud over a 16 yr baseline, using light curves from the MACHO and OGLE databases. All the BeX in our sample display superorbital variations, many of them quasi-periodic on timescales of 200-3000 d. These long-term variations are believed to be related to the formation and depletion of the circumstellar disc around the Be star and we compare and contrast their behaviour with that of the LMC’s prototypical BeX, A0538-66. The great majority of sources show a correlation of outburst amplitude with brightness (the opposite to that seen in A0538-66) although the amplitudes are mostly small ( 0.1 mag). We suggest this is an orbital inclination effect. In addition, we have also detected many of their optical orbital periodicities, visible as a series of precisely regular outbursts. Furthermore, the amplitude of these periodic outbursts can vary through the long-term superorbital cycle, and we discuss mechanisms which can produce this effect, as well as examining an apparent correlation between these periodicities. As a by-product of this variation survey we have compiled a list of all the reported SMC BeX orbital and superorbital periodicities at optical and X-ray wavelengths.
keywords:
stars: emission-line:Be - X-rays:binaries - Magellanic Clouds1 Introduction
In high-mass X-ray binaries (HMXBs), a compact object (usually a neutron star) accretes mass from a massive early type O-B star. Conventionally, they are subdivided into two groups, the supergiant X-ray binaries (SgXRB) and Be/X-ray binaries (BeX). These massive X-ray binaries are particularly numerous in the Small Magellanic Cloud (SMC) (e.g. Coe et al., 2005).
From extrapolation of the Milky Way’s population of 65 HMXBS and based on the Milky Way/SMC mass ratio being 50, one would expect to find only one or two HMXBs in the SMC. Remarkably, 59 of these systems have now been detected, with another surprising result being that all of them are BeX systems, with only one exception, the supergiant system SMC X-1 (Coe et al., 2005; McGowan et al., 2007).
A BeX consists of a neutron star orbiting a Be star in a wide (period months) and eccentric orbit. For reasons not fully understood, Be stars rotate very rapidly, leading to outflows from the Be star that form an equatorial disc around it. If sufficiently extended, the neutron star can penetrate this equatorial disc during each periastron passage, giving rise to periodic outbursts that can be observed over a wide range of wavelengths (optical, X-ray,…) (e.g. Okazaki & Negueruela, 2001). A review of basic properties of BeX can be found in Negueruela (1998) and Coe et al. (2005).
Several authors have investigated the extensive optical light curves of these sources available from the MACHO and OGLE projects in search of evidence for orbital modulations (Alcock et al., 1996; Udalski, Kubiak, & Szymanski, 1997). In addition to the orbital variations usually seen as a series of periodic outbursts, these sources can show long-term superorbital modulations with timescales of hundreds of days to years. The prototype for this behaviour is the highly luminous ( 1039 ergs-1 at its peak) LMC BeX, A0538-66, which has a remarkably stable superorbital modulation of 420.82 days, compared to its well-established orbital period of 16.65 days (Alcock et al., 2001; McGowan & Charles, 2003, hereafter MC03). It was suggested by MC03 that these long-term modulations were a result of the formation and depletion of the circumstellar disc around the donor star which gives rise to the Be phenomenon. Given the known long-term variations in the Be systems, this discovery raised the question of whether such behaviour was ubiquitous, or somehow related to the presence of the X-ray source.
Consequently, in this paper, we investigate this superorbital behaviour in much greater detail within the now substantial BeX population by exploiting the MACHO and OGLE project databases. Together these provide a 16 year baseline for LMC/SMC studies of X-ray binary counterparts. Table 1 gives the position (RA and Dec) as well as alternative name of all known SMC X-ray pulsars. We use the naming convention of Coe et al. (2005), where SXP‘x’ is the SMC X-ray Pulsar with a ‘x’ s pulse period. Table 2 details the MACHO and OGLE counterparts of these SMC X-ray pulsars, their OGLE positions (RA and Dec), all previously reported X-ray and optical orbital periods, and their X-ray luminosities.
2 Optical light-curves from the MACHO and OGLE projects
The MACHO (MAssive Compact Halo Objects) observations were made with the 1.27 m telescope located at Mount Stromlo Observatory, Australia (Alcock et al., 1996). It provides photometry in two passbands, a red band which we refer to as -band ( 6300-7600 Å, a slightly longer effective wavelength than Johnson R) and a blue band we refer to as -band ( 4500-6300 Å, slightly shorter effective wavelength than Johnson V). The data were taken during the interval 1993 to 2000 and are available at the MACHO website111wwwmacho.anu.edu.au. The data are in instrumental magnitudes.
The OGLE (Optical Gravitational Lensing Experiment) projects have used the 1.3 m Warsaw telescope at Las Campanas Observatory, Chile. Phase II of the OGLE project ran from January 1997 to Dec 2000 (Udalski, Kubiak, & Szymanski (1997); Zebrun et al. (2001)), and phase III from 2001 until 3 May 2009. The photometric data for the OGLE projects are taken in the I-band. OGLE II data can be downloaded from the OGLE II website222ogle.astrouw.edu.pl. OGLE III data for optical counterparts of X-ray sources located in the fields observed regularly by the OGLE-III survey are available at the X-ray variables OGLE monitoring (XROM) website333ogle.astrouw.edu.pl/ogle3/xrom/xrom.html (Udalski, 2008).
2.1 Calibrations
We used the merged OGLE II and OGLE III photometry which are relative to the final OGLE III photometry. The details of the OGLE-III calibrations which based on OGLE II photometry can be found in Udalski et al. (2008). For the MACHO data we determined what offset is needed to align them with the OGLE II data as both projects observed the SMC from 1997 to 2000, this provides substantial overlap for demonstrating their compatibility.
2.2 Temporal analysis
The combined lightcurves(16 years) were then analysed using the Starlink PERIOD444www.starlink.rl.ac.uk/star/docs/sun167.htx/sun167.html time-series analysis package designed to search for periodicities in unevenly sampled data. It has a variety of periodicity search options, including the Lomb-Scargle periodogram (LS periodogram, Lomb, 1976; Scargle, 1982), phase dispersion minimization (PDM, Stellingwerf, 1978), and CLEAN algorithm (Roberts, Lehar, & Dreher, 1987). The PERIOD package also has the capability to detrend and to fold any data with a given period.
2.3 Secular variability in combined datasets
In performing the temporal analyses reported here, it became clear that there were apparently significant modulations present in a few cases, but these were of low amplitude (1% peak-to-peak). Given that our data were generated from independent telescopes with different detector/filter combinations, we decided to study randomly selected field stars in order to ascertain the properties of any secular, long-term variability that this might induce. For those of our SMC fields containing BeX targets that exhibited low-amplitude modulations, we selected 25 random, presumed “constant” stars for analysis in the same way as our targets.
Figure 1 summarises our results by displaying the peak L-S power observed for each random star plotted against the associated semi-amplitude (obtained by folding the data on that peak period and fitting a sine wave). Interestingly, approximately half of these random stars produced apparently significant peaks in the power spectrum (as defined by the white noise 99.9% confidence level). However, the amplitudes of these modulations are all low (1% peak-to-peak), and are all below the lowest amplitude modulations seen in any of our target BeX systems.
Nevertheless, where there is no independent detection of periodicities in our BeX targets (in either X-ray or optical) we have elected to report apparent detections at these low amplitudes as upper limits in table 3. This is only true in 6 cases, and has no impact on any of our subsequent results or conclusions.
It is possible that some of the highest power peaks in figure 1 are real, long-term modulations in these field early-type stars in the SMC. However, their low amplitudes will require more extensive observations and careful analysis for confirmation and follow-up. This could be an interesting research project in its own right.

| SXP0.09 | 00:42:35.4 | -73:40:34 | AX J0043-737 |
| SXP0.72 | 01:17:05.5 | -73:26:32 | 2U 0115-737, SMC X-1 |
| SXP0.92 | 00:45:35.0 | -73:19:02 | PSR J0045-7319 |
| SXP2.16 | 01:19:51.0 | -73:11:48 | XTE J0119-731 |
| SXP2.37 | 00:54:36.2 | -73:40:35 | H 0053-739, SMCX-2 |
| SXP2.76 | 00:59:11.3 | -71:38:45 | RX J0059.2-7138 |
| SXP3.34 | 01:05:09.7 | -72:11:46 | AX J0105-722, [MA93] 1506 |
| SXP4.78 | 00:52:06.6 | -72:20:44 | XTE J0052-723, [MA93] 537 |
| SXP6.85 | 01:03:24.0 | -72:43:00 | XTE J0103-728 |
| SXP7.78 | 00:52:07.7 | -72:25:50 | 2S 0050-727, [MA93] 531 |
| SXP7.92 | 01:01:56.0 | -72:32:36 | AZV285 |
| SXP8.02 | 01 00 43.1 | -72 11 33 | PSR J0100-7211 |
| SXP8.9 | 00:51:53.0 | -72:31:45 | RX J0051.8-7231,[MA93]506 |
| SXP9.13 | 00:49:13.8 | -73:11:36 | RX J0049.2-7311 |
| SXP11.5 | 01 04 41.4 | -72 54 04 | IGR J01054-7253 |
| SXP15.3 | 00:52:13.9 | -73:19:13 | RX J0052.1-7319,[MA93]552 |
| SXP16.6 | 00:50:00.0 | -73:16:00 | XTE J0050-732#1 |
| SXP18.3 | 00:49:11.4 | -72:49:37 | XMMJU004911.4-724939 |
| SXP22.1 | 01:17:41.4 | -73:30:49 | RX J0117.6-7330 |
| SXP25.5 | 00:48:14.1 | -73:10:03 | XMMU J004814.1-731003 |
| SXP31.0 | 01:11:08.4 | -73:16:46 | XTE J0111.2-7317 |
| SXP34.0 | 00:55:27.7 | -72:10:59 | CXOU J005527.9-721058 |
| SXP46.4 | 00:51:00.0 | -73:18:00 | XTE SMC46 |
| SXP46.6 | 00:53:55.0 | -72:26:47 | 1WGA J0053.8-7226 |
| SXP51 | 00:50:00.0 | -73:16:00 | XTE J0050-732#2 |
| SXP59 | 00:54:56.1 | -72:26:27 | XTE J0055-724, [MA93] 810 |
| SXP65.8 | 01:07:12.6 | -72:35:33 | CXOU J010712.6-723533 |
| SXP74.7 | 00:49:02.5 | -72:50:52 | AX J0049-729 |
| SXP82.4 | 00:52:09.1 | -72:38:03 | XTE J0052-725 |
| SXP89.0 | 00:53:54.0 | -72:26:42 | XTE POSITION A |
| SXP91.1 | 00:50:55.8 | -72:13:55 | RX J0051.3-7216, [MA93] 413 |
| SXP95 | 00:53:24.0 | -72:49:18 | XTE SMC95 |
| SXP101 | 00:57:26.8 | -73:25:02 | AX J0057.4-7325 |
| SXP138 | 00:53:23.8 | -72:27:15 | CXOUJ005323.8-722715 |
| SXP140 | 00:56:05.2 | -72:22:00 | XMMUJ005605.2-722200 |
| SXP144 | XTE SMC144s | ||
| SXP152 | 00:57:50.3 | -72:07:56 | CXOUJ005750.3-720756 |
| SXP164 | 01:05:00.0 | -72:06:21 | XTE POSITION B |
| SXP169 | 00:52:59.2 | -71:57:58 | RX J0052.9-7158, [MA93] 623 |
| SXP172 | 00:51:52.2 | -73:10:33 | RX J0051.9-7311, [MA93] 504 |
| SXP202A | 00:59:21.0 | -72:23:16 | 1XMMU J005921.0-722317 |
| SXP202B | 00:59:28.6 | -72:37:03 | XMMUJ005929.0-723703 |
| SXP264 | 00:47:23.4 | -73:12:27 | RX J0047.3-7312, [MA93] 172 |
| SXP280 | 00:57:48.4 | -72:02:42 | RX J0057.8-7202, [MA93]1036 |
| SXP293 | 00:58:11.7 | -72:30:50 | RX J0058.2-7231 |
| SXP304 | 01:01:01.1 | -72:06:57 | RX J0101.0-7206, [MA93]1240 |
| SXP323 | 00:50:44.7 | -73:16:05 | RX J0050.7-7316, [MA93]387 |
| SXP327 | 00:52:52.2 | -72:17:14 | XMMU J005252.1-721714.7 |
| SXP348 | 01:03:13.9 | -72:09:14 | AX J0103-722, [MA93] 1367 |
| SXP455 | 01:01:20.5 | -72:11:18 | RX J0101.3-7211, [MA93]1257 |
| SXP504 | 00:54:55.8 | -72:45:10 | AX J0054.8-7244, [MA93]809 |
| SXP564 | 00:57:36.2 | -72:19:34 | CXOUJ005736.2-721934 |
| SXP645 | 00:55:35.1 | -72:29:06 | XMMU J005535.2-722906 |
| SXP701 | 00:55:18.4 | -72:38:51 | XMMU J005517.9-723853 |
| SXP726 | 01:05:55.3 | -72:03:47 | RX J0105.9-7203, [MA93]1557 |
| SXP755 | 00:49:42.0 | -73:23:15 | RX J0049.7-7323, [MA93]315 |
| SXP893 | 00:49:29.8 | -73:10:58 | |
| SXP967 | 01:02:06.7 | -71:41:15 | CXOU J010206.6-714115 |
| SXP1323 | 01:03:37.5 | -72:01:33 | RX J0103.6-7201, [MA93]1393 |
| † [MA93] is related to the catalogue of emission-line stars and PNe by Meyssonnier & Azzopardi (1993). | |||
| SXP0.09 | 16.9 | SMC-SC3 | 6 | SMC128.4 | 118 | 34.9 [0.7-10 kev] | |||||
| SXP0.92 | 16.1 | B0.5-B2 | IV-V | 212.15676.64 | SMC-SC3 | 197970 | SMC125.3 | 19461 | 51 | ||
| SXP2.37 | 16.3 | O9.5 | III-V | SMC107.5 | 25 | 38.6 [2-25 kev] | |||||
| SXP2.76 | 14.0 | B1-B1.5 | II-III | SMC109.2 | 5 | 82.1 | 37.7 [0.1-2 kev] | ||||
| SXP3.34 | 15.6 | B1-B2 | III-V | 206.16890.17 | SMC-SC10 | 102553 | 35.1 [0.1-2 kev] | ||||
| SXP4.78 | 15.8 | B0-B1 | V | 207.16146.9 | 34.1 | 23.9 | 37.8 [3-10 kev] | ||||
| SXP6.85 | 14.5 | O9.5-B0 | IV-V | 206.16768.5 | SMC-SC9 | 146936 | 112 | 114 | 37.5 [2-30 kev] | ||
| SXP7.78 | 14.9 | B1-B1.5 | IV-V | 208.16088.4 | SMC101.3 | 33277 | 44.9 | 44.8 | 37.7 [2-10 kev] | ||
| SXP7.92 | 13.9 | O9 | 207.16714.4 | SMC-SC9 | 114259 | SMC110.5 | 5 | 36.8 | 36.8 [0.3-10 kev] | ||
| SXP8.9 | 14.8 | O9.5-B0 | IV-V | 208.16087.9 | SMC-SC6 | 85614 | SMC101.3 | 4737 | 28.4 | 33.4 | 36.1 [0.1-2 kev] |
| SXP9.13 | 16.5 | B1-B3 | IV-V | 212.15906.2446 | SMC-SC5 | 111490 | SMC100.7 | 63223 | 77.2 | 40.1 | 35.6 [0.7-10 kev] |
| SXP15.3 | 14.6 | O9.5-B0 | III-V | 212.16075.13 | SMC-SC6 | 99923 | SMC100.1 | 48026 | 28 | 75.1 | 37.1 [0.1-2 kev] |
| SXP18.3 | 15.6 | B0-B2 | V | 208.15911.13 | SMC-SC5 | 65500 | SMC101.8 | 19552 | 17.7 | 17.7 | 37.5 [0.2-10 kev] |
| SXP22.1 | 14.1 | O9.5-B0 | III-V | SMC116.1 | 3322 | 38.0 [0.1-2 kev] | |||||
| SXP25.5 | 15.2 | 212.15849.52 | SMC-SC4 | 171264 | SMC100.7 | 54315 | 35.3 [0.2-10 kev] | ||||
| SXP31.0 | 15.5 | O9.5-B1 | V | SMC116.6 | 33 | 90.4 | 38.3 [0.1-2 kev] | ||||
| SXP34.1 | 16.7 | B2-B3 | IV-V | SMC108.7 | 24657 | 35.0 [0.3-10 kev] | |||||
| SXP46.6 | 14.7 | O9.5-B1 | IV-V | SMC108.8 | 30 | 137 | 137 | 36.8 [0.1-2 kev] | |||
| SXP59 | 15.2 | O9 | V | 207.16259.23 | SMC-SC7 | 70829 | SMC105.5 | 35420 | 122 | 60.2 | 37.6 [2-10 kev] |
| SXP65 | 15.6 | B1-B1.5 | II-III | 110 | 35.8 [0.2-10 kev] | ||||||
| SXP74.7 | 16.9 | B3 | V | 208.15911.93 | SMC-SC5 | 65517 | SMC100.5 | 55158 | 61.6 | 33.4 | 36.7 [0.7-10 kev] |
| SXP82.4 | 15.0 | B1-B3 | III-V | 208.16085.24 | SMC-SC6 | 77228 | SMC101.2 | 12997 | 362 | 36.5 [0.3-10 kev] | |
| SXP91.1 | 15.0 | B0.5 | III-V | 208.16034.5 | SMC102.1 | 32 | 117 | 88.2 | 37.4 [0.1-2 kev] | ||
| SXP101 | 15.6 | B3-B5 | Ib-II | 211.16415.11 | SMC106.7 | 15343 | 25.2 | 21.9 | 36.0 [0.7-10 kev] | ||
| SXP138 | 16.1 | B1-B2 | IV-V | 207.16202.50 | SMC101.3 | 38781 | 103 | 125 | 35.0 [0.3-10 kev] | ||
| SXP140 | 15.8 | B1 | V | 207.16374.21 | SMC108.8 | 35838 | 197 | 34.6 [0.1-2 kev] | |||
| SXP152 | 15.6 | B1-B2.5 | III-V | SMC108.3 | 36 | 35.6 [0.1-2 kev] | |||||
| SXP169 | 15.5 | B0-B1 | III-V | SMC102.2 | 13410 | 68.5 | 67.6 | 37.3 [0.1-2 kev] | |||
| SXP172 | 14.4 | O9.5-B0 | V | 212.16077.13 | SMC-SC6 | 22749 | SMC100.2 | 44100 | 70 | 69.9 | 36.0 [0.2-10 kev] |
| SXP202A | 14.8 | B0-B1 | V | 207.16545.12 | SMC-SC8 | 151891 | SMC108.1 | 4929 | 91 | 35.5 [0.2-10 kev] | |
| SXP202B | 15.6 | B0-5 | III | 207.16541.15 | SMC-SC8 | 139407 | SMC105.3 | 29894 | 36.6 [0.2-10 kev] | ||
| SXP264 | 15.8 | B1-B1.5 | V | 212.15792.77 | SMC-SC4 | 116979 | SMC100.7 | 45007 | 49.1 | 36.2 [0.2-10 kev] | |
| SXP280 | 15.6 | B0-B2 | III-V | SMC108.3 | 16091 | 64.8 | 127 | 36.2 [0.1-2 kev] | |||
| SXP293 | 14.9 | B2-B3 | V | 207.16486.9 | SMC-SC8 | 94537 | SMC105.4 | 22335 | 151 | 59.7 | 35.6 [0.2-10 kev] |
| SXP304 | 15.7 | B0-B2 | III-V | 206.16663.16 | SMC-SC9 | 47428 | SMC108.3 | 12190 | 520 | 36.1 [0.1-2 kev] | |
| SXP323 | 15.4 | B0-B0.5 | V | 212.16019.30 | SMC-SC5 | 180026 | SMC100.2 | 48 | 116 | 35.4 [0.2-10 kev] | |
| SXP327 | 16.3 | 207.16147.60 | SMC101.4 | 25097 | 45.9 | 35.5 [0.2-10 kev] | |||||
| SXP348 | 14.7 | B0.5 | IV-V | 206.16776.17 | SMC-SC9 | 173121 | SMC108.8 | 33 | 93.9 | 36.0 [0.1-2 kev] | |
| SXP455 | 15.4 | B0.5-B2 | IV-V | 206.16662.14 | SMC-SC9 | 89374 | SMC108.2 | 34801 | 74.7 | 35.8 [0.7-10 kev] | |
| SXP504 | 14.9 | B1 | III-V | 207.16254.16 | SMC-SC7 | 47103 | SMC105.7 | 36877 | 265 | 273 | 35.7 [0.3-10 kev] |
| SXP564 | 15.9 | B0-B2 | IV-V | 207.16432.1575 | SMC-SC8 | 49531 | SMC108.1 | 19293 | 151 | 95.3 | 34.8 [0.3-10 kev] |
| SXP645 | 14.6 | B0-B0.5 | III-V | 207.16315.28 | SMC-SC7 | 137527 | SMC105.5 | 35415 | 35.6 [0.2-10 kev] | ||
| SXP701 | 15.8 | O9.5 | V | 207.16313.35 | SMC-SC7 | 129062 | SMC105.6 | 36015 | 412 | 35.6 [0.2-10 kev] | |
| SXP726 | 15.6 | B0.5-B3 | SMC-SC10 | 137851 | SMC113.3 | 10946 | 34.8 [0.1-2 kev] | ||||
| SXP755 | 14.9 | O9.5-B0 | III-V | 212.15960.12 | SMC-SC5 | 90506 | SMC100.8 | 22903 | 389 | 394 | 35.9 [0.2-10 kev] |
| SXP893 | 16.3 | SMC-SC5 | 111500 | SMC100.7 | 63151 | 34.5 [2-10 kev] | |||||
| SXP967 | 14.6 | B0-0.5 | III-V | SMC114.7 | 39 | 35.9 [0.2-10 kev] | |||||
| SXP1323 | 14.6 | B0 | III-V | SMC-SC10 | 37138 | SMC113.6 | 27699 | 26.1 | 36.8 [0.2-10 kev] | ||
| [1]: Kaspi et al. (1993) ; [2]: Schmidtke & Cowley (2006); [3]: Coe et al. (2005) ; [4]: McGowan et al. (2008) ; [5]: Cowley & Schmidtke (2004) ; [6]: Schmidtke, Cowley, & Udalski (2006) ; [7]: Schmidtke et al. (2004) ; [8]: Edge (2005a) ; [9]: McGowan et al. (2008) ; [10]: Schmidtke & Cowley (2005b) ; [11]: Schmidtke & Cowley (2007b) ; [12]: McGowan et al. (2007) ; [13]: Edge et al. (2005b); [14]: Coe et al. (2009); [15]: Schurch et al. (2009); [16]: Udalski & Coe (2008) | |||||||||||
| †X-ray orbital period from Galache et al. (2008) paper. | |||||||||||
| ‡Previously reported optical orbital period. | |||||||||||
| ⋆Source of Popt: M for MACHO project, O for OGLE, OM for both of the data, and R for radio. | |||||||||||
3 Temporal properties of individual sources
3.1 SXP0.09 (AX J0043-737)
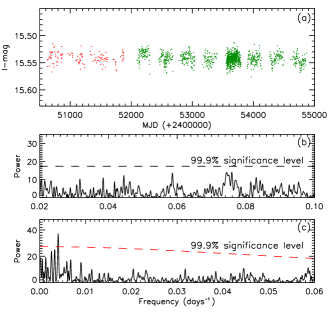
The 87.58 ms X-ray pulsation from this source was detected by Yokogawa & Koyama (2000) during ASCA observations of the SMC on 1999 May 10-11. Optically identified as SMC-SC3 6 (Udalski, 2008), this source is not however present in the catalogue of emission-line stars and PNe (Meyssonnier & Azzopardi, 1993, hereafter MA93).
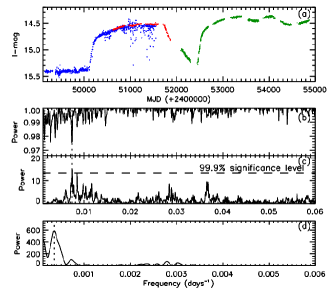
Figure 2a shows the combined OGLE II and OGLE III lightcurve of SXP0.09 (MACHO data is not available) which is very steady, to within 0.05 mag. Its orbital period has not yet been reported, but both the LS periodogram and PDM revealed a strong peak well above the 99.9 confidence level relative to both white and red noise 555Red noise is calculated using REDFIT (Schulz, 2002) (www.ncdc.noaa.gov/paleo/softlib/redfit/redfit.html) at a period of 247 5 d ( Figure 2c). We did not find any significant shorter period in the periodogram (Figure 2b).
3.2 SXP0.92 (PSR J0045-7319)
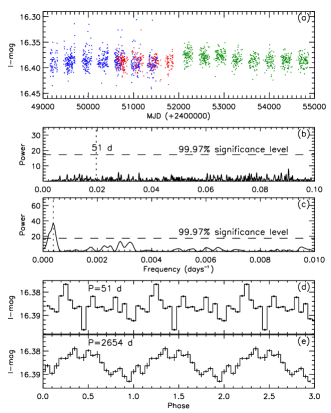
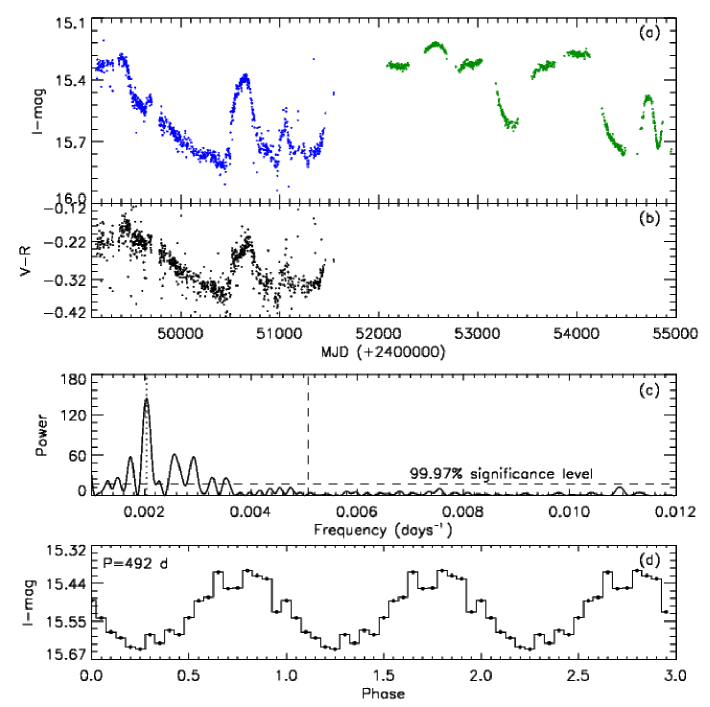
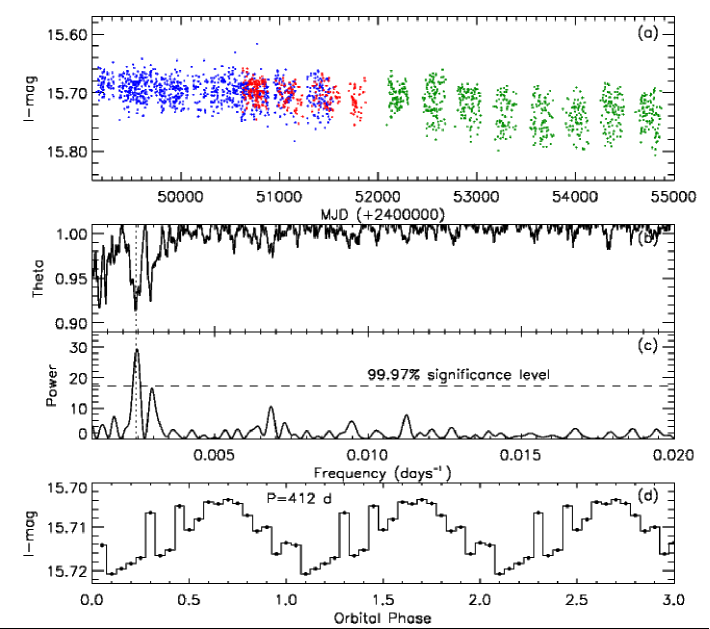
SXP0.92 was first discovered by Ables et al. (1987) as a 0.926499 s radio pulsar. Bell (1994) identified its optical companion as a 16th magnitude, 11 , B1 main-sequence star. The orbital period (51 d) of PSR J0045-7319 was found by Kaspi et al. (1993) through the Doppler modulation of the pulse period.
Our combined light curve of SXP0.92 (Figure 3a) reveals no optical signature of the 51 d periodicity, but it does clearly display an almost sinusoidal 2600 d superorbital modulation. This appears as a strong peak in the LS periodogram at a frequency corresponding to 2654 298 d (Figure 3c). The folded light curve on this period is shown in Figure 3d. Whilst this periodicity is very close to half the total observing time, the modulation is in fact clearly visible in the raw light curve (Figure 3a).
We did not find any significant peak at the previously reported 51 d period, but the data folded on this period shows a low amplitude ( 0.01 mag) modulation (Figure 3d).
3.3 SXP2.37 (SMC X-2)
SMC X-2 is a long-established X-ray source detected in the SMC by SAS-3 (Li, Jernigan, & Clark, 1977). The optical counterpart of SMC X-2 was identified by Pesch, Sanduleak, & Philip (1977) as a 14th magnitude OB star, and this identification was supported by spectroscopic observations (Allen, 1977).
Schurch, Udalski, & Coe (2008) found a variation in the OGLEIII data of SXP2.37 with a period of 18.62 0.02 d, and proposed that it is the orbital period. However, Schmidtke, Cowley, & Udalski (2009) have suggested that this modulation is not orbital, but is instead the beat period between two non-radial pulsations (P=0.8592 d and 0.9008 d) of the primary star. We note that our OGLE III data has only one data point per night (only 3 nights have two). The OGLE III light curve of SXP2.37 clearly shows the 18.6 d variation (Figure 4a). We have detrended the OGLE III data and found peaks at 18.580.003 d, and its harmonics at 9.3 and 6.2 d (see Figure 4c), which is similar to those reported by Schurch, Udalski, & Coe (2008). The light curve folded on the 18.58 d period shows interesting evolution from apparent maxima to dips in each cycle (Figure 4d and e). This will be discussed further later.

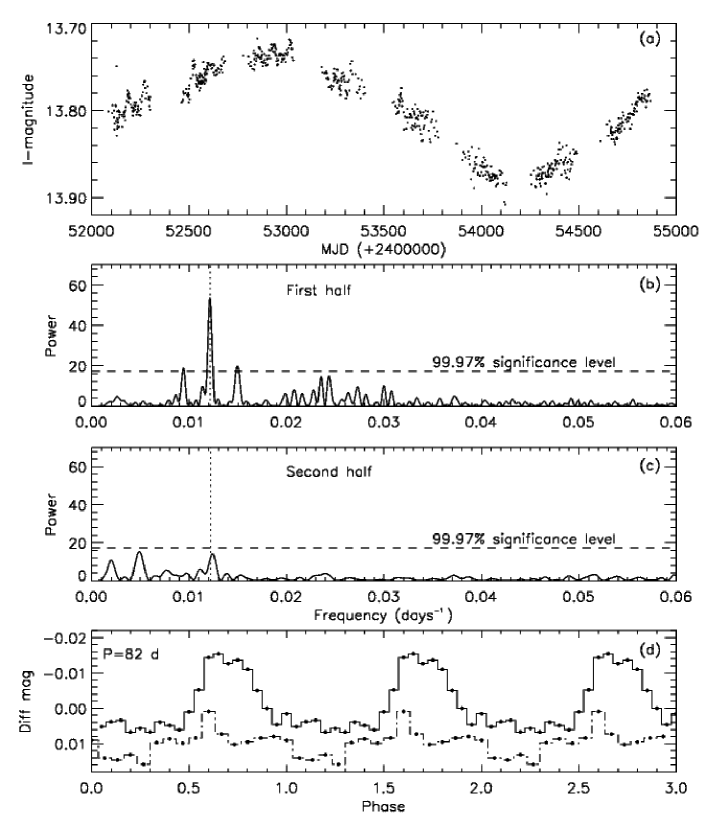
3.4 SXP2.76 (RX J0059.2-7138)
The 2.76 s pulsation from RX J0059.2-7138 was detected with ROSAT (Hughes, 1994). Schmidtke & Cowley (2006) found the orbital period of SXP2.76 which is clearly seen as repeated, low-amplitude outbursts every 82.1 days.
The source lies outside MACHO and OGLE II fields, but the OGLE III light curve for this X-ray pulsar (Figure 5a) shows an exceptionally clear sinusoidal variation of large (0.2 mag) amplitude with a period of about 2800 d, which is comparable to the duration of the dataset. The first half of the detrended data (before MJD 53500) shows a very regular set of outbursts on the orbital period = 820.07 d (Figure 5b). In the second half, the amplitude of these outbursts is very low, and they completely disappear during global minimum. The power spectrum of the detrended second part of the OGLE III data does not show any significant peak (Figure 5c).
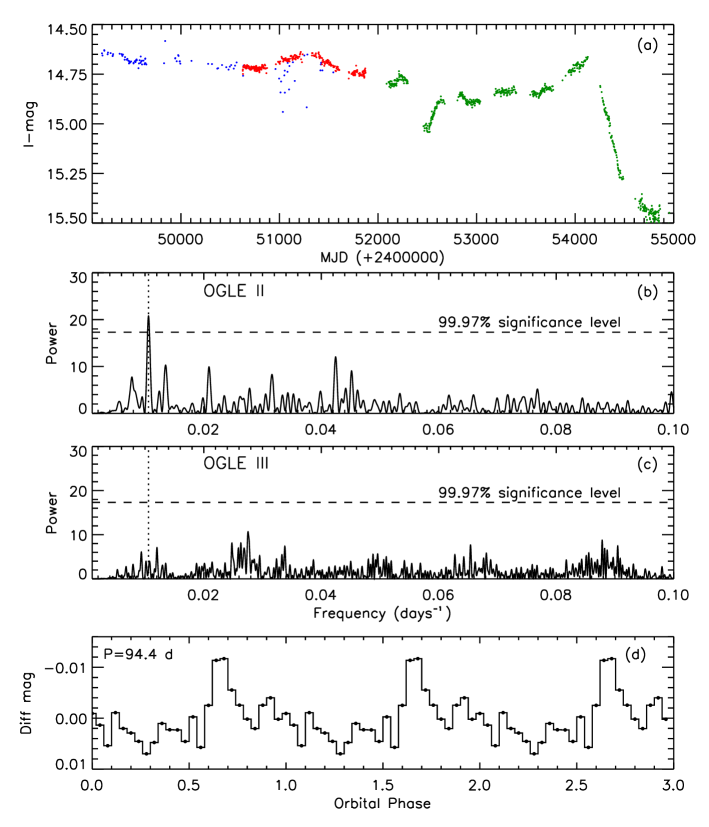
3.5 SXP3.34 (AX J0105-722)
Coe et al. (2005) identified the optical counterpart of AX J0105-722 as MA[93]1506 and found a period of 11.09 d in the MACHO data which they proposed to be the orbital period. However, Schmidtke & Cowley (2005a) again reported the presence of non-radial pulsations in the same MACHO data, the period being 1.099 d. They also suggested that the 11.09 d signal is an alias of this shorter period.
The combined MACHO and OGLE II light curve of SXP3.34 is presented in Figure 6a and is very stable to within 0.05 mag, although a several hundred day modulation is descernible. Our power spectrum shows a significant peak at 11.070.01 d (Figure 6b). The light curve folded on the 11.07 d period is shown in Figure 6e. The LS periodogram of the combined light curve shows a significant peak at 99% confidence level with a much longer, but low amplitude super-orbital period of 4952 d (Figure 6c).

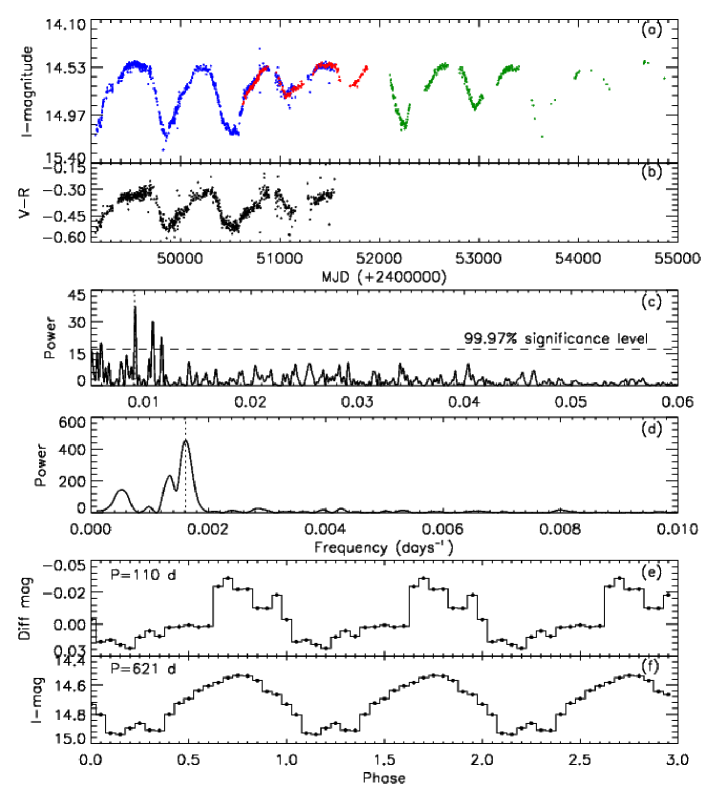
3.6 SXP6.85 (XTE J0103-728)
X-ray pulsations at 6.85 s from XTE J0103-728 were first detected by Corbet et al. (2003a). Subsequently, an accurate position was determined with XMM-Newton by Haberl, Pietsch, & Kahabka (2007) during an outburst in 2006 October, from which they identified the optical counterpart as a 14th magnitude Be star. Schmidtke & Cowley (2007a) have analyzed its lightcurve from MACHO observations and suggested an orbital period of 24.82 d. However, from the combined MACHO and OGLE datasets McGowan et al. (2007) found an optical period of 114 d which is similar to the X-ray period of 112.5 d reported by Galache et al. (2008) and is presumed to be orbital in origin.
We have detrended the complete datasets from MACHO, OGLE II and OGLE III, and found a significant peak at 1100.2 d (Figure 7c), which is very similar to the previously reported periods. The folded light curve on this period shows a transient-like profile typical of BeX systems (Figure 7e).
The MACHO and OGLE light curves are presented in Figure 7a, and reveal a long-term variation of very large amplitude (). The power spectrum of the combined MACHO and OGLE light curves shows a large peak at 621 4 d which is consistent with the ‘recurrence time’ mentioned by Schmidtke & Cowley (2007a).
The colour variation of SXP6.85 is also plotted, and the source is brighter when it is redder (Figure 7b). This is the opposite to that seen in A0538-66 where the source is bluer when it is brighter and strong outbursts occur only during optical minimum (Alcock et al., 2001). It is interesting to note that the color variation continues to increase until 100 days after the maximum brightness of the source, i.e., there is an offset (or lag) between the maximum of colour and brightness variations.
McGowan et al. (2007) have not found any correlation between X-ray and optical activity for this source and suggest that it could be a low eccentricity system.
3.7 SXP7.78 (2S 0050-727)
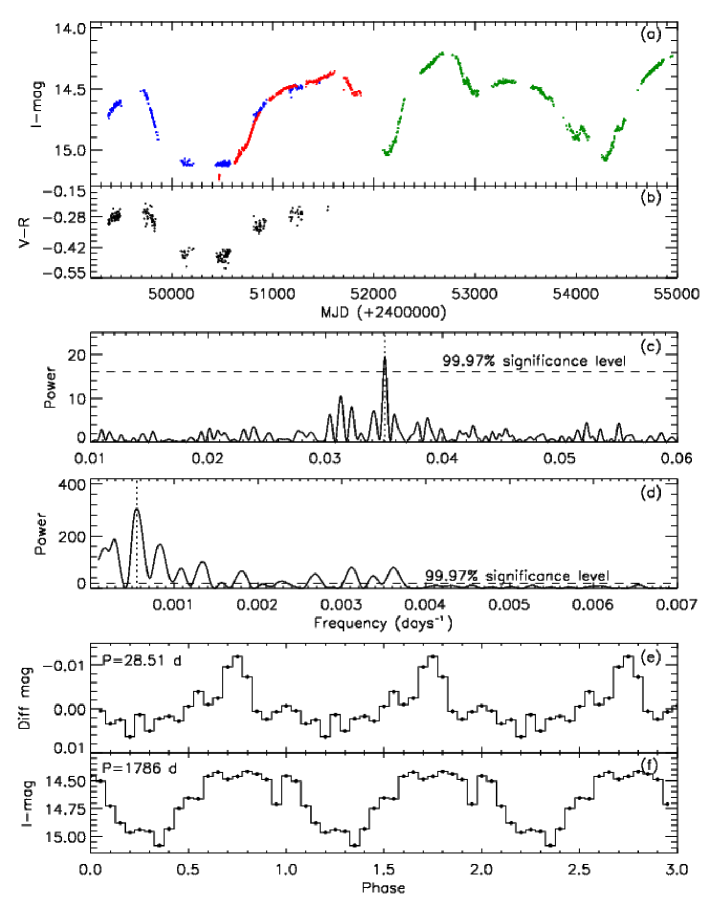
The optical counterpart of SXP7.78 is MA[93]531 or MACHO 208.16088.4 (Coe et al., 2005). From X-ray observations with RXTE, Galache et al. (2008) found a series of outbursts with a period of 44.920.06 d which is consistent with the presumed orbital period of 44.6 d found in the MACHO lightcurve (Coe et al., 2005).
The OGLE III lightcurve in Figure 8b shows clearly the regular orbital outbursts, as is also reflected in the power spectrum of the detrended data at a period of 44.920.2 d (Figure 8c). It is also clear that the amplitude of the outbursts vary with the source brightness.
The combined MACHO and OGLE III light curves of Figure 8a show substantial long-term variability, which is responsible for the LS power spectra peaks at 111656 d, and 2029186 d. The peak at 0.002739 d-1 (P=365 d) is due to the annual sampling of the data.
SXP7.78 is one of the BeX systems which shows clear optical periodic outbursts even when the source is at optical minimum in the superorbital cycle (see Figure 8b). Furthermore, the strength of its outbursts appears to vary with its optical brightness, being very strong at optical maximum, but always present throughout the 2029 d cyclic variation.

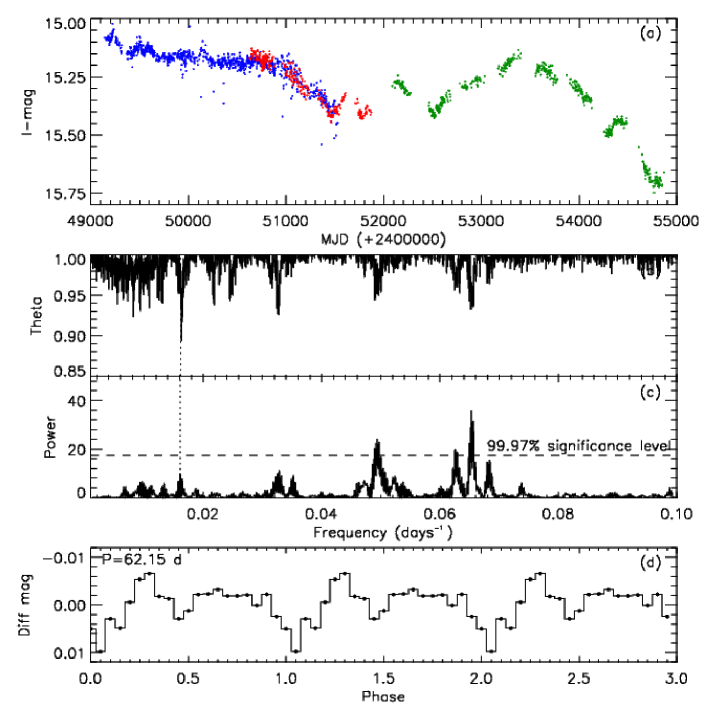
3.8 SXP7.92 (AZV 285)
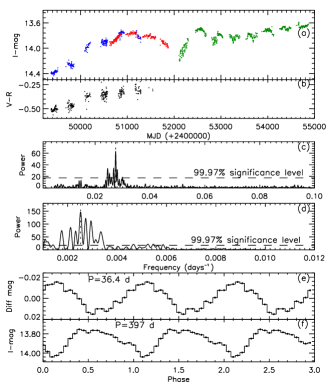
The pulse period of 7.92 s of this source was discovered recently by Corbet et al. (2008) using RXTE/PCA. Its possible optical counterpart is discussed in Coe et al. (2009), who identified it as AzV285 with an orbital period of 36.8 d.
The power spectrum of the long-term combined light curve reveals strong low-frequency power, with a peak at 3972 d (Figure 9d) and the detrended light curves show a peak at 36.40.02 d (Figure 9c), very similar to the presumed orbital period. The folded light curves on these periods are presented in Figure 9e and 9f, where the long-term one has a clear asymmetric profile.
The light curve of SXP7.92 exhibits large (1 mag) variations and becomes redder when it is brighter (suggesting a low inclination system), and the orbital modulation is always present. But, as seen in the OGLE III light curve (Figure 10), when the Be star is close to maximum (I13.7), the strength of the normal periodic modulation becomes very weak. Optically at maximum, SXP7.92 is the brightest BeX system in the SMC.

3.9 SXP8.88 (RX J0051.8-7231)
This source was discovered to be an X-ray pulsar by Israel et al. (1997). Its optical counterpart was proposed by Haberl & Pietsch (2004) to be MA[93]506. Schmidtke, Cowley, & Udalski (2006) found a weak period of 33.4 d in the early OGLE II data which they suggested as the orbital period. From RXTE observations of the SMC, Corbet et al. (2004a) suggested an X-ray orbital period of 28.47 d.
Given the large amplitude long-term variation present in the combined MACHO and OGLE lightcurves of SXP8.88 (Figure 11a), it is not surprising that the power spectrum has significant low-frequency power with a peak at 178632 d (Figure 11d).
We have only selected and detrended the data during the bright phase (MJD 51000-52000 and MJD 52400-53400). The power spectrum of our detrended OGLE light curve shows a significant peak at a period of 28.510.01 d which is very close to the X-ray period reported by Corbet et al. (2004a) (Figure 11c). The folded light curve on this 28.51 d period is shown in Figure 11e, however, the amplitude is very weak.
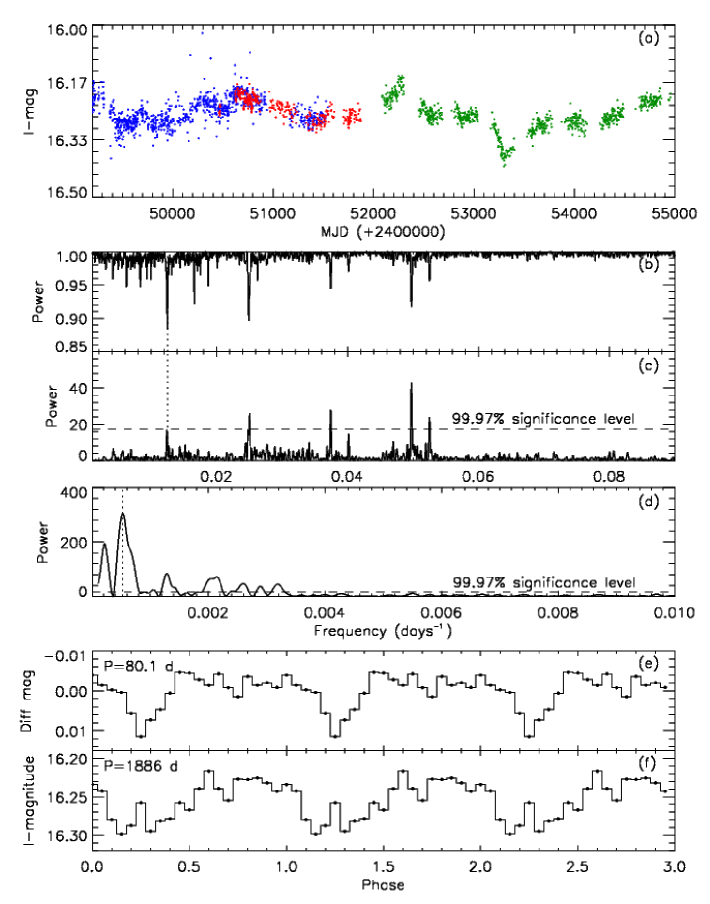
3.10 SXP9.13 (AX J0049-732)
This source was found to be a 9.1321 s X-ray pulsar by Imanishi, Yokogawa, & Koyama (1998). Schmidtke et al. (2004) proposed RX J0049.5-7310 as a ROSAT counterpart of this ASCA pulsar. However, Coe et al. (2005) pointed out that RX J0049.5-7310 lies well outside the revised X-ray error circle presented in Ueno et al. (2001) and proposed RX J0049.2-7311 to be the more likely ROSAT counterpart, and identified its optical counterpart. A period of 40.17 d was reported by Edge (2005a), however Galache et al. (2008) suggested an X-ray orbital period of 77.2 0.3 d.
We detrended the OGLE II and OGLE III data by subtracting a linear fit to the long-term trends. The periodograms revealed a peak at 80.10.06 d in both PDM and L-S periodograms, plus its harmonics at 20, 26.6 and 40 d (figure 12b and 12c). This period is very similar to the X-ray orbital period found by Galache et al. (2008) and twice the optical period reported by Edge (2005a). The folded light curve on the period of 80.1 d is shown in Figure 12e. The shape of the light curve is unusual with a dip of low amplitude.
The power spectrum of the combined long-term light curves has a strong peak with a superorbital period of 188635 d (Figure 12d). The folded light curve on this longer period is shown in Figure 12f.
3.11 SXP15.3 (RX J0052.1-7319)
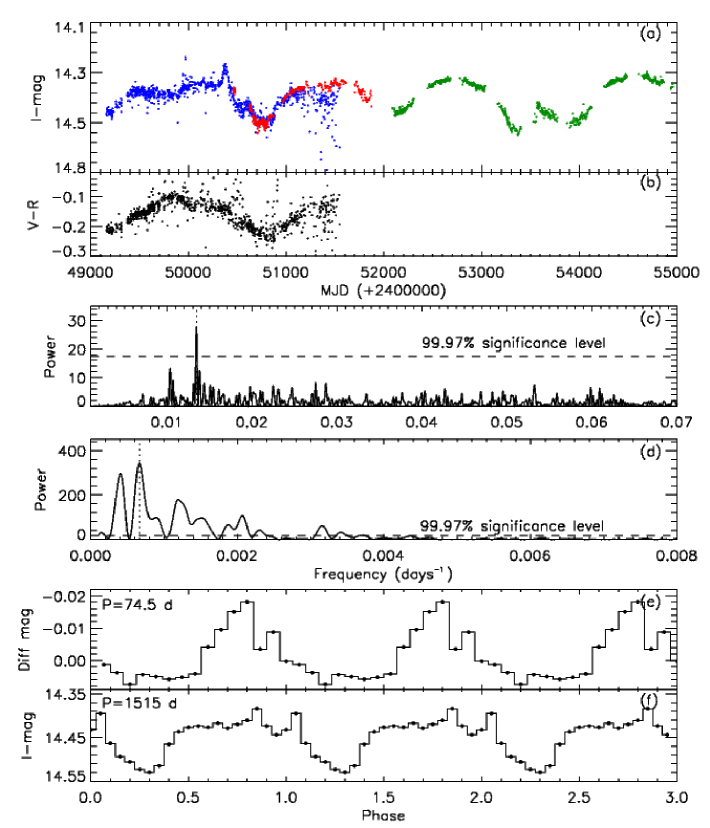
The 15.3 s pulsations from RX J0052.1-7319 were discovered by Lamb et al. (1999). Subsequently, Israel et al. (1999) proposed its optical counterpart to be a B-type star, which was confirmed spectroscopically by Covino et al. (2001).
The combined MACHO and OGLE light curves (Figure 13d) display substantial, long-term, quasi-periodic variations of 151523 d, and the light curve folded on this superorbital period is shown in Figure 13f. The power spectrum of the detrended OGLE II and OGLE III light curves also show a peak at 74.50.05 d (Figure 13c) which is consistent with the orbital period of 75.1 d found by Edge (2005a). Figure 13e shows the detrended light curve folded on this period. The 74.5 d modulation is present throughout the 1515 d cycle.
3.12 SXP18.3 (XMMJU004911.4-724939)
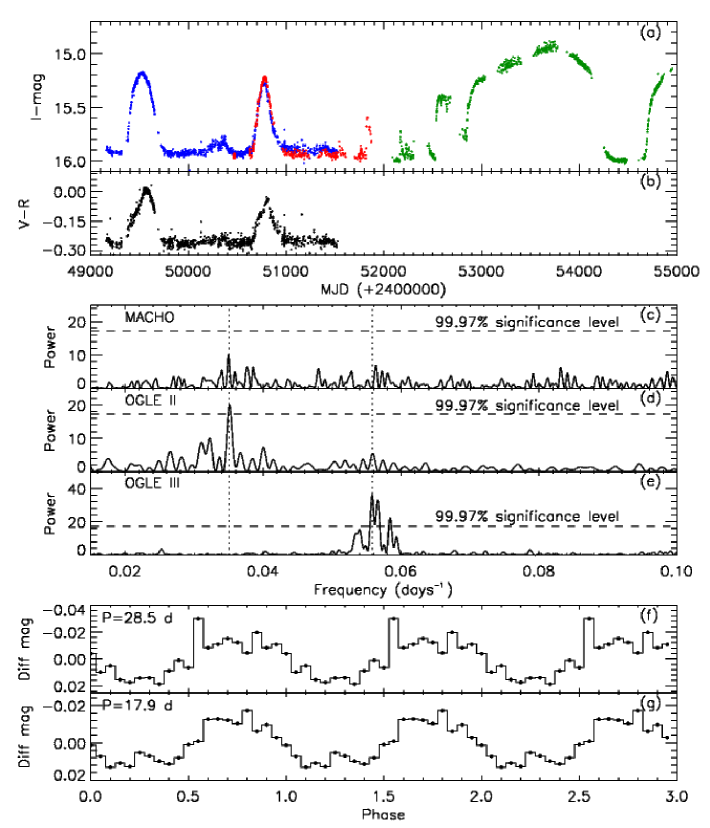
This X-ray source was discovered to be an X-ray pulsar by Corbet et al. (2003b) with a period of 18.370.01 s. The XMM-Newton position (Eger & Haberl, 2008) allowed its optical counterpart to be identified as a V=16 star (Zaritsky et al., 2002). A presumed orbital period of 17.79 d was found using both optical (Udalski & Coe, 2008; Schurch et al., 2009), and X-ray observations (Galache et al., 2008). The temporal analysis finds no significant long-term periodicities in the combined light curves, although there are extreme excursions () on timescales of 2000 d (Figure 14a). In Figure 14b, it is clear that the source becomes redder when it brightens.
We have detrended the MACHO and OGLE datasets and examined their temporal properties in sections with surprising results. The light curves from the MACHO, OGLE II, and the first year of OGLE III data show a clear variation of 28.50.01 d, which appears as a significant peak in its power spectrum (Figure 14c and 14d). The folded light curve on this period (Figure 14f) shows a clear sinusoidal variation. However, for the OGLE III data (from MDJ 53000), its power spectrum shows a significant peak at a period of 17.90.01 d (Figure 14e), which is very similar to the reported X-ray 17.73 d period by Galache et al. (2008). The folded light curve on this period is shown in Figure 14g.
The optical modulation of 28.5 d only appears in the MACHO, OGLE II, and first year of the OGLE III data where I 15.9. But, when the source becomes brighter (I 15.2) the modulation at 17.9 d starts to be seen in the light curve (Figure 15).
We note that the 28.5 d modulation disappears during and after the long type II outburst which lasts for about 1500 d even as the brightness of the source is returning to its quiescent state (I 15.9). Both modulations are of low amplitude.

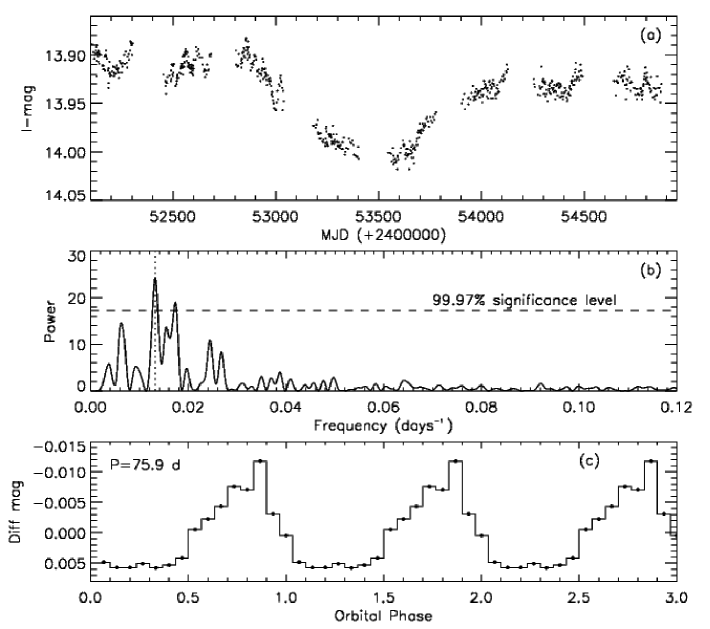
3.13 SXP22.1 (RX J0117.6-7330)
This was first discovered with ROSAT by Clark, Remillard, & Woo (1996) as an X-ray transient. Then, Charles, Southwell, & O’Donoghue (1996) identified its optical companion as a 14.2 mag OB star which was confirmed by Coe et al. (1998) as a Be(B1-2) star. The 22 s pulsation was found by Macomb et al. (1999).
After detrending the data by subtracting a linear fit, we found a peak at a period of 75.90.06 d in its power spectrum (Figure 16b). The 75.9 d orbital outbursts appear to be strong when the source is brighter, and very weak at optical minima (Figure 16a). The folded light curve on this period is shown in Figure 16c. The long-term light curve is clearly variable on a timescale of 2000 d, which is comparable to the duration of the dataset.
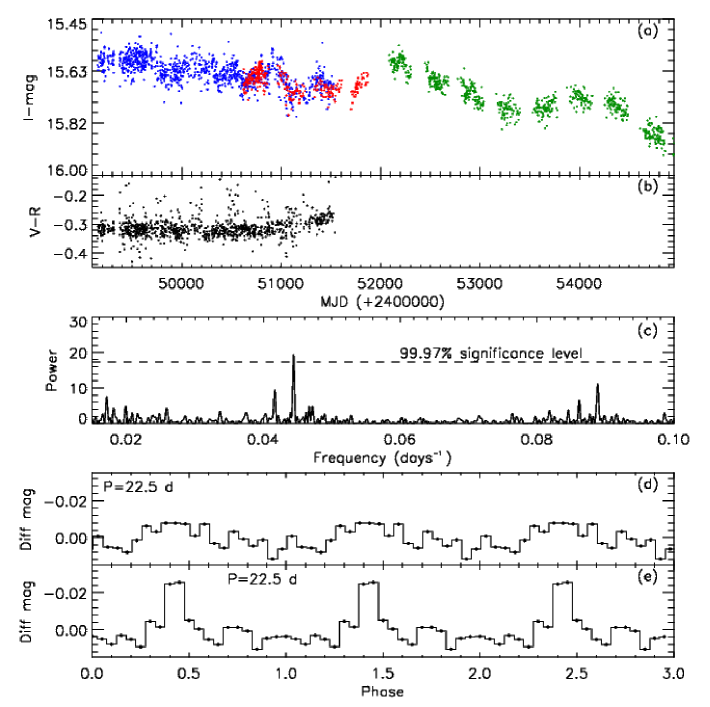
3.14 SXP25.5 (XMMU J004814.1-731003)
Lamb et al. (2002) found the 25.55 s pulsation of this X-ray source. The accuracy of its X-ray position with XMM allowed its optical companion to be identified as a V=15.5 star by Haberl et al. (2008b).
Analysis of the detrended OGLE III data reveals a significant peak at a period of 22.50.005 d (Figure 17c). The 22.5 d period appears to be caused by several outbursts in the OGLE III data, and the folded light curve on this period shows a typical BeX outburst behaviour (Figure 17e).
We subdivided the OGLE III data into two parts, and then we folded it on the above period. The amplitude of the outbursts appear to vary as a function of brightness, they are weak when the source is brighter (first part of OGLE III data) and strong as the source becomes fainter (second part) (Figure 17d and 17e). Furthermore, the colour variation in Figure 17b shows a behaviour similar to that seen in A0538-66, where the source is bluer when brighter.
3.15 SXP31.0 (XTE J0111.2-7317)
SXP31.0 was first discovered with ASCA by Chakrabarty et al. (1998) as a 31s X-ray pulsar. Its optical companion was identified as a B0-B2 star by Coe, Haigh, & Reig (2000). Schmidtke & Cowley (2006) reported an orbital period of P = 90.4 d using OGLE III data.
After detrending the OGLE III light curve, we find a period of 90.570.08 d, very similar to that already reported (Figure 18b). The light curve folded on this period is shown in Figure 18c. This classic BeX profile with outbursts every 90.57 d indicates that it is certainly the orbital period of SXP31.0. It is present even when the source is at optical minimum. Furthermore, the amplitude of the outbursts varies, being very strong during the two first years and one very strong outburst near the end of the OGLE III observations.
We do not find any long-term periodicity from the lightcurve (Figure 18a), although it is clearly variable on a timescale of 2000 d.

3.16 SXP34.1 (CXOU J005527.9-721058)
The 34 s pulsation from this source was found by Edge, Coe, & McBride (2004) using Chandra data. The precise X-ray position led to an optical identification as a B-type star (Coe et al., 2005). The orbital period of SXP34.1 has not yet been reported.
The brightness of this BeX source is remarkably constant at I 16.82 during all OGLE III observations (Figure 19a). However, its power spectrum shows a marginally significant peak at 5983.6 d (Figure 19b) with a very low amplitude.
However, we note that an orbital period of 598 d is too long for a 34 s BeX source based on the Corbet pulse/orbital period relationship.

3.17 SXP46.6 (1WGA J0053.8-7226)
Marshall, Lochner, & Takeshima (1997) initially reported a pulse period of 92 s from this source, but further analysis of the ASCA observations by Corbet et al. (1998) revealed the period to be 46.63 0.04 s. McGowan et al. (2008) confirmed its optical counterpart to be Star B from Buckley et al. (2001) with an optical orbital period of 136 2 d (based on the data of Figure 20a), consistent with the X-ray period found by Galache et al. (2008).
The light curve of SXP46.6 shows not only one but two peaks for each periastron passage of the X-ray pulsar. The power spectrum of the detrended light curve reveals significant peaks at 136.40.2 and 17.20.003 d (Figure 20b). The light curve folded on 136.4 d is typical of BeX orbital behaviour, which is shown in Figure 20c. The 17.2 d appears to be the time interval between the two peaks in each orbital cycle.
We also find that the amplitude of the outbursts appears to become weaker as the source fades (Figure 20a). The OGLE III light curves show a large amplitude, long-term variation of about half a magnitude on timescales 2000 d, comparable to the duration of the dataset.

3.18 SXP59.0 (XTE J0055-724)
This source was reported as a 59.00.2 s X-ray pulsar by Marshall et al. (1998). Its optical companion is identified as MA[93]810 and MACHO 207.16259.23. Schmidtke & Cowley (2005b) reported an orbital period of 60.2 d in the OGLE II data. However, Galache et al. (2008) suggested an X-ray orbital period of 122.10.38 d in their RXTE data.
The power spectrum (PDM and L-S ) of our detrended MACHO and OGLE combined lightcurve has a significant peak at 62.150.04 d, consistent with that previously reported, and its harmonics at 15, 20, and 30 d (Figure 21b, and 21c). We note that Galache et al. (2008) found an X-ray period of 122 d which is about twice our value. The light curve folded on 62.15 d is shown in Figure 21d. The long-term light curve exhibits a large amplitude ( 0.5 mag) variability on a timescale of 3000 d.
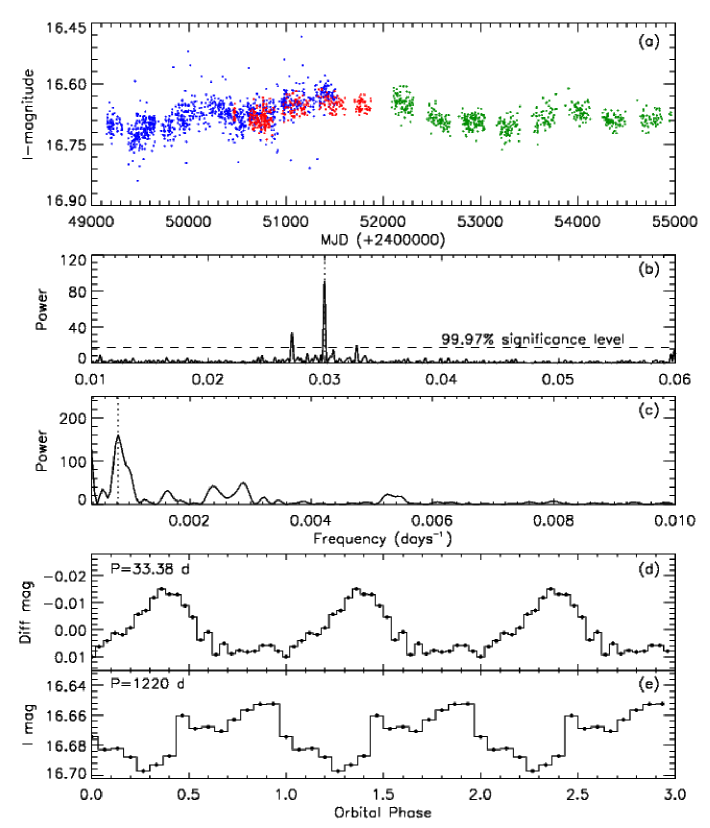
3.19 SXP74.7 (AX J0049-729)
The 74.7 s pulsation from AX J0049-729 was discovered by Yokogawa & Koyama (1998d). Schmidtke & Cowley (2005b) reported an orbital period of 33.40.4 d in the MACHO lightcurve of this source.
The power spectrum of the detrended light curve of the complete MACHO and OGLE observations shows a very significant peak at a period of 33.38 0.01 d (Figure 22b), similar to that already reported. The light curve folded on this period is shown in Figure 22d.
The power spectrum of the long-term light curve shows a peak at 122064 d (Figure 22c), and the light curve folded on this period is shown in Figure 22e.
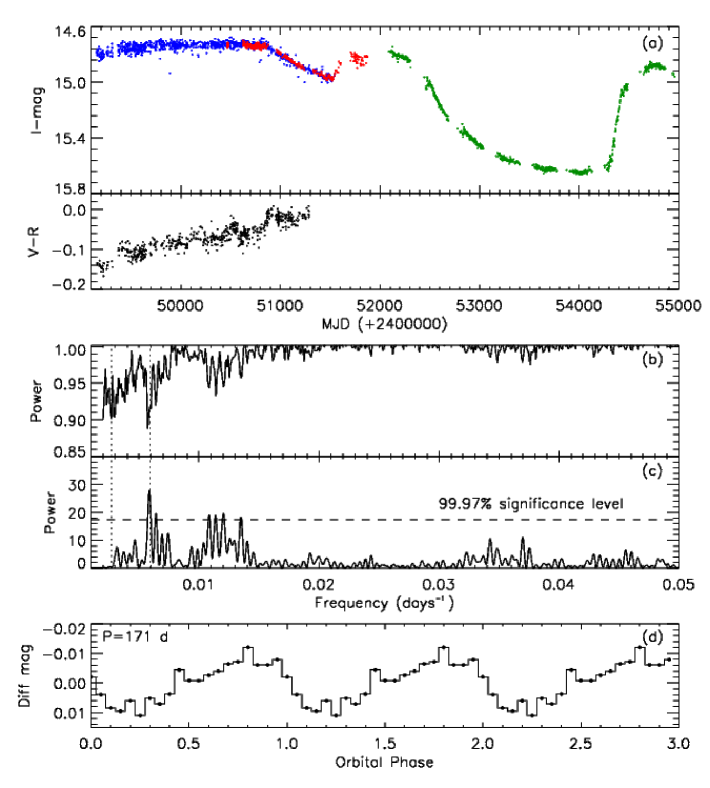
3.20 SXP82.4 (XTE J0052-725)
Corbet et al. (2002) first observed the pulse period of 82.4s for this X-ray pulsar with RXTE. Its position was determined from Chandra data by Edge et al. (2003b).
Its long-term light curve appears to be constant until MJD50800, following which it shows a dramatic variation on timescales 2000 d, and declining by 1 mag (see Figure 23a).
Schmidtke & Cowley (2005b) have studied the MACHO dataset but were unable to find any signature of its orbital period. However, Galache et al. (2008) reported an X-ray period of 362.3 d, and derived the X-ray outburst ephemeris.
We have split the OGLE III datasets into two parts. The power spectra (PDM and L-S) of both parts show a significant peak at 1710.3 d, which is less than half the reported X-ray period (Figure 23b). The PDM shows a peak at 370.2 d, very similar to the previously reported X-ray period, but it may be caused by the annual sampling of the data. The light curve folded on the 171 d period is shown in Figure 23d.
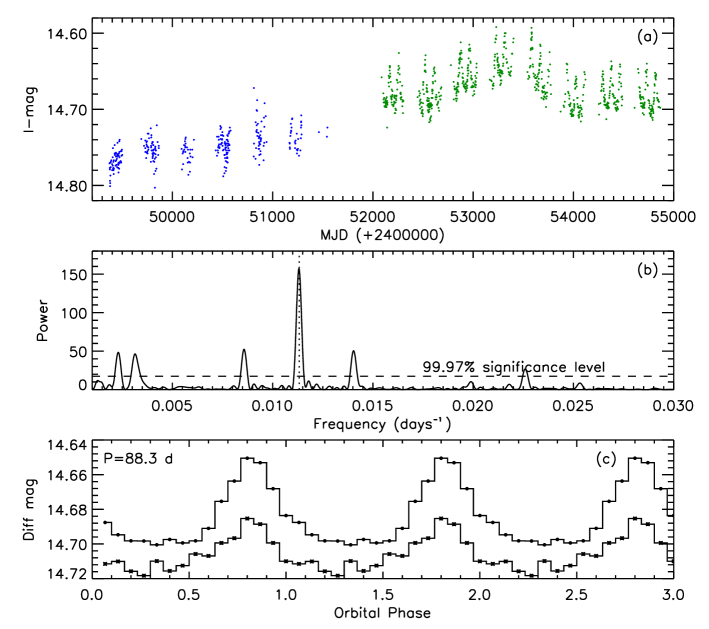
3.21 SXP91.1 (RX J0051.3-7216)
The 91.12 s pulse period of this X-ray pulsar was reported by Corbet et al. (1998). Stevens, Coe, & Buckley (1999) proposed its optical counterpart as an H emitting object MA[93]413 (Schmidtke et al., 2004). An orbital period of 88.25 d was found by Schmidtke et al. (2004) in the MACHO light curve.
The power spectrum of the detrended light curves reveals a very significant peak at 88.30.1 d (Figure 24b). The folded light curve on the 88.3 d period is shown in Figure 24c. The combined long-term light curve varies on timescales of 4000 d. Moreover, the amplitude of the 88.3 d outbursts was clearly variable throughout this 4000 d cycle, appearing stronger when the source brightens (Figure 24a).
3.22 SXP101 (AX J0057.4-7325)
This variable X-ray source was found to be a 101.45 s X-ray pulsar by Yokogawa et al. (2000a). McGowan et al. (2007) confirmed its optical counterpart as a V = 14.9 star with a period (presumed to be orbital) of 21.9 d in both MACHO and OGLE III light curves.
We detrended the complete MACHO and OGLE III datasets and found a peak consistent with the previously reported period at 21.950.004 d (Figure 25b). The light curve folded on this period is shown in Figure 25d. The power spectrum of the combined light curve of SXP101 also shows peaks at 7586 d and 355 d (Figure 25c). The peak at 355 d is due to the data sampling. The folded light curve on the 758 d period is shown in Figure 25e.

3.23 SXP138 (CXOU J005323.8-722715)
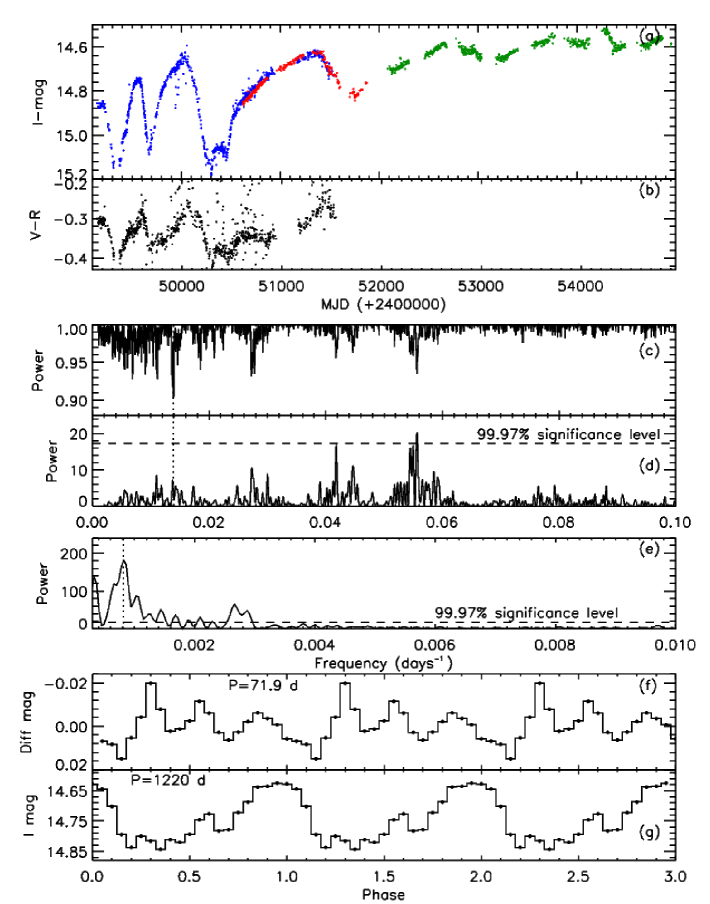
The 138.04 s pulse period of this source was reported by Edge, Coe, & McBride (2004) using archival Chandra data. It was identified with MA[93]667 and found to have a period of 125 d in MACHO data (Edge, 2005a). This was confirmed by Schmidtke & Cowley (2006) who found a period of 122-123 d.
The L-S power spectrum of the detrended MACHO and OGLE III data shows a significant peak at 71.80.1 d, however the deepest peak in the PDM occurs at twice this value, 1430.2 d (Figure 26b, and 26c). We found a very weak peak at 125 d, but in the MACHO data only.
The long-term light curve shows a large variation of about 0.4 mag with a period of 2700 d.
3.24 SXP140 (XMMU J005605.2-722200)
Sasaki, Pietsch, & Haberl (2003) discovered this 140 s pulsar in XMM-Newton observations, whose accurate X-ray position clearly identifies it with MA[93]904. Schmidtke & Cowley (2006) found a 1975 d period in a segment of MACHO light curve (MJD 49650-50500) which they suggested as the orbital period.
The light curves show large amplitude, long-term variations of half a magnitude, but the power spectrum of the OGLE III light curve reveals nothing significant at the previously reported orbital period. However, it does show a very strong peak at 4922.4 d (Figure 27c), and the combined light curve folded on this period is shown in Figure 27d.
Figure 27b shows the colour variation MACHO which correlates closely with the flux modulation. A lag between the MACHO colour and brightness variation is also seen at its optical maximum.
3.25 SXP172 (RX J0051.9-7311)
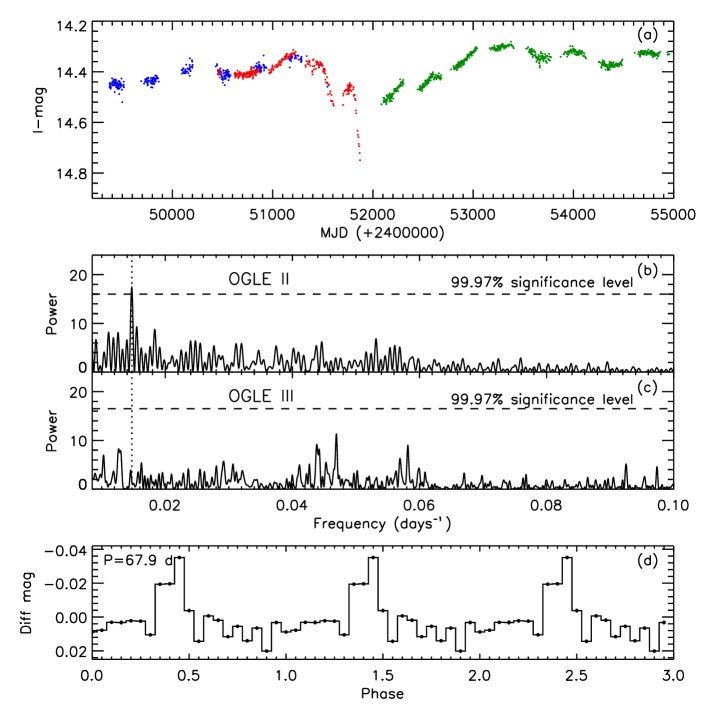
The optical counterpart of this source was identified as a Be star by Cowley et al. (1997), and is also known as MA[93]504. Subsequently, Yokogawa et al. (2000b) found an X-ray pulsation with a period of 172.4 s, which was refined by Haberl & Pietsch (2004) to 172.210.13 s. Laycock et al. (2005) reported a 675 d period based on several X-ray outbursts. An orbital period of 69.90.6 d was proposed by Schmidtke & Cowley (2006) using only the first two years of the OGLE II data (which they named Segment A).
Our power spectrum of the detrended OGLE II light curve shows a peak at 67.90.04 d (Figure 28b), close to that previously reported. However, the OGLE III power spectrum (Figure 28c) does not show a peak at this period. The folded OGLE II light curve on the 67.9 d period is shown in Figure 28d. The long-term light curve shows a large amplitude variation on a timescale of 2000 d (Figure 28a).
3.26 SXP202A (1XMMU J005921.0-722317)
Majid, Lamb, & Macomb (2004) discovered the 202 s pulsation of this X-ray source in a number of archival XMM-Newton observations. The optical counterpart was identified as MACHO 207.16545.12.
The light curve is highly variable by 0.5 mag, and the power spectrum of the combined light curves revealed strong low frequency power with a peak at P=122061 days (Figure 29e). The folded lightcurve on this long-term period is shown in Figure 29g. In Figure 29b, we can see that the optical maxima and the peaks of the colour variation (MACHO - ) are not synchronized.
Using the RXTE/PCA observation, Galache et al. (2008) reported that they did not find any clear orbital period in the data for SXP202. However, they noted that the time interval between the six X-ray maxima detected since MJD 53000 is about 91 d. After detrending the optical data from MACHO and OGLE observations, we found a peak at 71.90.05 d and several peaks at its harmonics (36 d, 23 d, and 18 d) in both PDM and L-S power spectra (Figure 29c and 29d). The detrended light curve folded on this period is complex (Figure 29f).
3.27 SXP202B (XMMU J005929.0-723703)
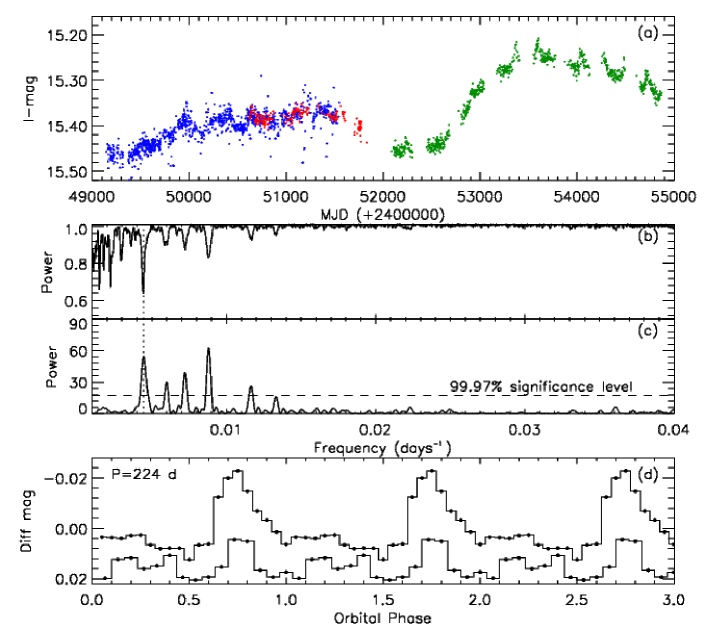
XMMU J005929.0-723703 was reported as a new X-ray pulsar with a pulse period of 202 s by Haberl, Eger, & Pietsch (2008a). They identified its optical companion with a V=14.9 Be star (also MA[93]1147), and classified it as a B0-5(III)e in the 2dF survey of the SMC.
Its light curves show large amplitude ( 0.5 mag) variations on a timescale of 3000 d (Figure 30a). The power spectra (PDM and L-S) of the detrended light curve show peaks at P = 2240.5 d and its harmonic 113 d (Figure 30b and 30c). The highest peak in the PDM is at P= 224 d, which is consistent with the time interval between consecutive outbursts in Figure 30a.
The 224 d modulation appears as a sequence of outbursts during the last five years of the OGLE III observations. Furthermore, the folded light curves on the period of 224 d shows a classic BeX outburst profile (Figure 30d), which suggests that the 224 d period is orbital. This period is in good agreement with the Corbet (1984) P(pulse)/P(orbit) relation.
The amplitude of outbursts is clearly variable (Figure 30d) and appears larger when the source is brighter, and either lower or even absent when fainter (see Section 4, Figure 43).
3.28 SXP264 (RX J0047.3-7312)
The 2641 s pulsations were discovered by Ueno et al. (2004), whose accurate XMM-Newton location allowed its optical counterpart to be identified clearly as a Be star MA[93]172. It also appears in MACHO (MACHO 212.15792.77) and OGLE catalogues of variable stars. Schmidtke & Cowley (2005b) reported an orbital period of 49.1 d in OGLE data.
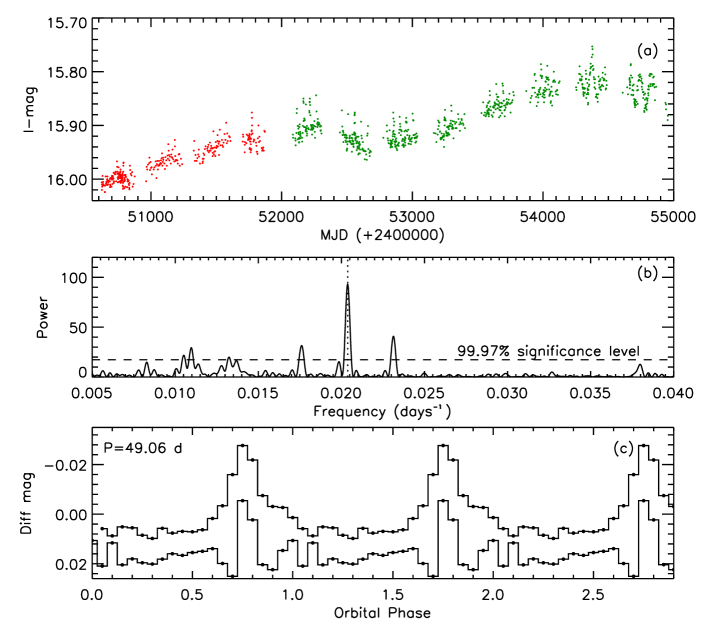
Analysis of the detrended light curve reveals a significant peak at 49.060.02 d, consistent with that previously reported (Figure 31b). The light curve folded on this period is shown in Figure 31c. The combined light curve is clearly variable on a timescale of 2000 d with an increase in brightness over the last 5000 d (Figure 31a). The amplitude of the 49 d orbital outburst increases with its brightness.
3.29 SXP280 (RX J0057.8-7202)
The optical counterpart of this 280.4 s X-ray pulsar is identified as the Be star MA[93]1036. Its long-term light curve shows a clear series of outbursts every 127.3 d (Schmidtke & Cowley, 2006). The power spectrum of the detrended light curve is dominated by a peak consistent with this at 127.50.2 d (Figure 32b).
We split the OGLE III data into two parts. Figure 32c represents these two parts of the OGLE III light curve folded on the 127.5 d period. The outburst amplitude of SXP280 also varies significantly ( 0.25 mag) on a timescale of 2000 d.

3.30 SXP293 (RX J0058.2-7231)
Corbet et al. (2004b) detected the 292.90.4 s pulsations in RXTE observations of the SMC. The optical counterpart was identified as a Be star by Schmidtke et al. (1999). Galache et al. (2008) suggested an orbital period of 151 d in their X-ray data from RXTE observation. However, both MACHO and OGLE light curves show clearly the orbital modulation with a period of P= 59.72 d, which appears as a series of very regular outbursts.
The combined light curves from MACHO and OGLE observations are shown in Figure 33a, and SXP293 shows a substantial increase in brightness until the end of the OGLE II observations. The power spectrum of the combined light curves shows a significant peak at a period of 59.770.03 d (Figure 33b), and the folded light curve on this period shows a double peaked classical BeX profile (Figure 33c). The long-term light curve is variable on a timescale of 2500 d
3.31 SXP304 (RX J0101.0-7206)
This 304.49 s X-ray pulsar was discovered in Chandra observations by Macomb et al. (2003). Its X-ray position is coincident with the emission-line star MA[93]1240. Schmidtke & Cowley (2006) suggested a possible orbital period of 52012 d in the MACHO data.
The power spectrum of the extended detrended dataset plotted in Figure 34c shows peaks at 3441.2 d (deepest peak in the PDM) and its harmonic 1700.3 d. The previously reported period 520 d appears as a peak in the PDM statistic of the combined data, but its power is lower than the 344 d period (Figure 34b).
3.32 SXP327 (XMMU J005252.1)
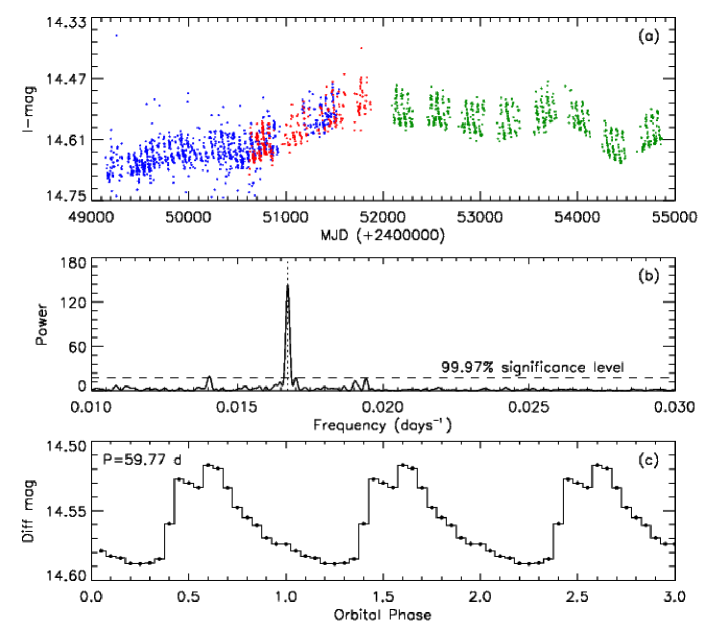
The pulsation of 327 s was discovered in the Chandra observations of the SMC by Laycock, Zezas, & Hong (2008). Its precise X-ray position allows the optical companion to be identified with object 207.16147.60 in the MACHO catalogue, and SMC101.4 25097 in the OGLE III catalogue. Udalski & Coe (2008) reported its orbital period to be 45.995 d using MACHO and OGLE III data.
The MACHO light curve shows only a gradual fading, but the OGLE III light curve appears variable on longer timescales. The power spectrum of OGLE III data reveals peaks at 1274143 d and the orbital period P= 45.90.2 d (Figure 35b and 35c). The folded light curve on the orbital period (Figure 35d) shows a classic BeX profile, with an outburst amplitude of 0.25 mag. In addition, the orbital lightcurve shows a secondary maximum, which can arise due to misalignment between the circumstellar disc and the orbital plane of the neutron star.
3.33 SXP348 (AX J0103-722)
A 345.2 s pulsation was first detected in the BeppoSAX observation of AX J0103-722 in the SMC in 1998 by Israel et al. (1998), then Yokogawa & Koyama (1998b) reported a pulse period of 348.9 s in the 1996 ASCA observation of the same source. The X-ray position from Chandra is coincident with a 14.8 mag Be star (Hughes & Smith, 1994) which is in the catalogue of Meyssonnier & Azzopardi (1993) as MA[93]1367. Schmidtke & Cowley (2006) suggested an orbital period of 93.9 d based on the OGLE II data.
The power spectrum of our detrended OGLE II light curve shows a peak at 94.40.1 d (Figure 36b), very close to that previously reported. However, its power in the L-S periodogram of the OGLE III data is very low (Figure 36c). The OGLE II data folded on the orbital period of 94.4 d is shown in Figure 36d, but we note that the modulation amplitude is low. The source has faded dramatically recently (Figure 36a). The long-term lightcurve varies on a timescale of 2000 d (Figure 36a).
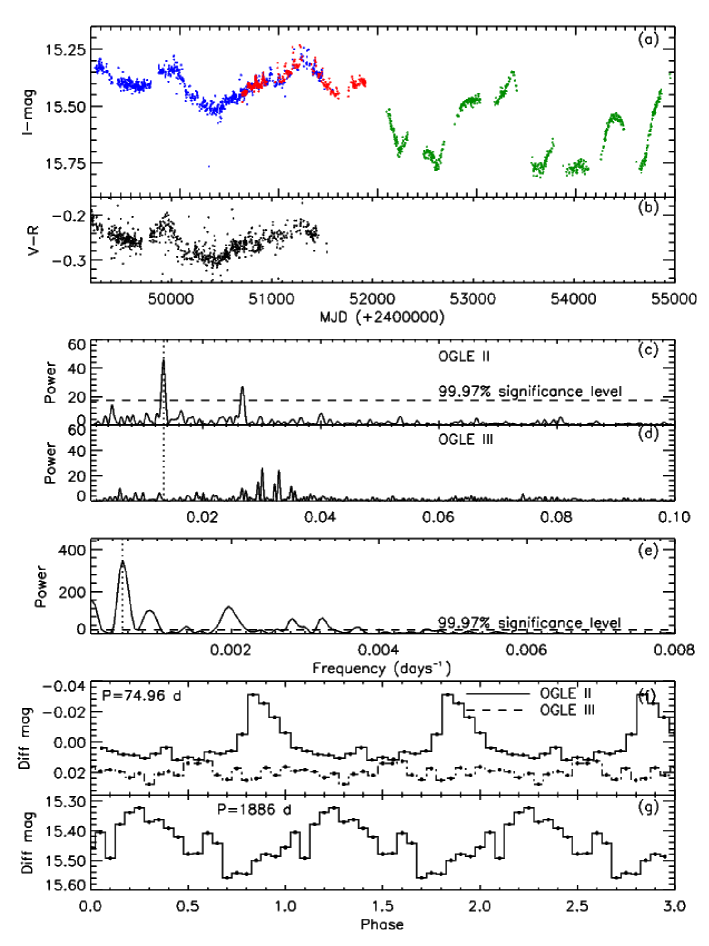
3.34 SXP455 (RX J0101.3-7211)
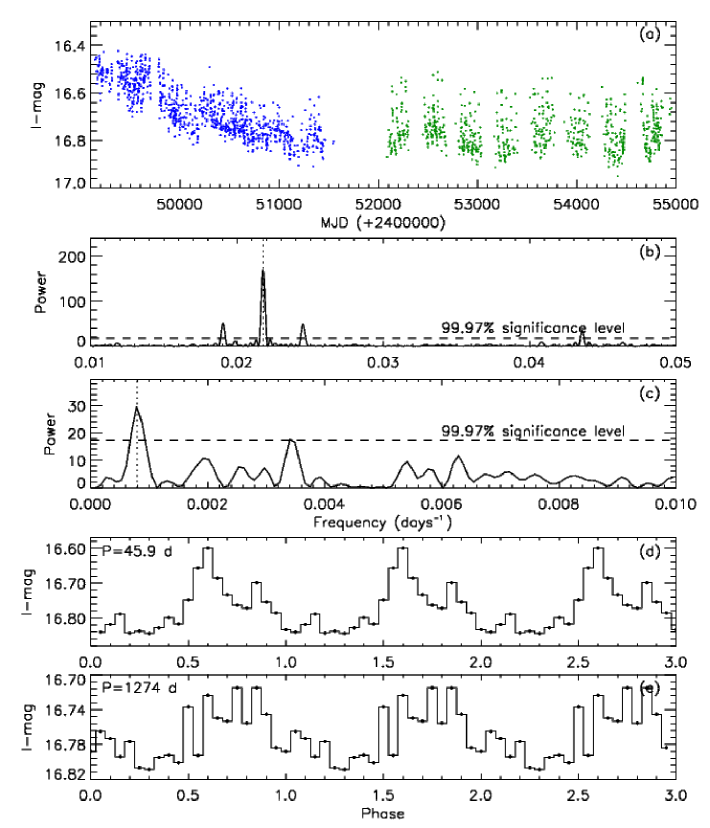
Sasaki et al. (2001) discovered the 4552 s pulsations in XMM-Newton EPIC-PN data of RX J0101.3-7211. Its optical counterpart was suggested to be MA[93]1257 (Haberl & Sasaki, 2000), and optical observations by Sasaki et al. (2001) confirmed its Be nature. An orbital period of 74.7 d was found by Schmidtke et al. (2004) and confirmed by Coe et al. (2005).
The light curve of SXP455 displays a substantial long-term variation with a period of 1886145 d (see power spectra in Figure 37e). The light curve folded on this superorbital period is shown in Figure 37g.
The power spectrum of our detrended OGLE II light curve (Figure 37c) shows a peak at the 74.960.05 d orbital period. Remarkably, this periodicity appears absent in the OGLE III light curve (Figure 37d). The OGLE II and OGLE III light curves folded on this period are shown in Figure 37f and that of OGLE II exhibits a classic BeX outburst profile with a secondary peak.
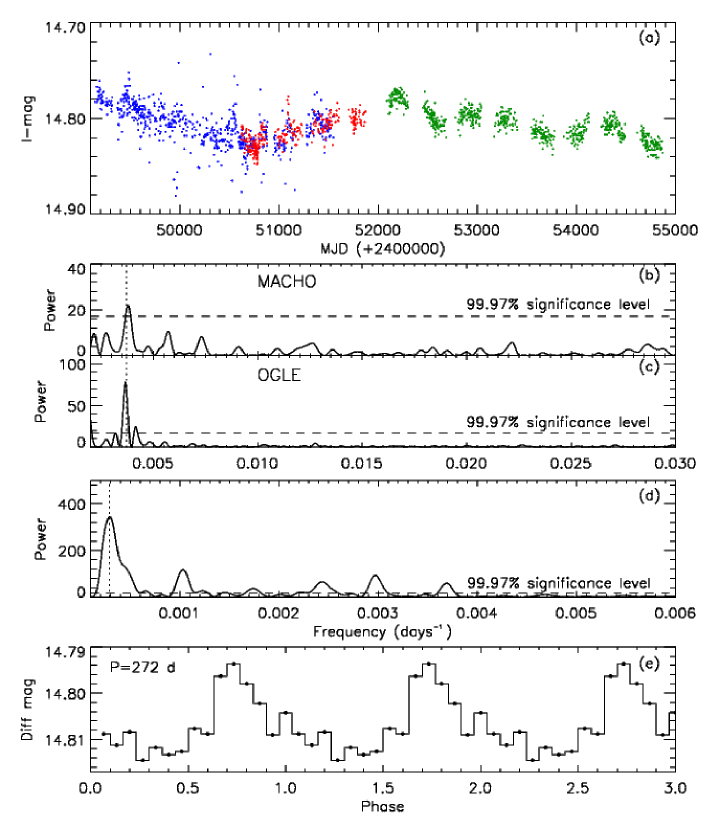
3.35 SXP504 (AX J0054.8-7244)
The pulse period of SXP504 was independently discovered in Chandra archival data by Edge, Coe, & McBride (2004) with a period of 500s and in XMM-Newton data by Haberl et al. (2004) with a period of 499.20.7 s. The precise X-ray position is coincident with an emission-line star MA[93]809 which is the same star as 207.16254.16 in the MACHO catalogue. Edge, Coe, & McBride (2004) reported a period of 268.60.1 d in the MACHO and OGLE II data, which was presumed to be orbital.
The MACHO and OGLE light curves show clearly the regular optical outbursts at 270 d intervals. After detrending the MACHO and OGLE light curves, we computed their power spectra. A peak at 2720.7 d was found in both MACHO, OGLE II and OGLE III data, which is consistent with the presumed orbital period (Figure 38b and 38c). The folded OGLE III light curve on this period is shown in Figure 38e, which has the same profile as the MACHO folded light curve reported by Edge, Coe, & McBride (2004).
The light curve exhibits a smooth long-term quasi-periodic modulation on a timescale of 3500 d. Accordingly, the L-S periodogram and PDM reveals very strong low-frequency power with a peak at 3448119 d (Figure 38d).
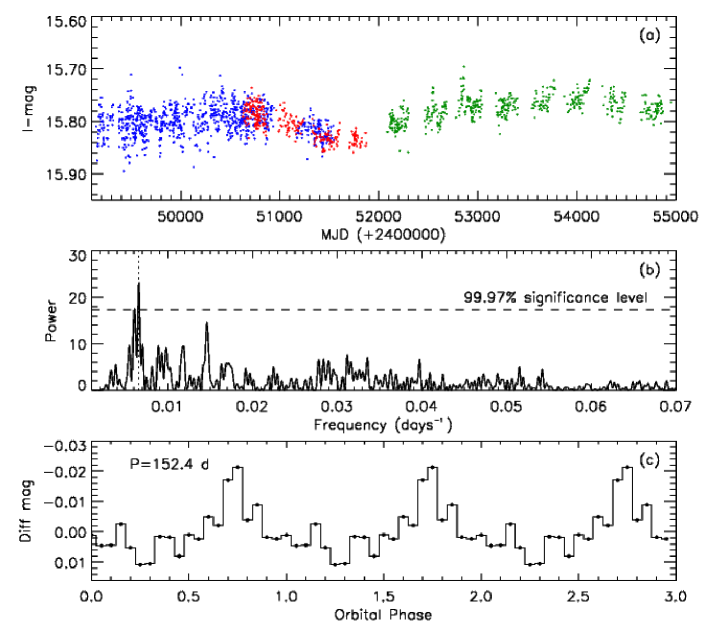
3.36 SXP565 (CXOU J005736.2-721934)
Macomb et al. (2003) discovered the 564.8 s pulsations of this source with Chandra. The optical counterpart was identified as an emission-line star, [MA93] 1020 in the Meyssonnier & Azzopardi (1993) catalogue, and a period of 95.3 d was found by Schmidtke et al. (2004). However, using RXTE/PCA observations, Galache et al. (2008) reported a period of 151.8 d.
To try to determine the real orbital period of the system, we have detrended the OGLE III data. Analysis of the detrended light curve reveals a peak at 152.4 0.2 d (Figure 39b), which appears to be caused by several BeX-type outbursts in the light curve. The folded light curve on this period (Figure 39c) shows a profile similar to those seen in other BeX sources. This suggests that the 152.4 d period is the real orbital period of SXP565 which is in good agreement with the X-ray period of 151.8 d found by Galache et al. (2008).
The combined long-term light curve (Figure 39a) shows a very clear quasi-periodic variation on a timescale of 3000 d.
3.37 SXP645 (XMMU J005535.2-722906)
This transient X-ray source was dectected with a pulse period of 645 s by Haberl, Eger, & Pietsch (2008a). They identified the optical counterpart as a V14.6 star which is object 207.16315.28 in the MACHO catalogue, and SMC-SC7 137527 in OGLE II.
The long-term light curves show very large amplitude ( 1 mag) variations repeating after 2500 d (Figure 40a), which causes a strong low-frequency peak at 285781 d in the power spectrum (Figure 40d).
At higher frequency, we found a significant peak at 135.40.5 d in the PDM and L-S power spectrum (Figure 40b and 40c), which could be the orbital period of SXP645.
3.38 SXP701 (XMMU J005517.9-723853)
Haberl et al. (2004) discovered 701.61.4 pulsations from this source during an XMM-Newton Target of Opportunity (ToO) observation of the SMC field around XTE J0055-727. This X-ray source is identified with MACHO 207.16313.35 and OGLE II SMC-SC7 129062. Schmidtke & Cowley (2005b) found a weak 412 d modulation in the MACHO data.
The power spectra (PDM and L-S) of our OGLE III light curve reveals a significant peak at 4125 d, which is the presumed orbital period (Figure 41b, 41c), very close to that found in MACHO data by Schmidtke & Cowley (2005b). The folded light curve on this period is shown in (Figure 41d).
The long-term light curves do not show periodic variability other than the presumed orbital period, but a gradual fading over 5000 d (Figure 41a) is evident.
3.39 SXP755 (RX J0049.7-7323)
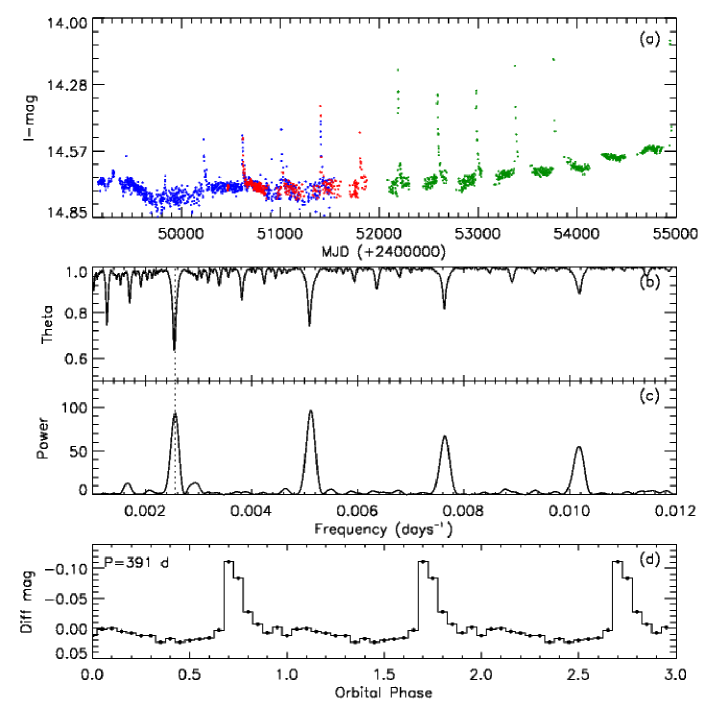
Yokogawa et al. (2000c) discovered 755.50.6 s pulsations in an ASCA observation of AX J0049.5-7323. The optical counterpart was identified as a V=15 star by Edge & Coe (2003a), and is designated [MA93] 315. The X-ray period of 3965 d was found by Laycock et al. (2005) and is consistent with the optical period of 394 d reported by Schmidtke et al. (2004).
The light curve of SXP755 shows a series of outbursts which appear to strengthen as the source brightens (Figure 42a). The power spectrum (PDM and L-S) of the detrended combined light curve shows a peak at 3912 d (Figure 42b, 42c), very close to the presumed orbital period . The folded light curve on this period is shown in Figure 42d.
The combined light curves exhibit a gradual brightening over the 5000 d observation timescale (Figure 42a).
4 Variation of outburst amplitude
In addition to the regular orbital modulation, we have also seen variations in the amplitude of this modulation throughout associated long-term cycles of variability. Similar behaviour has already been reported in BeX sources such as A0588-66 (McGowan & Charles, 2003) and SXP755 (Schmidtke et al., 2004). It has been suggested that the strength of the outbursts may depend on the density and extent of the equatorial disc at the time of periastron passage (see McGowan & Charles, 2003; Schmidtke et al., 2004).
For the sources considered here, we investigate this relationship through figure 43 which plots the orbital outburst amplitude against the source brightness (presumed related to the size of the Be circumstellar disc). When the disc is larger (hence brighter), the neutron star’s eccentric orbit leads to a more significant interaction (and hence outburst) during periastron passage. Conversely, when smaller, the disc interaction is weaker or absent completely.
Most of the SMC BeX sources exhibit an increase of outburst amplitude with brightness. The only exception is SXP7.92, which shows a decrease in strength of the outbursts when the source brightens. We suggest an explanation for this behaviour in section 5.1.


5 General discussion.
In this paper we have exploited the 16yr timebase of the MACHO and OGLE archives in order to investigate the long-term variability properties of almost all Be/X-ray pulsars currently known in the SMC. Virtually all of them show superorbital variations on timescales of hundreds to thousands of days. While such variations had been known historically for some of the bright, galactic Be systems, this is the first systematic study on these timescales of the BeX SMC population, and it is clear that such variability is extremely common, much of it appearing quasi-periodic in nature.
Optical light curves of these BeX systems show a variety of periodicities from as short as hours (likely non-radial pulsation of the Be star) to tens of days (likely orbital modulation resulting from the neutron star’s regular interaction with mass lost from the Be donor in its eccentric orbit) to many hundreds of days, which we presume to be a property of the circumstellar disc surrounding the Be donor. This latter timescale is seen as both a low and high amplitude modulation, explanations for which range from an oscillation within the disc, to its formation and depletion. We will discuss these properties in more detail.
The list of all superorbital and orbital periods found in this report as well as the previously reported X-ray and optical periods are combined in table 3.
5.1 Superorbital periods in BeX systems
Long-term non-orbital variations have previously been seen in some BeX systems, such as the 421 d quasi-periodic modulation in A0538-66 (Alcock et al., 2001). This modulation was the driving force behind the current paper, as it suggested as an observable effect of variations in size of the circumstellar disc around the Be star. Alcock et al. (2001) reported the additional remarkable property that, in A0538-66, the strength of the 16.5 d orbital outbursts depend very strongly on the brightness of the source and hence are also a function of the 421 d cycle. They occur during optical minimum, but not when the star is at its maximum brightness. For this system, the decline in brightness has been suggested to be related to the formation of an extended, cool, equatorial disc about the Be star, which will mask part of the Be star itself. A0538-66 becomes redder at minimum and bluer at optical maximum, which is what might be expected for a high inclination system. In contrast, we find here that only a few of the SMC BeX sources exhibit this type of behaviour, such as SXP25.5 (see figure 44).
However, for almost all of the SMC sources examined here, the source gets redder when it brightens (figure 44). For these systems, we interpret the red continuum as arising from the Be circumstellar disc seen at moderate or low inclination, i.e. the disc adds cooler light to that of the B star. BeX systems can exhibit this type of behaviour if the inclination of the Be equatorial disc is , where is the opening angle of the disc (and is likely very small, few degrees). Assuming that all the BeX binaries are oriented at random, the probability of a system having an inclination is simply . If we assume that the opening angle of the disc for a typical BeX source is , then the probability of a BeX having an inclination is 0.83. i.e. we would therefore expect the BeX systems to exhibit this type of behaviour rather than that of A0538-66. In our sample of 31 sources with MACHO counterparts we would then expect only 4 or 5 sources to exhibit the “A0538-type” of behaviour, and this is consistent with the number (3 sources) that become redder as they get fainter (see figure 44).
In addition, we have seen a correlation between the amplitude of outburst and brightness in some sources (such as SXP7.78, SXP293, SXP755, …). For those systems, the amplitude of outburst varies as a function of the brightness of the source, the amplitude growing with the source brightness (see figure 43). This suggests that the size of the Be equatorial disc influences the scale of the interaction between the neutron star and the Be equatorial disk.
However, if the Be equatorial disc becomes sufficiently large, then it can influence the entire orbit of the neutron star, producing a type II outburst. In this case, the Be circumstellar disk almost reaches its maximum size because it is then truncated by the neutron star. At this point the neutron star acts to increase the density of the disc rather than extend its size, hence the optical modulation is greatly reduced. This would explain the strange behaviour of SXP7.92. In Figure 44, the MACHO colour variation of SXP7.92 increases with the brightness of the source. However, its outburst amplitude becomes very weak as it brightens (Figure 43). For this system, the equatorial disc has become very large (it increases in brightness by 1 mag) and likely encompasses the entire orbit of the neutron star.
For highly variable sources (such as SXP6.85, SXP8.88, SXP15.3, SXP18.3,…), the MACHO colour variations follow the variation in brightness of the source. This confirms that the long-term variation in the light curve is related to the behaviour of the Be circumstellar disc.
5.1.1 Contribution of the extended disc.
Let us consider one of these highly variable SMC BeX sources. Assuming that SXP6.85 is viewed face-on (i0∘) and it has no disc during optical minimum, then the 0.7 mag global change in the light curve represents the brightness contribution from the Be disc. This implies a disc luminosity of , which corresponds to a total increase in brightness by 95% from the optical minimum (). However, for a very high inclination system such as A0538-66 (, McGowan & Charles, 2003), the quiescent state (no disc, only the naked B star) corresponds to the maximum optical brightness, and then when the equatorial disc grows it masks part of the Be star and reduces its optical brightness. The change in brightness in the light curve of A0538-66 is about 0.5 mag. However, the size of the equatorial disc of this source cannot be large because of its short orbital period (=16.65 d, McGowan & Charles 2003), as the disc will be truncated at a smaller radius. The change in luminosity between no disc and maximum size of disc is about , this corresponds to a decrease in the total brightness of 37% from its quiescent state.
5.1.2 Interaction with the neutron star.
It is interesting to note that, in spite of their long orbital periods, the presumed high orbital eccentricity leads to high neutron star velocities during periastron passage. Consider a typical BeX source consisting of a 1.4 compact object orbiting a 10 Be star with an eccentricity of e = 0.7 and orbital periods of = 17 d and 300 d. At periastron (separation= and ), the neutron star would have a velocity of 443 and 170 respectively. The projected equatorial rotational velocity of a Be star () can be estimated from the broadening of its spectral lines, with a mean value of about (Slettebak, 1982), which is comparable to the neutron star velocity at periastron. Therefore, at periastron, the primary star is rotating close to corotation with the orbiting neutron star.
5.1.3 One-armed oscillation in the equatorial disc.
Be stars are believed to exibit a cyclic variation in their emission line profiles (known as the ‘V/R’ variations; McLaughlin 1961). It is widely accepted that these variations are caused by global one-armed oscillations in the equatorial discs of Be stars (Kato, 1983; Okazaki, 1991). The period of this long-term V/R variation is typically in the range of 2-15 years for isolated Be stars (eg. Papaloizou, Savonije, & Henrichs, 1992). We note that these timescales are very similar to those seen in our light curves (see Table 3). This suggests that the long-term variation in Be star emission line profiles (the ‘V/R’ variation) may be related to the long-term variations we see in the optical light curves. Unfortunately, there are not yet any long-term spectrocopic studies of these SMC BeX sources capable of investigating the correlation between these two (photometric and spectrocopic) long-term variations.
The peaks and dips seen in SXP2.37 may possibly be explained as a direct effect of such a precessing elongated disk. For SXP2.37, the outbursts are seen during optical maximum, and then change into dips as the source fades. If we assume that SXP2.37 is a high inclination system, the source is brighter when the elongated disc extends to each side of the Be star, in this case the interaction between the neutron star and the disc can be seen as a maximum. On the other hand, when the elongated disc passes in front it will obscure the Be star, reducing its brightness. In this case, the neutron star passage will enlarge the disc which blocks some light from the hotter Be star, which we see as dips.
5.2 Orbital and Super-orbital period correlation
Apart from the very long-term ( hundreds of days) variations that are of primary interest here, we have also seen optical orbital modulations in the light curves of these SMC BeX systems, visible as a series of regular outbursts. These outbursts are interpreted as the periastron passage of the neutron star where it interacts with the Be equatorial disc. At periastron, the circumstellar disc can be perturbed from its stable resonant state, this perturbation will slightly increase its surface area and, hence, its optical brightness (Okazaki & Negueruela, 2001).
The optical light curves folded on the orbital period have an asymmetric profile, with a faster rise and slower decline. This behaviour has been seen in other BeX systems (Alcock et al., 2001). Furthermore, in some sources such as SXP46.6, SXP327, SXP348, etc., the optical outburst is not just a single maximum, but can show two peaks every binary cycle, which is seen in the light curves when folded on the orbital period. McGowan et al. (2007), and Coe et al. (2009) suggested this behaviour as arising from the misalignment between the spin axis of the Be equatorial disc and the orbital plane of the binary system. Therefore, the neutron star interacts twice with the Be equatorial disc every binary cycle. We note that for SXP18.3, we find an optical periodicity (P= 28.5 d) that is distinct from its presumed orbital period (P= 17.92 d), which is clearly seen only in the MACHO, OGLE II, and first year of the OGLE III light curves. The mechanism that produces this 28.5 d optical modulation is not understood but it is clearly visible in the light curve. We note that it appears especially during the optical minimum.
The observed misalignment can be caused by the supernova kick received by the system when the neutron star was born. Brandt & Podsiadlowski (1995) suggested that an asymmetric supernova explosion can give very large kicks to the newly formed neutron stars which can either disrupt the system if the kick is too strong or lead to a large eccentricity and misalignment between the old and new orbits if the velocity of the kick is smaller. Martin, Tout, & Pringle (2009) suggested that a velocity kick of 265 is consistent with the observed misalignments in BeX systems, but too high for the observed eccentricities.
In Figure 45, we have plotted the observed long-term superorbital period of the SMC BeX systems against their orbital periods. It appears that the two periods correlate. We have computed the linear Pearson correlation coefficient to be 0.73 with a p-value of 0.00039 (significant at the 99.9% confidence level). Some authors have already suggested that these long-term variations might be related to the orbital period (Reig et al., 2005; Coe et al., 2005), based on the H EW - Porb relationship of Reig, Fabregat, & Coe (1997), which is in good agreement with the disc truncation model of Okazaki & Negueruela (2001). If the Be equatorial disc is truncated by the neutron star orbit, a source with a shorter period (large number of periastron passages) would have a smaller equatorial disc than a source with a wider and more eccentric orbit.
| [d] | [mmag] | [d] | [mmag] | [d] | [d] | |
| SXP0.09 | [247] | 5 | … | 5 | … | … |
| SXP0.92 | 2654298 | 6 | … | 5 | … | 51[1] |
| SXP2.37 | … | 5 | 18.58(1)⋆⋆ | 16 | … | … |
| SXP2.76 | 2800700 | 73 | 82.37(7) | 11 | … | 82.1[2] |
| SXP3.34 | [495] | 5 | 11.09(1) | 14 | … | … |
| SXP6.85 | 6214 | 201 | 110.0(2) | 26 | 112 | 114[4] |
| SXP7.78 | 111656 | 50 | 44.9(2) | 26 | 44.9 | 44.8[5] |
| SXP7.92 | 3972 | 138 | 36.41(2) | 15 | … | 36.8[14] |
| SXP8.9 | 178632 | 485 | 28.51(1) | 8 | 28.4 | 33.4[6] |
| SXP9.13 | 188635 | 32 | 80.1(1) | 8 | 77.2 | 40.1[8] |
| SXP15.3 | 151523 | 55 | 74.51(5) | 12 | 28 | 75.1[8] |
| SXP18.3 | … | 5 | 17.95(1) | 12 | 17.7 | 17.7[15] |
| SXP22.1 | … | 5 | 75.97(6) | 9 | … | … |
| SXP25.5 | … | 5 | 22.50(1) | 16 | … | … |
| SXP31.0 | … | 5 | 90.5(1) | 14 | … | 90.4[2] |
| SXP34.1 | … | 5 | [598] | 5 | … | … |
| SXP46.6 | … | 5 | 136.4(2) | 9 | 137 | 137[9] |
| SXP59 | … | 5 | 62.10(4) | 8 | 122 | 60.2[10] |
| SXP74.7 | 122064 | 21 | 33.37(1) | 12 | 61.6 | 33.4[11] |
| SXP82.4 | … | 5 | 171(1) | 10 | 362 | … |
| SXP91.1 | … | 5 | 88.3(1) | 24 | 117 | 88.2[7] |
| SXP101 | 7586 | 14 | 21.95(1) | 12 | 25.2 | 21.9[12] |
| SXP138 | 2700304 | 172 | [143.1] | 5 | 103 | 122[6] |
| SXP140 | 4922.4 | 110 | … | 5 | … | 197[6] |
| SXP172 | … | 5 | 67.88(4) | 22 | 70 | 69.9[6] |
| SXP202A | 122061 | 100 | 71.98(5) | 18 | 91 | … |
| SXP202B | 3000 | 108 | 224(1) | 15 | … | … |
| SXP264 | 2000 | 47 | 49.06(2) | 18 | … | 49.1[10] |
| SXP280 | 2000 | 88 | 126.4(2) | 15 | 64.8 | 127[2] |
| SXP293 | … | 5 | 59.77(3) | 35 | 151 | 59.7[7] |
| SXP304 | … | 5 | [344] | 5 | … | 520[6] |
| SXP327 | 1274143 | 41 | 45.9(2) | 120 | … | 45.9[16] |
| SXP348 | … | 5 | 94.4(1) | 9 | … | 93.9[6] |
| SXP455 | 1886145 | 110 | 74.96(5) | 21 | … | 74.7[7] |
| SXP504 | 3448119 | 32 | 272(1) | 10 | 265 | 273[10] |
| SXP564 | 3000 | 69 | 152.4(2) | 15 | 151 | 95.3[7] |
| SXP645 | 285781 | 460 | [135.3] | 5 | … | … |
| SXP701 | … | 5 | 412(5) | 8 | … | 412[10] |
| SXP755 | … | 5 | 391(2) | 66 | 389 | 394[7] |
| [1]: Kaspi et al. (1993); [2]: Schmidtke & Cowley (2006); [3]: Coe et al. (2005); [4]: McGowan et al. (2008); [5]: Cowley & Schmidtke (2004); [6]: Schmidtke, Cowley, & Udalski (2006); [7]: Schmidtke et al. (2004); [8]: Edge (2005a); [9]: McGowan et al. (2008); [10]: Schmidtke & Cowley (2005b); [11]: Schmidtke & Cowley (2007b); [12]: McGowan et al. (2007); [13]: Edge et al. (2005b); [14]: Coe et al. (2009); [15]: Schurch et al. (2009); [16]: Udalski & Coe (2008) | ||||||
| Periods in square brackets are marginally significant (see section 2.3). | ||||||
| ⋆⋆ 1 uncertainty in paratheses (units of last digit). | ||||||
| ⋆Superorbital period. | ||||||
| †X-ray orbital period from Galache et al. (2008). | ||||||

6 Summary
In summary, we have studied the long-term properties of SMC Be X-ray binaries. We have found 19 superorbital periods which we suggest are related to properties of the Be circumstellar disc (see table 3). In addition, we have compiled and updated the orbital periods of these BeX sources using the complete MACHO, OGLE II, and OGLE III databases.
Furthermore, the amplitude of these outbursts vary significantly through the superorbital cycle. They are very strong either at optical maxima or at optical minima, depending on the inclination of the source. For high inclination systems, the Be circumstellar disc will mask the hotter and bluer star, and their outburst amplitudes will be strong at optical minima.
ACKNOwLEGMENTS
We are grateful to Luis Balona, Malcom Coe, Brian Warner, Matthew Schurch, Lee Townsend, Brian Van Soelen and Patricia Whitelock for useful discussions. We also thank the anonymous referee for useful suggestions, particularly in clarifying the significance or otherwise of the low amplitude modulation. AFR is supported financially by the South African SKA project.
This paper utilizes public domain data obtained by the MACHO Project, jointly funded by the US Department of Energy through the University of California, Lawrence Livermore National Laboratory under contract No. W-7405-Eng-48, by the National Science Foundation through the Center for Particle Astrophysics of the University of California under cooperative agreement AST-8809616, and by the Mount Stromlo and Siding Spring Observatory, part of the Australian National University. The OGLE project is partially supported by the Polish MNiSW grant N20303032/4275.
References
- Ables et al. (1987) Ables J. G., Jacka C. E., Hall P. J., Hamilton P. A., McConnell D., McCulloch P. M., 1987, IAUC, 4422, 1
- Alcock et al. (1996) Alcock C., et al., 1996, MNRAS, 280, L49
- Alcock et al. (2001) Alcock C., et al., 2001, MNRAS, 321, 678
- Allen (1977) Allen D., 1977, IAUC, 3143, 1
- Bell (1994) Bell J. F., 1994, PASAu, 11, 81
- Brandt & Podsiadlowski (1995) Brandt N., Podsiadlowski P., 1995, MNRAS, 274, 461
- Buckley et al. (2001) Buckley D. A. H., Coe M. J., Stevens J. B., van der Heyden K., Angelini L., White N., Giommi P., 2001, MNRAS, 320, 281
- Chakrabarty et al. (1998) Chakrabarty D., Levine A. M., Clark G. W., Takeshima T., 1998, IAUC, 7048, 1
- Charles, Southwell, & O’Donoghue (1996) Charles P. A., Southwell K. A., O’Donoghue D., 1996, IAUC, 6305, 2
- Clark, Remillard, & Woo (1996) Clark G., Remillard R., Woo J., 1996, IAUC, 6282, 1
- Coe et al. (2005) Coe M. J., Edge W. R. T., Galache J. L., McBride V. A., 2005, MNRAS, 356, 502
- Coe & Gaensicke (2003) Coe M. J., Gaensicke B. T., 2003, ATel, 123, 1
- Coe, Haigh, & Reig (2000) Coe M. J., Haigh N. J., Reig P., 2000, MNRAS, 314, 290
- Coe et al. (2009) Coe M. J., Schurch M., McBride V. A., Corbet R. H. D., Townsend L. J., Udalski A., Galache J. L., 2009, MNRAS, 394, 2191
- Coe et al. (1998) Coe M. J., Stevens J. B., Buckley D. A. H., Charles P. A., Southwell K. A., 1998, MNRAS, 293, 43
- Corbet et al. (2002) Corbet R., Markwardt C. B., Marshall F. E., Laycock S., Coe M., 2002, IAUC, 7932, 2
- Corbet et al. (1998) Corbet R., Marshall F. E., Lochner J. C., Ozaki M., Ueda Y., 1998, IAUC, 6803, 1
- Corbet (1986) Corbet R. H. D., 1986, MNRAS, 220, 1047
- Corbet (1984) Corbet R. H. D., 1984, A&A, 141, 91
- Corbet et al. (2004a) Corbet R. H. D., Coe M. J., Edge W. R. T., Laycock S., Markwardt C. B., Marshall F. E., 2004a, ATel, 277, 1
- Corbet et al. (2008) Corbet R. H. D., Coe M. J., Marshall F. E., McBride V. A., Schurch M. P. E., 2008, ATel, 1600, 1
- Corbet et al. (2004b) Corbet R. H. D., Markwardt C. B., Coe M. J., Edge W. R. T., Laycock S., Marshall F. E., 2004b, ATel, 273, 1
- Corbet et al. (2003b) Corbet R. H. D., Markwardt C. B., Coe M. J., Edge W. R. T., Laycock S., Marshall F. E., 2003b, ATel, 214, 1
- Corbet et al. (2003a) Corbet R. H. D., Markwardt C. B., Marshall F. E., Coe M. J., Edge W. R. T., Laycock S., 2003a, ATel, 163, 1
- Covino et al. (2001) Covino S., Negueruela I., Campana S., Israel G. L., Polcaro V. F., Stella L., Verrecchia F., 2001, A&A, 374, 1009
- Cowley & Schmidtke (2004) Cowley A. P., Schmidtke P. C., 2004, AJ, 128, 709
- Cowley et al. (1997) Cowley A. P., Schmidtke P. C., McGrath T. K., Ponder A. L., Fertig M. R., Hutchings J. B., Crampton D., 1997, PASP, 109, 21
- Edge & Coe (2003a) Edge W. R. T., Coe M. J., 2003a, MNRAS, 338, 428
- Edge et al. (2003b) Edge W. R. T., Coe M. J., Corbet R. H. D., Markwardt C. B., Laycock S., Marshall F. E., 2003b, ATel, 215, 1
- Edge et al. (2005b) Edge W. R. T., et al., 2005b, MNRAS, 361, 743
- Edge, Coe, & McBride (2004) Edge W. R. T., Coe M. J., McBride V. A., 2004, ATel, 217, 1
- Edge (2005a) Edge W. R. T., 2005a, PhDT,
- Eger & Haberl (2008) Eger P., Haberl F., 2008, ATel, 1453, 1
- Galache et al. (2008) Galache J. L., Corbet R. H. D., Coe M. J., Laycock S., Schurch M. P. E., Markwardt C., Marshall F. E., Lochner J., 2008, ApJS, 177, 189
- Haberl, Eger, & Pietsch (2008a) Haberl F., Eger P., Pietsch W., 2008a, A&A, 489, 327
- Haberl et al. (2008b) Haberl F., Eger P., Pietsch W., Corbet R. H. D., Sasaki M., 2008b, A&A, 485, 177
- Haberl & Pietsch (2004) Haberl F., Pietsch W., 2004, A&A, 414, 667
- Haberl, Pietsch, & Kahabka (2007) Haberl F., Pietsch W., Kahabka P., 2007, ATel, 1095, 1
- Haberl et al. (2004) Haberl F., Pietsch W., Schartel N., Rodriguez P., Corbet R. H. D., 2004, ATel, 219, 1
- Haberl & Sasaki (2000) Haberl F., Sasaki M., 2000, A&A, 359, 573
- Hughes (1994) Hughes J. P., 1994, ApJ, 427, L25
- Hughes & Smith (1994) Hughes J. P., Smith R. C., 1994, AJ, 107, 1363
- Imanishi, Yokogawa, & Koyama (1998) Imanishi K., Yokogawa J., Koyama K., 1998, IAUC, 7040, 2
- Israel et al. (1997) Israel G. L., Stella L., Angelini L., White N. E., Giommi P., Covino S., 1997, ApJ, 484, L141
- Israel et al. (1998) Israel G. L., Stella L., Campana S., Covino S., Ricci D., Oosterbroek T., 1998, IAUC, 6999, 1
- Israel et al. (1999) Israel G. L., Stella L., Covino S., Campana S., Mereghetti S., 1999, IAUC, 7101, 1
- Kaspi et al. (1993) Kaspi V. M., Johnston S., Manchester R. N., Bailes M., Bell J. F., Bessell M., Lyne A. G., D’Amico N., 1993, BAAS, 25, 1434
- Kato (1983) Kato S., 1983, PASJ, 35, 249
- Lamb et al. (2002) Lamb R. C., Macomb D. J., Prince T. A., Majid W. A., 2002, ApJ, 567, L129
- Lamb et al. (1999) Lamb R. C., Prince T. A., Macomb D. J., Finger M. H., 1999, IAUC, 7081, 4
- Laycock et al. (2003) Laycock S., Corbet R. H. D., Coe M. J., Marshall F. E., Markwardt C., Edge W., 2003, MNRAS, 339, 435
- Laycock et al. (2005) Laycock S., Corbet R. H. D., Coe M. J., Marshall F. E., Markwardt C., Lochner J., 2005, ApJS, 161, 96
- Laycock, Zezas, & Hong (2008) Laycock S., Zezas A., Hong J., 2008, arXiv, arXiv:0809.1738
- Leong et al. (1971) Leong C., Kellogg E., Gursky H., Tananbaum H., Giacconi R., 1971, ApJ, 170, L67
- Li, Jernigan, & Clark (1977) Li F., Jernigan G., Clark G., 1977, IAUC, 3125, 1
- Lomb (1976) Lomb N. R., 1976, Ap&SS, 39, 447
- Lucke et al. (1976) Lucke R., Yentis D., Friedman H., Fritz G., Shulman S., 1976, ApJ, 206, L25
- Macomb et al. (1999) Macomb D. J., Finger M. H., Harmon B. A., Lamb R. C., Prince T. A., 1999, ApJ, 518, L99
- Macomb et al. (2003) Macomb D. J., Fox D. W., Lamb R. C., Prince T. A., 2003, ApJ, 584, L79
- Majid, Lamb, & Macomb (2004) Majid W. A., Lamb R. C., Macomb D. J., 2004, ApJ, 609, 133
- Marshall et al. (1998) Marshall F. E., et al., 1998, IAUC, 6818, 1
- Marshall, Lochner, & Takeshima (1997) Marshall F. E., Lochner J. C., Takeshima T., 1997, IAUC, 6777, 2
- Martin, Tout, & Pringle (2009) Martin R. G., Tout C. A., Pringle J. E., 2009, MNRAS, 397, 1563
- McGowan & Charles (2003) McGowan K. E., Charles P. A., 2003, MNRAS, 339, 748
- McGowan et al. (2007) McGowan K. E., et al., 2007, MNRAS, 376, 759
- McGowan et al. (2008) McGowan K. E., Coe M. J., Schurch M. P. E., Corbet R. H. D., Galache J. L., Udalski A., 2008, MNRAS, 384, 821
- McLaughlin (1961) McLaughlin D. B., 1961, JRASC, 55, 73
- Meyssonnier & Azzopardi (1993) Meyssonnier N., Azzopardi M., 1993, A&AS, 102, 451
- Negueruela (1998) Negueruela I., 1998, A&A, 338, 505
- Okazaki & Negueruela (2001) Okazaki A. T., Negueruela I., 2001, A&A, 377, 161
- Okazaki (1991) Okazaki A. T., 1991, PASJ, 43, 75
- Papaloizou, Savonije, & Henrichs (1992) Papaloizou J. C., Savonije G. J., Henrichs H. F., 1992, A&A, 265, L45
- Pesch, Sanduleak, & Philip (1977) Pesch P., Sanduleak N., Philip A. G. D., 1977, IAUC, 3127, 3
- Reig, Fabregat, & Coe (1997) Reig P., Fabregat J., Coe M. J., 1997, A&A, 322, 193
- Reig et al. (2005) Reig P., Negueruela I., Fabregat J., Chato R., Coe M. J., 2005, A&A, 440, 1079
- Roberts, Lehar, & Dreher (1987) Roberts D. H., Lehar J., Dreher J. W., 1987, AJ, 93, 968
- Sasaki et al. (2001) Sasaki M., Haberl F., Keller S., Pietsch W., 2001, A&A, 369, L29
- Sasaki, Pietsch, & Haberl (2003) Sasaki M., Pietsch W., Haberl F., 2003, A&A, 403, 901
- Scargle (1982) Scargle J. D., 1982, ApJ, 263, 835
- Schmidtke & Cowley (2007a) Schmidtke P. C., Cowley A. P., 2007a, ATel, 1181, 1
- Schmidtke & Cowley (2006) Schmidtke P. C., Cowley A. P., 2006, AJ, 132, 919
- Schmidtke & Cowley (2005b) Schmidtke P. C., Cowley A. P., 2005b, AJ, 130, 2220
- Schmidtke et al. (1999) Schmidtke P. C., Cowley A. P., Crane J. D., Taylor V. A., McGrath T. K., Hutchings J. B., Crampton D., 1999, AJ, 117, 927
- Schmidtke et al. (2004) Schmidtke P. C., Cowley A. P., Levenson L., Sweet K., 2004, AJ, 127, 3388
- Schmidtke, Cowley, & Udalski (2009) Schmidtke P. C., Cowley A. P., Udalski A., 2009, ATel, 1992, 1
- Schmidtke, Cowley, & Udalski (2006) Schmidtke P. C., Cowley A. P., Udalski A., 2006, AJ, 132, 971
- Schmidtke & Cowley (2007b) Schmidtke P. C., Cowley A. P., 2007b, AAS, 38, 724
- Schmidtke & Cowley (2005a) Schmidtke P. C., Cowley A. P., 2005a, ATel, 648, 1
- Schulz (2002) Schulz, M. 2002, Computers and Geosciences, 28, 421
- Schurch, Udalski, & Coe (2008) Schurch M., Udalski A., Coe M., 2008, ATel, 1670, 1
- Schurch et al. (2009) Schurch M. P. E., et al., 2009, MNRAS, 392, 361
- Slettebak (1982) Slettebak A., 1982, ApJS, 50, 55
- Stellingwerf (1978) Stellingwerf R. F., 1978, ApJ, 224, 953
- Stevens, Coe, & Buckley (1999) Stevens J. B., Coe M. J., Buckley D. A. H., 1999, MNRAS, 309, 421
- Udalski (2008) Udalski A., 2008, AcA, 58, 187
- Udalski et al. (2008) Udalski A., Szymanski M. K., Soszynski I., Poleski R., 2008, AcA, 58, 69
- Udalski & Coe (2008) Udalski A., Coe M. J., 2008, ATel, 1458, 1
- Udalski, Kubiak, & Szymanski (1997) Udalski A., Kubiak M., Szymanski M., 1997, AcA, 47, 319
- Ueno et al. (2001) Ueno M., Yokogawa J., Imanishi K., Koyama K., Torii K., Kohmura T., 2001, ASPC, 251, 420
- Ueno et al. (2004) Ueno M., Yamaguchi H., Takagi S.-I., Yokogawa J., Koyama K., 2004, PASJ, 56, 175
- Webster et al. (1972) Webster B. L., Martin W. L., Feast M. W., Andrews P. J., 1972, Natur, 240, 183
- Yokogawa & Koyama (2000) Yokogawa J., Koyama K., 2000, IAUC, 7361, 2
- Yokogawa & Koyama (1998b) Yokogawa J., Koyama K., 1998b, IAUC, 7009, 3
- Yokogawa & Koyama (1998d) Yokogawa J., Koyama K., 1998d, IAUC, 6835, 2
- Yokogawa & Koyama (1998a) Yokogawa J., Koyama K., 1998a, IAUC, 6853, 2
- Yokogawa et al. (2000c) Yokogawa J., Imanishi K., Ueno M., Koyama K., 2000c, PASJ, 52, L73
- Yokogawa et al. (2000b) Yokogawa J., Torii K., Imanishi K., Koyama K., 2000b, PASJ, 52, L37
- Yokogawa et al. (2000a) Yokogawa J., Torii K., Kohmura T., Imanishi K., Koyama K., 2000a, PASJ, 52, L53
- Zaritsky et al. (2002) Zaritsky D., Harris J., Thompson I. B., Grebel E. K., Massey P., 2002, AJ, 123, 855
- Zebrun et al. (2001) Zebrun K., et al., 2001, AcA, 51, 317