THz-driven quantum wells: Coulomb interactions and Stark shifts in the ultrastrong coupling regime
Abstract
We investigate the near infrared interband absorption of semiconductor quantum wells driven by intense terahertz radiation in the regime of ultrastrong coupling, where the Rabi frequency is a significant fraction of the frequency of the strongly driven transition. With the driving frequency tuned just below the lowest frequency transition between valence subbands, a particularly interesting phenomenon is observed. As the THz power increases, a new peak emerges above the frequency of the undriven exciton peak which grows and eventually becomes the larger of the two. This reversal of relative peak intensity is inconsistent with the Autler-Townes effect in a three-state system while within the rotating wave approximation (RWA). In the samples investigated, the Bloch-Siegert shift (associated with abandoning the RWA), exciton binding energy, the Rabi energy, and non-resonant AC Stark effects are all of comparable magnitude. Solution of a semiconductor Bloch model with one conduction and multiple valence subbands indicates that the AC Stark effect is predominantly responsible for the observed phenomenon.
pacs:
78.67.De, 42.50.Hz, 71.35.-y, 78.40.Fy1 Introduction
Strong interactions between light and matter are historically and currently of great interest in condensed matter, atomic and molecular physics as well as in quantum information science. In the strong coupling regime, effects of the light-matter interaction are manifested as coherent Rabi oscillations between a pair of quantum states [1, 2], vacuum Rabi splitting of two-state quantum systems in a cavity [3, 4, 5], and the Autler-Townes effect in three-state quantum systems [6, 7, 8, 9, 10, 11, 12, 13, 14]. As many of these systems have proposed uses in the coherent control of states and in quantum information processing [15], further studies of light-matter coupling pave the way for future technologies. Recently, cavity-coupled semiconductor [16, 17] and superconductor [18] systems have achieved the ultrastrong coupling regime where the photon exchange between the atom and optical field occurs at a rate (given by the Rabi frequency, ) comparable to the frequency of the photon. Though ultrastrong coupling has been difficult to achieve in the past, recent experiments open the door to investigate effects such as the Bloch-Siegert shift [19, 20, 21, 22] and carrier-wave Rabi flopping [23, 24] which are expected to become observable in this regime. With an intense THz field incident upon a semiconductor quantum well, we are able to vary the light-matter coupling strength and investigate the ultrastrong coupling limit without a cavity.
With intense electromagnetic (EM) fields tuned resonantly to a two-level quantum transition, Autler and Townes found that absorption of a weak probe between one of the strongly driven levels and a third state split into two symmetric peaks. The separation between the peaks can act as a direct measure of the strength of the coupling between the atom and the field and has a magnitude of the Rabi energy, , where is the dipole moment between the strongly driven states and is the amplitude of the EM field. Autler-Townes splitting has been studied in atomic and molecular systems for decades [6, 7], but has only been observed in low-dimensional semiconductors [8, 9, 10, 11, 25, 26, 12] and in superconducting quantum systems [13, 14] in the last ten years. In semiconductors, effects such as Coulomb interactions between electrons and holes enrich light-matter interactions [27] with many-body effects.
Semiconductor heterostructures are particularly attractive for investigating intense light-matter interactions since - unlike atoms - the quantum energy levels and effective masses can be engineered at the growth stage, while the dimensionality of the system can be uniquely controlled by quantum confinement. The Autler-Townes effect in semiconductors has been investigated in both quantum well [10, 11] and quantum dot systems [8, 9, 28]. At near infrared frequencies, narrow excitonic linewidths in quantum dots led to the observation of small values of Rabi splitting () at low powers () [9]. More intense sources () were required for observation of the Autler-Townes effect in quantum wells (QWs). With these intense fields (), Rabi energies of a few meV were seen in both intersubband absorption spectra of doped QWs driven at mid infrared (IR) frequencies [11] and in the interband absorption of undoped QWs driven at THz frequencies [10, 12]. Rabi energies which are a significant fraction of the transition energy were observed by Carter et al[10] and indicate that THz-driven quantum wells are a well-controlled system in which to study ultrastrong light-matter coupling.
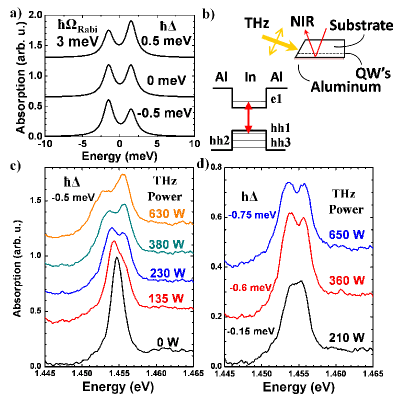
The Autler-Townes effect in a three-level system can be solved analytically within the commonly-used rotating wave approximation (RWA) [29]. In this model, the splitting in the absorption spectrum is symmetric when the driving frequency is resonant with the transition frequency (figure 1(a)). With a non-resonant driving frequency, the symmetry of the absorption spectrum is broken and the relative peak amplitudes are determined by the detuning, . For the level probed in the following experiments, a positive (negative) detuning results in a larger (smaller) peak at higher energy. In the RWA model, is independent of the strength of the driving field.
The RWA breaks down in the limit of ultrastrong coupling. The effect of abandoning the RWA in a two-level system was first investigated by Bloch and Siegert [19]. With increasing resonant EM field amplitude, they found a blue shift of the effective transition frequency, . This effect will become observable in the ultrastrong coupling regime, when is a significant fraction of . In the three-level system under investigation, as the EM field amplitude is increased the effective transition energy will increase and the system will become negatively detuned. As the magnitude of the negative detuning increases, the amplitude of the higher energy Autler-Townes peak will as a result of the Bloch-Siegert blue-shift [30].
In this work a systematic investigation of Autler-Townes splitting for several quantum well systems is described. Though the system is in the ultrastrong coupling regime () where the Bloch-Siegert effect is non-negligible, it is observed experimentally that the amplitude of the peak at higher energy with increasing terahertz intensity, indicating a red shift of . At first sight this is a complete surprise. By solving a full four-subband semiconductor Bloch model outside the RWA, theoretical results that are in good agreement with experiments on two different QWs are achieved. These calculations show that effects due to non-RWA terms in the Hamiltonian and effects due to higher lying levels both persist in these samples. An AC Stark shift is predominantly responsible for the observed phenomena.
2 InGaAs quantum well absorption
2.1 Experimental observations
The experimental design was similar to that of Carter et al[10], where a strong THz field polarized in the growth direction of the undoped InGaAs/AlGaAs QWs dramatically modified the NIR interband absorption spectrum via the Autler-Townes effect. Employing thicker QWs with lower transition energies than in previous experiments allowed investigation further into a regime where the RWA breaks down. The two samples investigated in these experiments were grown by molecular beam epitaxy with 10 repetitions of In0.06Ga0.94As quantum wells of 18 and 22 nm widths, respectively, separated by 30 nm Al0.3Ga0.7As barriers. The samples were then capped by 50 nm of GaAs. Strain in the samples shifted the valence band energies and isolated the lowest heavy hole states from the light holes. Compared to the heavy holes, the electrons have a low effective mass, leading to much a larger energy separation in the conduction band than in the valence band. Thus the system could be modeled as a single electron level interacting with a few heavy hole levels (figure 1(b)). The facet was polished at 10 degrees and a thick Aluminum layer was deposited to optimize the coupling of the THz E-field to the QWs. The Aluminum layer also allowed the sample to be studied in double pass geometry by providing a reflective layer for the NIR probe. The THz radiation was generated by the UCSB Far-Infrared Free-Electron Laser (FEL) [31], a narrowband (<1 GHz) source capable of producing pulses with kilowatt power and few- duration at the frequencies of interest in these experiments, 1.1 THz to 2.5 THz. A small percentage of the beam was sent to a pyroelectric detector to monitor the THz power while the power at the sample was controlled by a pair of wire grid polarizers. The diameter of the focused THz beam was , providing a THz intensity of in the sample.
In the absence of a THz driving field, the single strong NIR absorption line was assigned to the exciton X1 consisting of an electron from the lowest conduction subband (e1) and a hole from the highest valence subband (hh1). The X2 (e1-hh2) exciton was not observed because initial and final states have the same parity. The X3 (e1-hh3) exciton was not observed because of small transition matrix elements. The observed plateau towards higher energy arises from the continuum absorption. Experiments showed that the most interesting behavior was observed when the driving frequency was tuned slightly below the resonant frequency of the exciton transition [32] (figure 1(c)). At low intensities, the peak at higher energy was smaller, the expected behavior for negative detuning (figure 1(a), lower trace). As the THz intensity was increased, the amplitude of the higher energy peak increased. At THz powers above 380 W, the peak at higher energy was the larger peak, the expected behavior for positive detuning (figure 1(a), top trace). The intensity dependent change of the relative peak amplitudes was interpreted as a red shift of the effective exciton transition frequency . Experiments were performed on this sample at a number of THz frequencies below resonance (figure 1(d)) and it was found that larger initial values of negative detuning required more intense THz fields to create a symmetric splitting, further verification that strong THz fields produced a red shift of .
2.2 Theoretical description
To compute the THz-driven spectra, a numerical solution of the semiconductor Bloch equations was performed in the presence of both a weak optical probe field and a strong THz driving field. The approach was similar to that of Liu and Ning [33], who included a total of three subbands in their calculation and made the RWA. Previous theoretical studies of THz-driven quantum wells have been performed without making the RWA, but have not focused on the Bloch-Siegert effect [34, 35]. Calculations presented here included a single conduction subband, either two or three valence subbands, and the continuum states of a symmetric quantum well. An efficient numerical solution of the semiconductor Bloch equations was carried out in real space [36] without application of the RWA to the THz fields. Using an infinite QW model, energy levels were calculated and exciton effects were introduced by a self consistent determination of the binding energies and Coulomb matrix elements. Calculations neglected band mixing and took parameters typical of an InGaAs/AlGaAs system (Appendix D). All simulations used an exciton dephasing rate for the off-diagonal transitions that resulted in a homogeneous broadening rate (FWHM) . Simulations shown in figure 3 also include an inhomogeneous broadening (Appendix A).
Self-consistent determination of the exciton binding energies revealed that X1 has a greater binding energy than X2. This resulted in the inter-exciton transition energy being larger than the bare intersubband transition energy , an effect also predicted by Liu and Ning [33]. Thus the 22 nm quantum well, with a calculated hh2-hh1 intersubband transition energy of , has an exciton transition energy of . This significant difference in the energy spectra exemplifies the deviation of the excitonic system from the intersubband system and implies that Coulomb effects are important in observed and calculated spectra.
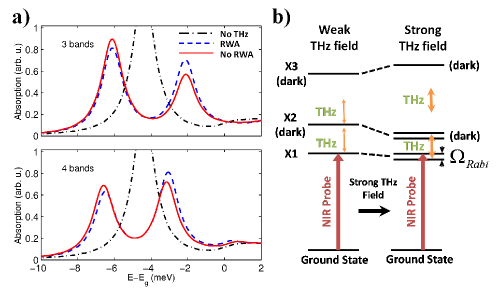
Simulations of a 22 nm quantum well with tuned below are shown in figure 2(a). Three-subband simulations of the Autler-Townes splitting with (blue dashed) and without (red solid) the RWA are shown (figure 2(a), top graph); the chain curve shows the absorption in the zero THz limit. Though both simulations exhibit a negative detuning, the difference between the heights of the two peaks is larger in the non-RWA spectrum, showing that it is further from resonance than the RWA spectrum. This difference between the effective detuning of the two spectra is evidence of a Bloch-Siegert effect which blue shifts in the non-RWA model. By itself, this is an interesting result: the Bloch-Siegert effect, calculated for a simple three-state system, persists in the 3-subband SBE model with Coulomb interactions. However, the persisting negative detuning of the system at this intense value of the Rabi energy, even without the RWA, shows the absence of a red shift and demonstrates that the three-subband model is not consistent with our experimental findings.
Finally, the third valence subband (hh3) was introduced which allowed coupling between excitons X2 and X3. Consistent with the infinite well approximation, the subband hh3 was separated from hh2 in energy by 9.5 meV (), more than 4 meV off resonance from the driving frequency. As is seen in the three subband model, simulations (figure 2(a), bottom graph) indicate a Bloch-Siegert shift of the non-RWA spectra. With an intense THz field applied at a frequency which is that of the exciton transition , the relative amplitudes of the two Autler-Townes peaks indicate that the system is being driven resonance. This behavior is consistent with our experimental observations and implies that the strong THz field induces a redshift of the effective transition energy . This red shift is interpreted as a Stark-like shift to the off resonant X3-X2 transition which overcame the expected Bloch-Siegert effect, diagrammed by an energy level schematic in figure 2(b). In summary, the combination of non-RWA effects and a fourth subband in the SBE model predicted a red shift of which was in good agreement with the experimental data.
2.3 Results
Experimental results from 18 and 22 nm wide QWs, both driven slightly below resonance, are shown in figure 3(a) and figure 3(c), respectively. When the 18 nm QW was driven with the THz frequency negatively detuned 0.4 meV below , a symmetric splitting was achieved at 650W. A Rabi energy was estimated by a fit of two Lorentzians to the absorption spectrum (Appendix B). Calculations of the 18 nm QW (figure 3(b)) with a symmetric splitting , a value within the experimental error of the experimentally observed value, show strong agreement with the experiment. For simulations at lower powers, the Rabi energy used in the simulations was scaled to the square root of the experimentally measured power levels (Appendix B). The resulting absorption curves reproduce the behavior observed in experiment quite well, namely, the increasing amplitude of the high-energy peak with increasing THz intensity.
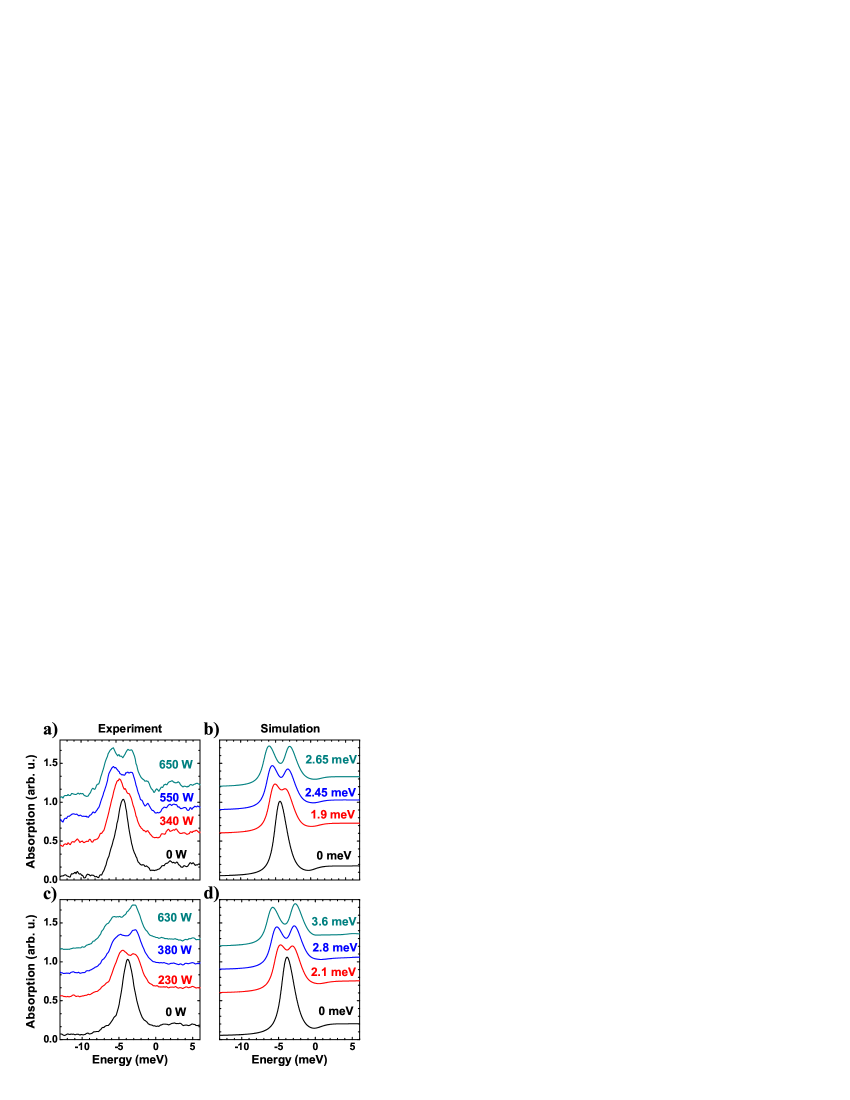
Calculations of the 22 nm QWs driven 0.5 meV below clearly show the reversal of relative peak intensities with increasing Rabi energy that is observed in the experiments (figure 3(d)). The splitting at 630 W was fit to two Lorentzians and found to be meV, so the 3.6 meV simulations are at more intense fields than in the experiment but still demonstrates the behavior observed in experiments. The amplitude of the higher energy peak is larger in the experimental data than in the simulations, so the calculated red-shift of was not as large the experimental shift. However, the reversal of peak intensities, evidence of a redshift of the resonance, is still clearly replicated at high fields. Further simulations expanding our model to four valence subbands were performed, but these had qualitatively similar results to the three subband model. Heating has been thoroughly investigated in this and previous experiments and is not responsible for the behavior observed in this experiment (Appendix C). The overall success of our final model showed that the THz-driven QW system is modified by competing effects and a proper description must include a conduction subband, at least three valence subbands and must not invoke the RWA.
3 Conclusion
We have studied two QW samples in the limit of ultrastrong coupling. In the widest QWs investigated, the Rabi energy approached half of the energy of the strongly driven transition . Though a blue-shift of the transition is expected due to non-RWA effects, what is observed is a red-shift which exceeds 12% of the transition energy. Theoretical investigations reveal the interplay between the Bloch Siegert shift and the AC Stark effect and indicate that the Stark shift is the dominant effect in these samples. This interplay can be further investigated with semiconductor QWs grown in different geometries. When the energy of the second lowest transition , as is the case in square quantum wells like the ones investigated, the AC Stark shift is expected to be dominant. If the energy , as is the case for tunnel-coupled double QWs, we expect the Stark shift would be negligible and only the Bloch-Siegert shift would be observed. Similarly, if , as in triangle QWs, the AC Stark shifts is a blue shift and the Stark effect is in the same direction as the Bloch-Siegert effect. Our results, coupled with the adaptability of the terahertz-driven quantum well system, implies that this is an ideal system to investigate ultrastrong coupling on a quantitative level and to controllably explore the regime outside the three-level model and beyond the RWA.
Appendices
Appendix A. Broadening
The true linewidth seen in experiments is caused by both homogeneous and inhomogeneous broadening, so the linewidth alone cannot be used to estimate the exciton dephasing rate, the source of homogeneous broadening. However, increasing the exciton dephasing rate broadens the exciton line and reduces the maximum amplitude of the exciton absorption while having little effect on the continuum absorption. Therefore, to obtain an estimate of the dephasing rate, the rate is adjusted until the relative strengths of the continuum and exciton absorptions in the simulations fit that of the experimental data when no THz field applied. This led to an exciton dephasing rate for the off-diagonal transitions that resulted in a homogeneous broadening (FWHM) . Terahertz induced broadening arose directly from the SBE simulations where was held constant for all values of the Rabi energy. In addition, it was found that small changes to the homogeneous broadening have little effect on our predictions.
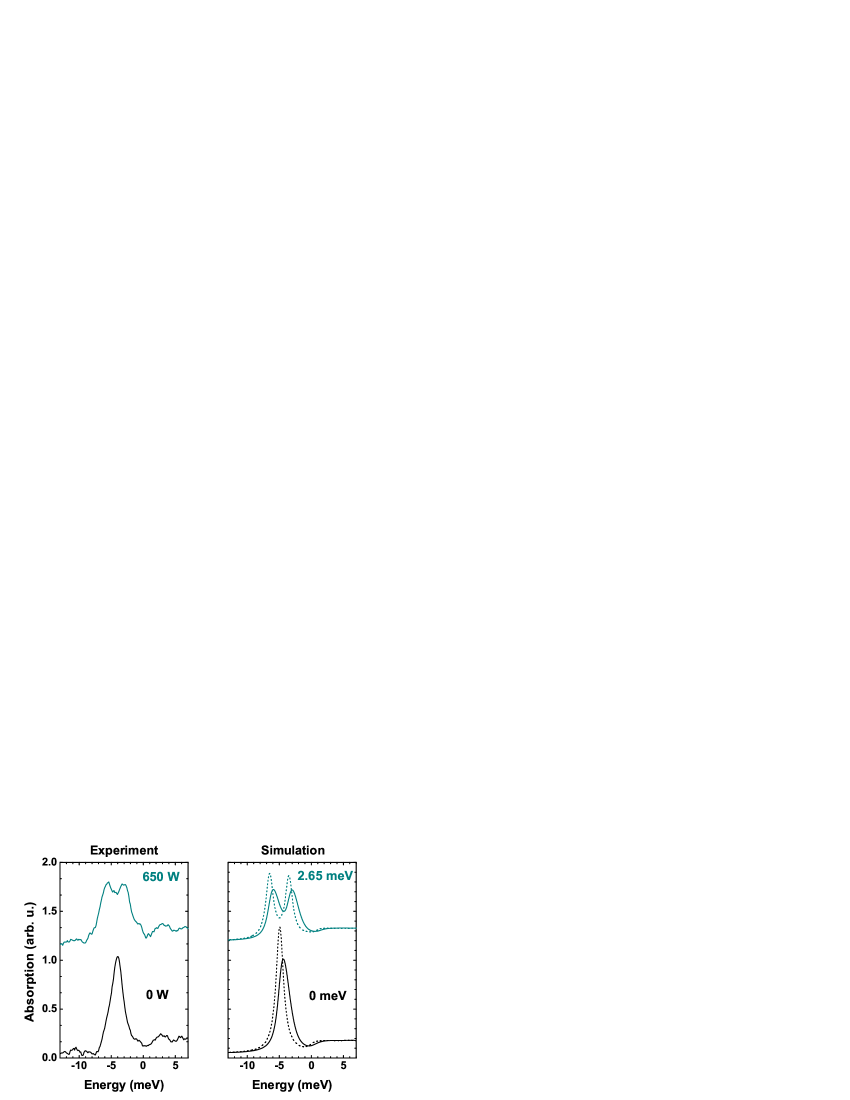
Inhomogeneous broadening was qualitatively included by convolving the SBE solution with a Gaussian function, an effect that produced spectra more representative of the experimental results. Due to the continuum absorption at higher energy than the exciton peak, convolving the simulated spectra with a Gaussian function shifts the exciton peak towards higher energies. Simulations for both QWs are shown with (solid lines) and without (dashed lines) an inhomogeneous broadening (figure 4).
Appendix B. Dipole moments, electric field and Rabi energy
The dipole moments used in the SBE simulations are calculated directly from an infinite potential well model. For an intersubband transition the dipole moment is given by , where is the electric charge and is the matrix element of the position operator in the growth direction. For the 22 nm QW, the dipole moments of the two lowest transitions are nm and nm. The 18 nm QW has nm and nm. These dipole moments are very useful in verifying that the electric fields being used in the SBE calculations are consistent with what we believe we are applying experimentally.
It is very difficult to get an accurate estimate of the electric field at the sample using the power in the THz beam due to the complicated geometry where the beam strikes the sample facet. However, assuming the dipole moment is constant, as is done in the simulations, the Rabi energy is directly proportional to the electric field. We also stated that the magnitude of the splitting, when the driving beam is resonant, is given by the Rabi energy. Because we have the ability to measure the splitting quite accurately by fitting two Lorentzian peaks to the experimental data, we can obtain an accurate measure of the electric field from the splitting.
From the Lorentzian fits, we measure the maximum Rabi splitting in the 18 nm QW to be 2.7 meV. Using this Rabi energy and the dipole moment calculated above, we estimate the electric field at the QW to be kV/cm. Calculations of the electric field based on the power and the diameter of the focused THz beam estimate the field strength to be between 4 and 5 kV/cm, a figure that is in good agreement with the value estimated from the Rabi splitting. For calculations of the electric field in the sample, values used are: the power in the sample , beam diameter , index of refraction , spot area , and field strength . This implies that it is reasonable to use the Rabi splitting to estimate the Rabi energy, and to use these values in the simulations when calculating the corresponding spectra.
To obtain the Rabi energies which will be used in the simulations at low THz intensities, we first fit to the splitting of the highest THz intensity spectra to obtain the Rabi energy at this intensity. Because the Rabi energy is proportional to the electric field, we scaled the Rabi energies at lower powers by the square root of the applied THz power. The method of scaling the Rabi energy by the square root of the THz power is superior to fitting at every THz power because it eliminates unnecessary fitting parameters and errors involved with fitting peaks which are not fully separated.
Appendix C. Heating
Our observations cannot be the result of either lattice or carrier heating. Though interband transitions are dependent on the energy of the band gap and therefore are highly susceptible to temperature changes, intersubband levels in the quantum well are determined by the width of the well and the effective mass of the particle, neither of which are strongly temperature dependent [37]. Hence, any change in the temperature of the system should first be observed as a shift of the exciton absorption line. This is shown in temperature dependent measurements of the Autler-Townes effect performed by Sam Carter (figure 3.19, page 80 of [38]), where the Autler-Townes peaks at 40K have the same relative amplitudes as the peaks at 10K, but the main exciton line has been shifted by 2 meV. In the experiments presented we observe no discernable shift of the exciton, only a large red-shift of the excitonic energy. We measure absorption with a very weak LED () and are therefore insensitive to heating of the extremely small carrier population. The negligible effects of heating are also consistent with previous experiments performed by Černe [39] and Carter [10].
Appendix D. Materials parameters
The following parameters were used in simulations of the InGaAs/AlGaAs system described in this letter: a dielectric constant , an electron effective mass , and a hole effective mass for all heavy holes.
References
References
- [1] Rabi I I 1937 Phys. Rev. 51 652
- [2] Cundiff S T, Knorr A, Feldmann J, Koch S W, Göbel E O and Nickel H 1994 Phys. Rev. Lett. 73 1178
- [3] Reithmaier J P, Sek G, Loffler A, Hofmann C, Kuhn S, Reitzenstein S, Keldysh L V, Kulakovskii V D, Reinecke T L and Forchel A 2004 Nature 432 197–200
- [4] Yoshie T, Scherer A, Hendrickson J, Khitrova G, Gibbs H M, Rupper G, Ell C, Shchekin O B and Deppe D G 2004 Nature 432 200–3
- [5] Thompson R J, Rempe G and Kimble H J 1992 Phys. Rev. Lett. 68 1132–5
- [6] Autler S H and Townes C H 1955 Phys. Rev. 100 703–22
- [7] Dion D R and Hirschfelder J O 1976 Advances in Chemical Physics vol 35 ed Prigogine I and Rice S A (New York: Wiley Interscience) pp 265–350
- [8] Kamada H, Gotoh H, Temmyo J, Takagahara T and Ando H 2001 Phys. Rev. Lett. 87 246401
- [9] Xu X, Sun B, Berman P R, Steel D G, Bracker A S, Gammon D and Sham L J 2007 Science 317 929–32
- [10] Carter S G, Birkedal V, Wang C S, Coldren L A, Maslov A V, Citrin D S and Sherwin M S 2005 Science 310 651–3
- [11] Dynes J F, Frogley M D, Beck M, Faist J and Phillips C C 2005 Phys. Rev. Lett. 94 157403
- [12] Wagner M, Schneider H, Stehr D, Winnerl S, Andrews A M, Schartner S, Strasser G and Helm M 2010 Phys. Rev. Lett. 105 167401
- [13] Baur M, Filipp S, Bianchetti R, Fink J M, Goppl M, Steffen L, Leek P J, Blais A and Wallraff A 2009 Phys. Rev. Lett. 102 243602
- [14] Sillanpaa M A, Li J, Cicak K, Altomare F, Park J I, Simmonds R W, Paraoanu G S and Hakonen P J 2009 Phys. Rev. Lett. 103 193601
- [15] Mabuchi H and Doherty A C 2002 Science 298 1372–7
- [16] Guenter G, Anappara A A, Hees J, Sell A, Biasiol G, Sorba L, De Liberato S, Ciuti C, Tredicucci A, Leitenstorfer A and Huber R 2009 Nature 458 178–81
- [17] Todorov Y, Andrews A M, Colombelli R, De Liberato S, Ciuti C, Klang P, Strasser G and Sirtori C 2010 Phys. Rev. Lett. 105 196402
- [18] Niemczyk T, Deppe F, Huebl H, Menzel E P, Hocke F, Schwarz M J, Garcia-Ripoll J J, Zueco D, Huemmer T, Solano E, Marx A and Gross R 2010 Nat. Phys. 6 772–6
- [19] Bloch F and Siegert A 1940 Phys. Rev. 57 522
- [20] Arimondo E and Moruzzi G 1973 J. Phys. B: At. Mol. Opt. Phys. 6 2382–9
- [21] Tuorila J, Silveri M, Sillanpää M, Thuneberg E, Makhlin Y and Hakonen P 2010 Phys. Rev. Lett. 105 257003
- [22] Forn-Díaz P, Lisenfeld J, Marcos D, García-Ripoll J J, Solano E, Harmans C J P M and Mooij J E 2010 Phys. Rev. Lett. 105 237001
- [23] Hughes S 1998 Phys. Rev. Lett. 81 3363–6
- [24] Mücke O D, Tritschler T, Wegener M, Morgner U and Kärtner F X 2001 Phys. Rev. Lett. 87 057401
- [25] Danielson J R, Lee Y S, Prineas J P, Steiner J T, Kira M and Koch S W 2007 Phys. Rev. Lett. 99 237401
- [26] Jameson A D, Tomaino J L, Lee Y S, Prineas J P, Steiner J T, Kira M and Koch S W 2009 Appl. Phys. Lett. 95 201107
- [27] Kira M and Koch S 2006 Prog. Quant. Electron. 30 155–296
- [28] Boyle S J, Ramsay A J, Fox A M, Skolnick M S, Heberle A P and Hopkinson M 2009 Phys. Rev. Lett. 102 207401
- [29] Rabi I I, Ramsey N F and Schwinger J 1954 Rev. Mod. Phys. 26 167
- [30] Zhang L S, Feng X M, Li X W, Han L and Fu G S 2004 Chinese Phys. 13 348–52
- [31] Ramian G 1992 Nucl. Instrum. Methods Phys. Res., Sect. A 318 225–9
- [32] Sherwin M, Carter S and Cerne J 2007 Terahertz Spectroscopy Optical Science and Engineering ed Dexheimer S L (Boca Raton: CRC Press) pp 205–68
- [33] Liu A S and Ning C Z 2000 J. Opt. Soc. Am.B 17 433–9
- [34] Maslov A V and Citrin D S 2000 Phys. Rev.B 62 16686–91
- [35] Maslov A and Citrin D 2002 IEEE J. Sel. Top. Quant. 8 457–63
- [36] Hughes S 2004 Phys. Rev.B 69 205308
- [37] Cardona M 1961 Phys. Rev. 121 752–8
- [38] Carter S 2004 Terahertz electro-optic effects in (In)GaAs quantum wells Ph.D. thesis University of California - Santa Barbara
- [39] Černe J, Markelz A G, Sherwin M S, Allen S J, Sundaram M, Gossard A C, van Son P C and Bimberg D 1995 Phys. Rev.B 51 5253–62