First stars XIV. Sulfur abundances in extremely metal-poor stars ††thanks: Based on observations obtained with the ESO Very Large Telescope at Paranal Observatory, Chile (Large Programme ”First Stars”, ID 165,N-0276, P.I.: R. Cayrel.
Abstract
Context. Precise S abundances are important in the study of the early chemical evolution of the Galaxy. In particular the site of the formation remains uncertain because, at low metallicity, the trend of this -element versus [Fe/H] remains unclear. Moreover, although sulfur is not bound significantly in dust grains in the ISM, it seems to behave differently in DLAs and old metal-poor stars.
Aims. We attempt a precise measurement of the S abundance in a sample of extremely metal-poor stars observed with the ESO VLT equipped with UVES, taking into account NLTE and 3D effects.
Methods. The NLTE profiles of the lines of multiplet 1 of S I were computed with a version of the program MULTI, including opacity sources from ATLAS9 and based on a new model atom for S. These profiles were fitted to the observed spectra.
Results. We find that sulfur in EMP stars behaves like the other -elements, with [S/Fe] remaining approximately constant below [Fe/H]=–3. However, [S/Mg] seems to decrease slightly with increasing [Mg/H]. The overall abundance patterns of O, Na, Mg, Al, S, and K are most closely matched by the SN model yields by Heger & Woosley. The [S/Zn] ratio in EMP stars is solar, as also found in DLAs. We derive an upper limit to the sulfur abundance [S/Fe] for the ultra metal-poor star CS 22949-037. This, along with a previously reported measurement of zinc, argues against the conjecture that the light-element abundance pattern of this star (and by analogy, the hyper iron-poor stars HE 0107-5240 and HE 1327-2326) would be due to dust depletion.
Key Words.:
Galaxy: abundances – Galaxy: halo – Galaxy: evolution – Stars: abundances – Stars: Supernovae1 Introduction
The determination of the abundance of sulfur in the atmosphere of old Galactic stars is of interest for two primary reasons:
-First, since unlike most other heavy elements, sulfur is generally considered not to be significantly bound in interstellar dust grains, it is a good indicator of the chemical composition of the ISM and thus allows a direct comparison between the abundances in the DLAs (damped Ly clouds) and early Galactic matter.
-Secondly, the formation of sulfur remains controversial. Sulfur is generally considered as an -capture element such as magnesium and calcium, formed preferentially in massive type II supernovae, including those of the first generations of stars. In analogy with other -elements, [S/Fe] is expected to be constant and positive at low metallicity (see e.g. François, Fra87 (1987), Fra88 (1988)). However, the trend of [S/Fe] versus [Fe/H] in the early Galaxy is still debated: Israelian & Rebolo (IR01 (2001)) and Takada-Hidai et al. (TTS02 (2002)) found [S/Fe] to rise with decreasing [Fe/H], while Ryde & Lambert (RL04 (2004)) and Nissen et al. (NCA04 (2004), NAA07 (2007)) found [S/Fe] to remain flat. Finally, Caffau et al. (CBF05 (2005), 2010a ), combining their own data with a large sample from the literature covering the multiplets 1, 3, 6, and 8 of S I(see Table 1), suggest a bimodal distribution of [S/Fe] for to explain the high value of [S/Fe] found in several metal-poor stars.
| Mult. | wavelength | Transition | log | |
| (nm) air | (eV) | |||
| 1 | 921.2863 | 4s-4p | 0.42 | 6.525 |
| 1 | 922.8093 | 0.26 | 6.525 | |
| 1 | 923.7538 | 0.04 | 6.525 | |
| 3 | 1045.5449 | 0.26 | 6.860 | |
| 3 | 1045.6757 | -0.43 | 6.860 | |
| 3 | 1045.9406 | 0.04 | 6.860 | |
| 6 | 869.3931 | 4p-4d | -0.51 | 7.870 |
| 6 | 869.4626 | 0.08 | 7.870 | |
| 8 | 675.6851 | 4p-5d | -1.76 | 7.870 |
| 8 | 675.7007 | -0.90 | 7.870 | |
| 8 | 675.7171 | -0.31 | 7.870 | |
| 1F | 1082.1176 | -8.62 | 0.000 |
A rise in [S/Fe] with decreasing [Fe/H] is difficult to explain. It has been suggested that SNe with high explosion energies (hypernovae) could have made a substantial contribution to the nucleosynthesis of elements in the early Galaxy (Israelian & Rebolo IR01 (2001), Nakamura et al. NUI01 (2001)), or even that they may be responsible for a delayed deposition of the supernova-synthesized products into the interstellar medium (Ramaty et al. RSL00 (2000)).
On the other hand, Takeda et al. (THT05 (2005)) noted that, even taking into account the non-LTE effects on the formation of the S lines, the resulting abundance of sulfur depended on the multiplet used for this determination. There was, in particular, an apparent discrepancy between the abundance trends deduced from multiplets 6 and 1.
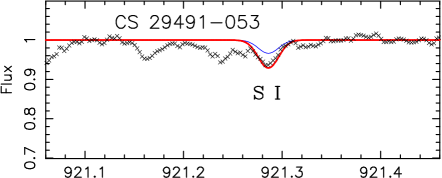
Taking advantage of a new model atom of sulfur (Korotin Kor08 (2008), Kor09 (2009)), based on new radiative photoionization rates, we here report S abundances for 33 very metal-poor stars, including 21 extremely metal-poor (EMP) stars with . Our study is based on a precise high-resolution NLTE analysis of the lines of the multiplet (hereafter Mult.) 1 of S I at 921.29, 922.81, and 923.75 nm (see Table 1).

2 Observations and reduction
All stars were observed as part of the ESO large programme “First Stars”, using the high-resolution spectrograph UVES (Dekker et al. DDK00 (2000)) at the ESO-VLT. The spectra were discussed in detail by Cayrel et al. (CDS04 (2004)) and Bonifacio et al. (BMS07 (2007), BSC09 (2009)). The resolving power of the spectra is with 5 pixels per spectral resolution element. The spectra were reduced using the UVES context within MIDAS (Ballester et al. BMB00 (2000)). The signal-to-noise ratio (S/N) per pixel in the region of the S I lines is typically for the giants and for the dwarfs (or 400 and 200 per resolution element, see Cayrel et al., CDS04 (2004)).
Three Ba-poor giants (McWilliam et al. MPS95 (1995)) were also observed as part of the programme, under similar conditions as the other metal-poor stars (see also Andrievsky et al. ASK11 (2011), to be submitted to A&A). The S abundance could be determined for one of them (CS 22949-048), which has been added to the sample.
3 Choice of sulfur lines and determination of fundamental atmospheric parameters
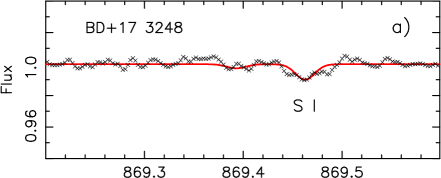
In cool stars, five multiplets of S Ican be observed in the red and near-infrared spectral region (Table 1): Mult. 1 at about 922 nm, Mult. 3 at 1045 nm, Mult. 6 at 869 nm, and Mult. 8 at 675 nm (Caffau et al. CBF05 (2005), 2010a ), and Mult. 1F, the forbidden line at 1082.1 nm (Ryde, Ryd06 (2006), Caffau & Ludwig, CL07 (2007)). However, in EMP stars, the lines of multiplets 6 and 8 are too weak to permit a precise analysis (see Fig. 1). The lines of Mult. 3 and Mult. 1F, are non-detectable in stars with , and are in any case outside the range of our spectra. The S abundances reported in this paper are therefore derived from the lines of Mult. 1 at 921.286, 922.809, and 923.754 nm.

| Wavelength (nm) | 921.29 | 922.81 | 923.75 |
|---|---|---|---|
| 6.525 | 6.525 | 6.525 | |
| log | 0.42 | 0.26 | 0.04 |
| EW (pm) | EW (pm) | EW (pm) | |
| Turnoff stars | |||
| BS 16968-061 | 1.68 | - | - |
| BS 17570-063 | 1.30 | - | - |
| CS 22965-054 | 1.30 | - | - |
| CS 29499-060 | 1.80 | - | - |
| CS 29506-007 | 1.98 | - | - |
| CS 29506-090 | 1.63 | - | - |
| CS 30301-024 | 1.95 | - | - |
| Giants | |||
| HD 2796 | 4.80 | 3.20 | 2.76 |
| HD 122563 | - | 1.92 | 1.29 |
| HD 186478 | - | 2.70 | 1.68 |
| BD+17 3248 | - | 4.88 | |
| BD-18 5550 | 1.65 | - | - |
| BS 17569-049 | - | 1.20 | 1.20 |
| CS 22169-035 | - | 1.00 | (0.76) † |
| CS 22186-025 | (2.09) | 1.52 | 0.79 |
| CS 22189-009 | 0.72 | - | 0.32 |
| CS 22873-055 | 2.37 | - | - |
| CS 22873-166 | 2.00 | 1.24 | 1.08 |
| CS 22878-101 | - | - | 0.72 |
| CS 22891-209 | 1.28 | (1.00) | - |
| CS 22892-052 | 1.18 | - | - |
| CS 22896-154 | 1.98 | - | 0.79 |
| CS 22897-008 | 0.90 | - | - |
| CS 22948-066 | - | 1.20 | - |
| CS 22953-003 | 1.43 | - | 0.74 |
| CS 22956-050 | 1.08 | - | - |
| CS 22966-057 | 2.49 | 1.04 | 1.15 |
| CS 29491-053 | 1.53 | 1.02 | 0.88 |
| CS 29502-042 | 0.83 | - | - |
| CS 29518-051 | 2.30 | 1.34 | - |
| CS 30325-094 | 1.33 | 0.98 | - |
| CS 31082-001 | 2.19 | 1.90 | 0.97 |
| CS 22949-048 | - | 0.55 | 0.45 |
| † Equivalent widths in parenthesis are very uncertain | |||
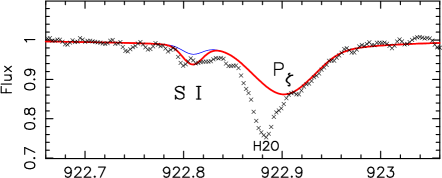
The line at 922.809 nm is located in the wing of the Paschen line, and the absorption from the hydrogen line has been taken into account in the computations (see Fig. 2). This spectral region is also crowded with telluric absorption lines of . Since no hot star was included among the programme stars, we did not try to remove these telluric lines, but carefully computed their position relative to the stellar lines using only S I lines free of contamination. At least one or two lines in each spectrum in general are free of blending.
Table 2 provides equivalent widths of the S I lines, since they were published neither in Cayrel et al. (CDS04 (2004)) nor Bonifacio et al. (BSC09 (2009)). In this spectral region, the observed spectra are affected by fringing, which is not completely compensated when dividing by a flat field (Nissen et al. NAA07 (2007)). The continuum level is therefore often not well defined, and we estimate that the error in the equivalent width can reach 0.4 pm for giants and 0.5 pm for dwarfs. Since in all the cases, the sulfur lines in Table 2 are ”weak”, the uncertainties, as a first approximation, are proportional to the EWs of the lines: abEW. However, these equivalent widths were not used in the computations since we directly compared synthetic and observed spectra; they are given here only for comparison.
In total, we could thus determine S abundances in 26 giants and 7 turnoff stars from our original sample.
| 3D+ | 3D+ | 3D+ | |||||||||||
| NLTE | LTE | err. | NLTE | 3D | NLTE | NLTE | NLTE | ||||||
| Star name | log | [Fe/H] | [Mg/H] | corr. | [S/H] | [S/Fe] | [S/Mg] | N | |||||
| Turnoff stars | |||||||||||||
| BS 16968–061 | 6040 | 3.8 | 1.5 | -3.05 | -2.46 | 4.90 | 0.20 | 4.33 | 0.14 | -2.69 | 0.36 | -0.23 | 1 |
| BS 17570–063 | 6240 | 4.8 | 0.5 | -2.92 | -2.52 | 5.05 | 0.20 | 4.61 | 0.12 | -2.43 | 0.49 | 0.09 | 1 |
| CS 22965–054 | 6090 | 3.8 | 1.4 | -3.04 | -2.42 | 4.74 | 0.20 | 4.21 | 0.13 | -2.82 | 0.22 | -0.40 | 1 |
| CS 29499–060 | 6320 | 4.0 | 1.5 | -2.70 | -2.14 | 4.90 | 0.20 | 4.50 | 0.12 | -2.54 | 0.16 | -0.40 | 1 |
| CS 29506–007 | 6270 | 4.0 | 1.7 | -2.91 | -2.25 | 5.03 | 0.20 | 4.62 | 0.12 | -2.44 | 0.47 | -0.19 | 1 |
| CS 29506–090 | 6300 | 4.3 | 1.4 | -2.83 | -2.22 | 4.98 | 0.20 | 4.56 | 0.12 | -2.48 | 0.35 | -0.26 | 1 |
| CS 30301–024 | 6330 | 4.0 | 1.6 | -2.75 | -2.25 | 4.98 | 0.20 | 4.60 | 0.12 | -2.44 | 0.31 | -0.19 | 1 |
| Giants | |||||||||||||
| HD 2796 | 4950 | 1.5 | 2.1 | -2.47 | -1.84 | 5.25 | 0.10 | 4.97 | 0.07 | -2.12 | 0.35 | -0.28 | 3 |
| HD 122563 | 4600 | 1.1 | 2.0 | -2.82 | -2.19 | 4.87 | 0.10 | 4.70 | 0.06 | -2.40 | 0.42 | -0.21 | 2 |
| HD 186478 | 4700 | 1.3 | 2.0 | -2.59 | -1.86 | 5.07 | 0.08 | 4.84 | 0.06 | -2.26 | 0.33 | -0.40 | 2 |
| BD+17 3248 | 5250 | 1.4 | 1.5 | -2.07 | -1.39 | 5.57 | 0.10 | 5.11 | 0.10 | -1.95 | 0.12 | -0.56 | 2 |
| BD-18 5550 | 4750 | 1.4 | 1.8 | -3.06 | -2.44 | 4.65 | 0.12 | 4.41 | 0.07 | -2.68 | 0.38 | -0.24 | 1 |
| BS 17569–049 | 4700 | 1.2 | 1.9 | -2.88 | -2.11 | 4.70 | 0.20 | 4.40 | 0.06 | -2.70 | 0.18 | -0.59 | 2 |
| CS 22169–035 | 4700 | 1.2 | 2.2 | -3.04 | -2.66 | 4.50 | 0.11 | 4.20 | 0.05 | -2.91 | 0.13 | -0.25 | 1 |
| CS 22186–025 | 4900 | 1.5 | 2.0 | -3.00 | -2.39 | 4.70 | 0.10 | 4.43 | 0.06 | -2.67 | 0.33 | -0.28 | 2 |
| CS 22189–009 | 4900 | 1.7 | 1.9 | -3.49 | -3.11 | 4.25 | 0.20 | 3.97 | 0.07 | -3.12 | 0.37 | -0.01 | 2 |
| CS 22873–055 | 4550 | 0.7 | 2.2 | -2.99 | -2.34 | 4.72 | 0.10 | 4.52 | 0.10 | -2.54 | 0.45 | -0.20 | 1 |
| CS 22873–166 | 4550 | 0.9 | 2.1 | -2.97 | -2.14 | 4.70 | 0.10 | 4.55 | 0.07 | -2.54 | 0.43 | -0.40 | 3 |
| CS 22878–101 | 4800 | 1.3 | 2.0 | -3.25 | -2.56 | 4.55 | 0.16 | 4.36 | 0.05 | -2.75 | 0.50 | -0.19 | 1 |
| CS 22891–209 | 4700 | 1.0 | 2.1 | -3.29 | -2.69 | 4.40 | 0.15 | 4.21 | 0.06 | -2.89 | 0.40 | -0.20 | 1 |
| CS 22892–052* | 4850 | 1.6 | 1.9 | -3.03 | -2.52 | 4.48 | 0.10 | 4.29 | 0.05 | -2.82 | 0.21 | -0.30 | 1 |
| CS 22896–154 | 5250 | 2.7 | 1.2 | -2.69 | -2.06 | 5.00 | 0.08 | 4.56 | 0.07 | -2.53 | 0.16 | -0.47 | 2 |
| CS 22897–008 | 4900 | 1.7 | 2.0 | -3.41 | -2.83 | 4.35 | 0.18 | 4.10 | 0.06 | -3.00 | 0.41 | -0.17 | 1 |
| CS 22948–066 | 5100 | 1.8 | 2.0 | -3.14 | -2.59 | 4.65 | 0.14 | 4.26 | 0.06 | -2.84 | 0.30 | -0.25 | 1 |
| CS 22949–037* | 4900 | 1.5 | 1.8 | -3.97 | -2.42 | - | 0.07 | 2 | |||||
| CS 22953–003 | 5100 | 2.3 | 1.7 | -2.84 | -2.34 | 4.72 | 0.10 | 4.41 | 0.06 | -2.69 | 0.15 | -0.35 | 2 |
| CS 22956–050 | 4900 | 1.7 | 1.8 | -3.33 | -2.59 | 4.45 | 0.20 | 4.18 | 0.06 | -2.92 | 0.41 | -0.33 | 1 |
| CS 22966–057 | 5300 | 2.2 | 1.4 | -2.62 | -1.89 | 5.12 | 0.10 | 4.62 | 0.08 | -2.46 | 0.16 | -0.57 | 3 |
| CS 29491–053 | 4700 | 1.3 | 2.0 | -3.04 | -2.34 | 4.60 | 0.10 | 4.45 | 0.05 | -2.66 | 0.38 | -0.32 | 3 |
| CS 29502–042 | 5100 | 2.5 | 1.5 | -3.19 | -2.52 | 4.50 | 0.14 | 4.13 | 0.06 | -2.97 | 0.22 | -0.45 | 1 |
| CS 29518–051 | 5200 | 2.6 | 1.4 | -2.69 | -2.02 | 4.95 | 0.10 | 4.50 | 0.07 | -2.59 | 0.10 | -0.57 | 2 |
| CS 30325–094 | 4950 | 2.0 | 1.5 | -3.30 | -2.54 | 4.64 | 0.18 | 4.19 | 0.06 | -2.91 | 0.39 | -0.37 | 2 |
| CS 31082–001 | 4825 | 1.5 | 1.8 | -2.91 | -2.09 | 4.84 | 0.10 | 4.54 | 0.07 | -2.55 | 0.36 | -0.46 | 3 |
| CS 22949–048 | 4800 | 1.5 | 2.0 | -3.25 | -2.68 | 4.42 | 0.15 | 4.07 | 0.05 | -3.04 | 0.21 | -0.39 | 2 |
* An asterisk after the name of the star means that the star is carbon-rich.
4 NLTE calculations and 3D correction
The atmospheric parameters of the stars (, , [Fe/H]) were adopted from Cayrel et al. (CDS04 (2004)), Hill et al. (HPC02 (2002)), and Bonifacio et al. (BMS07 (2007)) and for the Ba-poor star from Andrievsky et al. (ASK11 (2011)). To summarize, the temperature of the giants were inferred from their colours by adopting the calibration of Alonso et al. (AAM96 (1996)), and the temperature of the turnoff stars from the wings of the line. The random error in the temperature is about 80 K (). For a given stellar temperature, the ionization equilibrium provides an estimate of the stellar gravity with an internal accuracy of about 0.1 dex in , and the microturbulence velocity can be constrained to within . The adopted parameters are given in Table 3. Table 4 lists the uncertainty in the sulfur abundance originating in the errors in , , and . Because gravity is determined from the ionization equilibrium, a variation in will change and also sometimes slightly influences . Hence, the total error budget is not the quadratic sum of the various sources of uncertainties, but contains significant covariance terms (see Cayrel et al. CDS04 (2004) for more details).
Our value may be affected by NLTE effects (overionization) and the uncertainties in the oscillator strengths of the Fe and Ti lines. This was discussed in Cayrel et al. (CDS04 (2004)), their section 3.1. : even for giants the spectroscopic and the value deduced from isochrones should not differ by more than about 0.3 dex.
| CS 29506-090 | ||||
|---|---|---|---|---|
| A: =6300K, =4.3 dex, vt=1.4 km s-1 | ||||
| B: =6300K, =4.2 dex, vt=1.4 km s-1 | ||||
| C: =6300K, =4.3 dex, vt=1.2 km s-1 | ||||
| D: =6200K, =4.3 dex, vt=1.4 km s-1 | ||||
| E: =6200K, =4.1 dex, vt=1.3 km s-1 | ||||
| El. | ||||
| [Fe/H] | -0.03 | 0.03 | -0.06 | -0.07 |
| S I/Fe] | 0.00 | -0.03 | 0.09 | 0.04 |
| Fe I/Fe] | 0.02 | 0.01 | -0.04 | 0.01 |
| Fe II/Fe] | -0.01 | -0.01 | 0.04 | -0.01 |
| HD 122563 | ||||
| A: =4600K, =1.0 dex, vt=2.0 km s-1 | ||||
| B: =4600K, =0.9 dex, vt=2.0 km s-1 | ||||
| C: =4600K, =1.0 dex, vt=1.8 km s-1 | ||||
| D: =4500K, =1.0 dex, vt=2.0 km s-1 | ||||
| E: =4500K, =0.6 dex, vt=1.8 km s-1 | ||||
| El. | ||||
| [Fe/H] | -0.00 | 0.06 | -0.09 | -0.06 |
| S I/Fe] | -0.02 | -0.02 | 0.12 | 0.04 |
| Fe I/Fe] | 0.03 | 0.03 | -0.11 | 0.03 |
| Fe II/Fe] | -0.03 | -0.04 | 0.11 | -0.03 |
For the non-LTE computations of the sulfur abundance, Kurucz models without overshooting were used (Castelli et al., CGK97 (1997)). These models have been shown to provide LTE abundances very similar (within 0.05 dex) to those of the MARCS models used by Cayrel et al. (CDS04 (2004)) and Bonifacio et al. (BSC09 (2009)).
It has been shown (see Takeda et al. THT05 (2005), Korotin Kor08 (2008)) that Mult. 1 of S I is affected by a significant negative non-LTE correction. To compute NLTE profiles of the S I lines, we used the model atom of Korotin (Kor08 (2008)), which contains 64 levels of S I and the ground level of S II. The radiative photoionization rates of all the levels taken into account are based on the new detailed ionization cross-sections listed in the Opacity Project TopBase (hereafter TopBase)111http://cdsweb.u-strasbg.fr/topbase/topbase.html. The oscillator strengths of the lines are also taken from TopBase. The line profiles were computed from a modified version of the program MULTI (Carlsson Car86 (1986), Korotin et al. KAL99 (1999)). This version includes, in particular, opacity sources from ATLAS9 (Kurucz Kur92 (1992)), which modify the continuum opacity and the intensity distribution in the UV region. These sources are very important for determining of the radiative rates of the bound-bound transitions in the sulfur atom. In Fig. 3, we present the new non-LTE correction computed for metal-poor stars for the 921.2 nm sulfur line of the Mult. 1. This correction is sometimes rather different from the correction computed by Takeda et al. (THT05 (2005)). For example, for turnoff stars with a metallicity of about –3.0 and a temperature of 6000 K, the correction is found to be close to –0.6 dex, whereas it was only about –0.2 dex following Takeda et al. (THT05 (2005)).
We also computed the 3D correction (as explained in Caffau et al. 2010b or Caffau & Ludwig CL07 (2007)). This correction is small, but positive (Table 3), and has been computed and applied separately.
4.1 Test of coherence
With the model atom adopted here, there is good agreement (to within 0.1
dex) in the Sun and in Procyon between the S abundances derived from
the different multiplets when 3D models are used.
For Procyon, we found from the 3D,
LTE computations of Caffau et al. (CFB07 (2007)) with a Korotin’s
NLTE correction (private communication).
For the Sun, the mean sulfur abundance derived from these
computations is log , for log (Caffau et al. (2010b ). This value is very
close to the meteoritic value (, following Lodders et
al., LPG09 (2009)). The solar abundance
has been adopted as a reference in our computations.
Moreover, for the most metal-rich star of our sample, BD+17 3248, the
S abundance could be determined from the lines of the Mult. 1 and the
main line of Mult. 6 (Fig. 1a). The agreement between the
NLTE S abundances derived from multiplets 6 and 1 is very good when
the 3D correction is also included (-0.02 for Mult. 6, +0.10 for
Mult. 1): from Mult. 6 and from Mult. 1.


5 Results
In Table 3, we present the result of the computations for our sample of stars. The S abundances were derived from fits of synthetic spectra (Fig. 2). The sulfur abundances could not be determined for the most metal-poor stars ( for giants, for dwarfs), because the lines were too weak to be measured reliably. However, an upper limit to the sulfur abundance was given for CS 22949-037 because this upper limit can help us to explain the chemical anomalies of this star (see section 5.3). The error in the sulfur abundance, given in Table 3, represents the uncertainty in the spectral fitting. This error strongly dominates the total error in both [S/Fe] and [S/Mg].
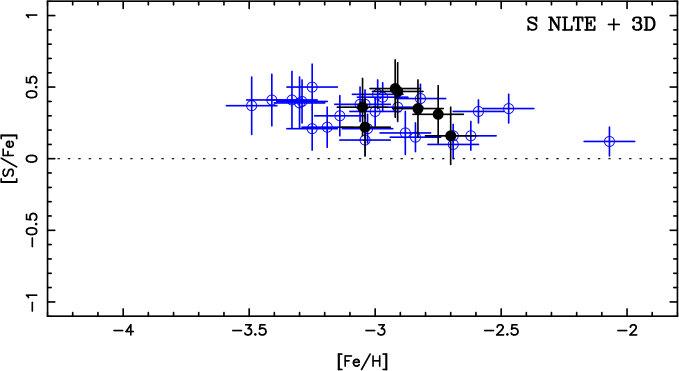
5.1 [S/Fe] vs. [Fe/H] and comparison to previous studies
Fig. 4 shows [S/Fe] as a function of [Fe/H] for our sample of
EMP stars. Below [Fe/H]=–2.9, the slope of the relation is very
small : , thus [S/Fe] is practically constant
with a mean of . The level of
this plateau is in good agreement with the value found by Nissen et
al. (NCA04 (2004), NAA07 (2007)) and Caffau et al. (CBF05 (2005)),
(found for the most metal-poor stars
of their sample).

Behavior of stars with
It is interesting that none of the stars in Fig. 4 is found
to be ”S-rich” (), in contrast to several stars in
the interval (Israelian & Rebolo IR01 (2001),
Takada-Hidai et al. TTS02 (2002), Takeda et al. THT05 (2005), and
Caffau et al. CBF05 (2005)).
The most S-rich star in Israelian & Rebolo (IR01 (2001)) is HD 2796, for which [S/Fe]=+0.8. It is included in our sample, but its very high S abundance is not confirmed by our measurement of the lines of Mult. 1 from which we find [S/Fe]=+0.3. Israelian & Rebolo found that EW=0.26 pm for the main line of Mult. 6 in this star, but although our spectrum has a very high S/N in this region (over 500/pix at 869 nm), we do not detect the line (Fig. 1b). Its equivalent width is clearly smaller than 0.26 pm, the error in the equivalent width was probably underestimated by Israelian & Rebolo. Ryde & Lambert (RL04 (2004)), reanalysed three other S-rich stars from the list of Israelian & Rebolo with and for all of them they found also found a normal sulfur abundance.
In Caffau et al. (CBF05 (2005)), three other stars were found to be S-rich (with ), BD+02 263, BD+05 3640 and CD-45 13178 (HD 181743), their metallicities being in the interval , thus outside the range of metallicity explored in our paper. Moreover, in HD 181743, Nissen et al. (NAA07 (2007)) found from the Mult. 1 a normal abundance of sulfur ([S/Fe]=+0.34), but on the other hand, in BD+05 3640 the high sulfur abundance has been confirmed (but at a lower level) by Caffau et al. (2010a ) by the analysis of the Mult. 3.
It remains unclear wether S-rich stars exist with metallicities
in the interval .
Behavior of stars with
Recently, Takeda & Takada-Hidai (TT10 (2010)) measured the Mult. 3
of S I in metal-poor stars and found [S/Fe] to be constant in
the interval , but to increase suddenly for
. They have only five stars with , and in one of them the S line cannot be detected. For G64-37,
the uncertainty is so high that the detection is in doubt (see their
Fig. 13). Of the three remaining stars, two of them are in common
with our sample: HD 122563 and BD–18 5550. For these stars, we find
”normal” S abundances of [S/Fe]=+0.42 and +0.38 from Mult. 1 (Table
3).
To understand the cause of this discrepancy, we remeasured the equivalent widths of the 1045.5449 nm line in the spectra of Takeda & Takada-Hidai (TT10 (2010)), neglecting the other two lines, which are even fainter. The lines of Mult. 3 used by Takeda & Takada-Hidai are weaker than those of Mult. 1 and their spectra have only half the resolution of ours. For HD 122563, we find that EW=1.5 pm, corresponding to [S/Fe]= +0.45, in excellent agreement with our determination. Since the sulfur lines are weak, the value of [S/Fe] found by Takeda & Takada-Hidai was simply corrected by ), where EW1 and EW2 represent the old and new equivalent widths. BD–18 5550 is the most S-rich star in the sample of Takeda & Takada-Hidai with [S/Fe]=+0.76, against our value of +0.38 from Mult. 1 (see Fig. 5). For this star, the S/N of the spectrum of Takeda & Takada-Hidai seems to be rather high, but we note that the full width at half maximum (FWHM) of the lines is much larger in this spectrum than in the spectrum of HD 122563, while in our UVES spectra the FWHM of the lines in both stars is about the same. If we fix the FWHM of the lines in BD–18 5550 to the same value as in HD 122563, we find the equivalent width of the 1045.5449 nm line to be about 1.2 pm and [S/Fe]=+0.62. Adopting the Cayrel formula (Cayrel Cay88 (1988)) to estimate the precision of this measurement (with S/N =150), we find the error of this equivalent width to be close to 0.5 pm. Hence, the error in the abundance ratio should be about 0.2 dex, which makes their result compatible with ours.
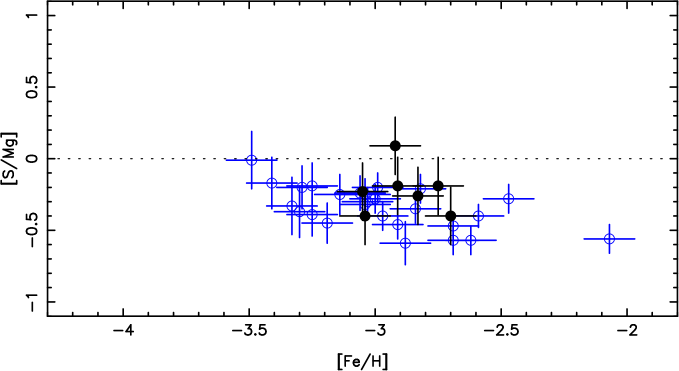

5.2 [S/Mg] vs. predicted supernova yields
It is often noted that magnesium should be a more reliable reference element than iron, because Mg is only formed in massive SN II and its production is less affected by explosive nucleosynthesis, mixing, and ”fallback”. As a consequence, the predictions for [S/Mg] should be more robust than for [S/Fe] (Woosley & Weaver, WW95 (1995), Shigeyama & Tsujimoto ST98 (1998)).
The NLTE abundance of Mg for our sample of stars was computed by Andrievsky et al. (ASK10 (2010)). Fig. 6 shows the observed value of [S/Mg] as a function of [Fe/H] and [Mg/H]. The scatter is small, but two stars seem to have a high [S/Mg] ratio: BS 17570–063 ([Fe/H]=–2.92) and CS 22189–009 ([Fe/H]=–3.49). In both cases, the high [S/Mg] ratio seems to be real, and not the consequence of an uncertainty in the magnesium abundance (see Fig. 6). The full spread of NLTE [Mg/Fe] for the metal-poor stars below is definitely larger than expected from the error estimate of the analysis itself (see Gehren et al., GSZ06 (2006), Andrievsky et al., ASK10 (2010), and also Cayrel et al., CDS04 (2004)) and the anomalies of the magnesium abundances are not clearly correlated with the other elements.
In the interval , we can define a mean value of [S/Mg] as done for O, Na, Al and K by Andrievsky et al. (ASK10 (2010)): . In the same metallicity interval, the scatter in [S/Fe] around the mean is only 0.12 dex (see Fig 4). It appears that, as already observed in LTE (Cayrel et al. CDS04 (2004)), the scatter of the abundance ratios is slightly larger when Mg rather than Fe is used as the reference element. This is surprising because Fe forms in processes quite different from those forming Mg and S (explosive burning for Fe, and mainly hydrostatic C, Ne, and O burning for Mg and S).
For , a slight increase in [Na/Mg], [Al/Mg], and [K/Mg] as [Mg/H] decreases was seen by Andrievsky et al. (ASK10 (2010)). A slight increase in [S/Mg] is also possible (Fig. 6), but there are very few stars with in our sample. We plan to discuss the evolution of [S/Mg] in the Galaxy in more detail when we have completed a new precise analysis of disk stars, including NLTE and 3D corrections.

5.3 The case of the peculiar C-rich star CS 22949-037
CS 22949-037 is a very peculiar giant: it is extremely metal-poor (), and its unusual chemical composition was first pointed out by McWilliam et al. (MPS95 (1995)) and later studied in more detail by Norris et al. (NRB01 (2001)) and Depagne et al. (DHS02 (2002)). This star exhibits light element (C-N-O, Na, Mg) enhancements that are quite similar to those associated with the hyper iron-poor stars HE 0107-5240 and HE 1327-2326 with (see Frebel et al., FAC05 (2005), FCE08 (2008)). It is generally admitted that these stars are the product of specific zero-metal supernovae. However, Venn & Lambert (VL08 (2008)) argued that this abundance pattern might be associated with the same peculiarity that is used to account for stars (presumably related to dust depletion). If this were so, the abundance of the elements should be smoothly correlated with the condensation temperature . The abundances of S and Zn could help us to choose between the two hypotheses, because their temperatures are intermediate between those of O and Na, both of which are strongly enhanced in CS 22949-037. If dust depletion is responsible for the pattern of CS 22949-037 we would expect that sulfur and zinc also be strongly enhanced in this star. The abundance of zinc was measured in CS 22949-037 by Depagne et al. (DHS02 (2002)). The sulfur lines are not visible in this star but (as can be seen in Table 3) an upper limit can be estimated as or . In Fig. 7, we have plotted [X/H] vs. . The abundances [X/H] of C, N, O, Ca, Fe, and Zn are taken from Depagne et al. (DHS02 (2002)); for the other elements Na, Mg, Al, S, Sr, and Ba, the NLTE abundances (Andrievsky et al., ASK07 (2007), ASK08 (2008), ASK09 (2009), ASK10 (2010), ASK11 (2011)) have been preferred. The oxygen abundance, determined from the forbidden line, is insensitive to the NLTE effects. It can be seen that CS 22949-037 does not show any clear signature of dust depletion.
5.4 Comparison with predicted SN yields
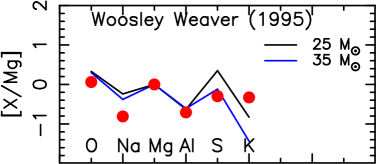
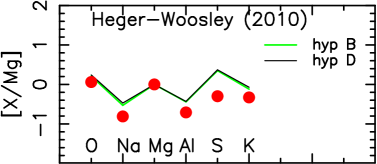
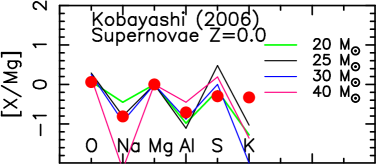
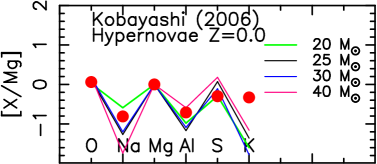
In Fig. 8, we compare the abundance ratios of the light metals to some predicted abundances in the ejecta of metal-poor SNe or hypernovae following Woosley & Weaver (WW95 (1995)), Kobayashi et al. (KUN06 (2006)), and Heger & Woosley (HW10 (2010)). The mean values of the observed abundances of the different elements are computed in the interval , their uncertainty being of the order of 0.1 dex. The amount of ejected S seems to be generally overestimated by the models. If we consider all the elements from O to K, the best agreement is obtained with the predictions by the models of Heger & Woosley HW10 (2010) (hypotheses B or D, with a low mass cutoff at 10), mainly because their predictions show a better agreement with the observed K abundance.
5.5 [S/Zn] in metal-poor stars and damped systems
| Ident | [Zn/H] | [S/Zn] | reference S | reference Zn |
|---|---|---|---|---|
| 0010-0012 | -1.35 | 0.24 | Srianand,05 | Ledoux,03 |
| 0058-2914 | -1.52 | 0.22 | Srianand,05 | Pettini,00 |
| 0100+130 | -1.55 | 0.15 | Molaro,98 | Dessauges-,04 |
| 0102-1902 | -1.88 | 0.06 | Srianand,05 | Ledoux,03 |
| 0112+029 | -1.01 | -0.18 | Ledoux,03 | Pettini,94 |
| 0347-383 | -1.15 | 0.06 | Srianand,05 | Ledoux,03 |
| 0405-443 | -1.34 | -0.09 | Lopez,03 | Ledoux,06 |
| 0405-443 | -1.06 | 0.04 | Lopez,03 | Ledoux,06 |
| 0528-2505 | -1.47 | 0.07 | Centurion,03 | Ledoux,06 |
| 0841+129 | -1.45 | 0.10 | Ledoux,06 | Centurion,03 |
| 0841+129 | -1.74 | 0.32 | Centurion,03 | Dessauges-,06 |
| 1223+178 | -1.63 | 0.25 | Dessauges-,07 | Ledoux,03 |
| 1331+170 | -1.25 | 0.07 | Dessauges-,04 | Dessauges-,04 |
| 2138-4427 | -1.64 | 0.04 | Srianand,05 | Ledoux,03 |
| 2314-409 | -1.03 | 0.11 | Ellison,01 | Ledoux,06 |
| 2343+1232 | -1.30 | -0.06 | Noterdaeme,07 | Ledoux,06 |
Nissen et al. (NCA04 (2004)) suggested that the [S/Zn] ratio is
higher in stars than in damped systems. Neither S nor
Zn shows much affinity for dust, although MgS has been recently
proposed as a possible grain constituent by Zhang et al.
(ZJL09 (2009)). Thus, depletion onto dust in DLAs probably cannot
explain this difference.
Nissen et al. (NAA07 (2007)) have shown that in the interval
this effect is considerably reduced
if one adopts the non-LTE corrections to the abundances of S and Zn.
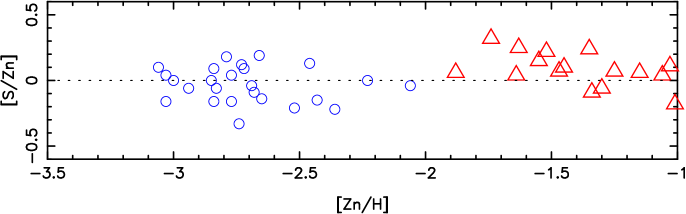
Fig. 9 shows [S/Zn] vs. [Zn/H] for
our sample of metal-poor stars and for the most metal-poor DLAs with
both Zn and S abundance determinations (Table 5). Since the
Zn line is very weak in turnoff stars, we could only measure Zn
abundances in our giant stars (Cayrel et al., CDS04 (2004)).
Following Takeda et al. (THT05 (2005)), non-LTE effects for Zn are
not very important in these stars (), but we have
applied the small correction obtained by interpolation in their tables.
With stellar NLTE effects taken into account for both S and Zn, Fig. 9 shows that the sulfur abundance in metal-poor stars is rather similar to that in DLAs – if anything slightly lower. However, the chemical evolution of the Galactic halo might still be different from the average of DLAs.
In EMP stars as in DLAs, the [S/Zn] ratio is approximately solar. This is due to positive values of both [S/Fe] (Fig. 4) and [Zn/Fe] at very low metallicity (Cayrel et al. CDS04 (2004); see also Primas et al. PBS00 (2000) and Nissen et al. NCA04 (2004)). We will discuss the evolution of the [S/Zn] ratio in the Galaxy in more detail when we have completed a new precise analysis of S abundances in less metal-poor stars.
6 Conclusions
We have determined S abundances in 33 metal-poor stars, including 21 with , and find [S/Fe] to be fairly constant at . However, a slight increase in [S/Mg] when [Mg/H] decreases cannot be excluded (Fig. 6). The same effect is also observed for Na, Al, and K (Spite et al. SSB09 (2009), Andrievsky et al. ASK10 (2010)).
We do not confirm earlier claims of a significant rise in [S/Fe] with decreasing [Fe/H], but corroborate the findings of Nissen et al. (NCA04 (2004), NAA07 (2007)) and Ryde & Lambert (RL04 (2004)) that S behaves like the other -elements, also at very low metallicity.
The low sulfur abundance (along with a low abundance of zinc) in CS 22949-037 suggests that the abundance pattern in this star (and thus by analogy in the hyper iron-poor stars HE 0107-5240 and HE 1327-2326) is the result of specific zero-metal supernovae and is unrelated to dust depletion as suggested by Venn & Lambert (VL08 (2008)).
When the NLTE effects are taken into account, the pattern of the light elements from O to K relative to magnesium, is rather well represented by ejecta of zero-metal supernovae (Heger & Woosley HW10 (2010)).
The ratio [S/Zn] is found to be approximately solar as it is in DLAs since [S/Fe] and [Zn/Fe] are both equally positive at low metallicity.
Acknowledgements.
SMA gratefully acknowledges the support and hospitality of Observatoire de Paris-Meudon. MS, EC, FS, PB, RC, PF and VH acknowledge the support of CNRS (PNCG and PNPS). BB acknowledges grants from FAPESP and CNPq. BN and JA acknowledge the support of the Carlsberg Foundation and the Danish Natural Science Research Council and TCB acknowledges partial funding of this work from grants PHY 02-16783 and PHY 08-22648: Physics Frontiers Center/Joint Institute for Nuclear Astrophysics (JINA), awarded by the U.S. National Science Foundation. We also thank the anonymous referee for his helpful comments.References
- (1) Alonso A., Arribas S., Martinez-Roger C., 1996, A&A 313, 873
- (2) Andrievsky S. M., Spite M., Korotin S. A., Spite F., Bonifacio P., Cayrel R., Hill V., Fran ois P., 2007, A&A 464, 1081
- (3) Andrievsky S. M., Spite M., Korotin S. A., Spite F., Bonifacio P., Cayrel R., Hill V., Fran ois P., 2008, A&A 481, 481
- (4) Andrievsky S. M., Spite M., Korotin S.A., Spite F., Bonifacio P., Cayrel R., Hill V., François P., 2009, A&A 494, 1083
- (5) Andrievsky S. M., Spite M., Korotin S. A., Spite F., Bonifacio P., Cayrel R., Fran ois P., Hill V., 2010, A&A 509, 88
- (6) Andrievsky S. M., Spite F., Korotin S. A., Spite M. et al., 2011 to be submitted to A&A
- (7) Ballester P., Modigliani A., Boitiquin O., Cristiani S., Hanuschik R., et al., 2000 ESO Messenger 101 31
- (8) Bonifacio P., Molaro P., Sivarani T., et al., 2007 A&A462 851 (“First Stars VII”)
- (9) Bonifacio P., Spite M., Cayrel R., Hill V., et al., 2009, A&A 501, 519 (“First Stars XII”)
- (10) Caffau E., Bonifacio P., Faraggiana R., François P., Gratton R.G., Barbieri M., 2005, A&A 441, 533
- (11) Caffau E., Ludwig H.-G., 2007, A&A 467, L11
- (12) Caffau E., Faraggiana R., Bonifacio P., Ludwig H.-G., Steffen M., 2007, A&A 470, 699
- (13) Caffau E., Sbordone L., Faraggiana R., Ludwig H.-G., Bonifacio P., Spite M., 2010a, AN 331, 725
- (14) Caffau, E., Ludwig, H.-G., Steffen, M., Freytag, B., & Bonifacio, P. 2010b, Solar Phys., 66
- (15) Carlsson M., 1986, Uppsala Obs. Rep. 33
- (16) Castelli F., Gratton R. G., Kurucz, R. L. 1997, A &A 318, 841
- (17) Cayrel R., 1988, Proceedings of the IAU symposium 132 “The impact of very high S/N spectroscopy on stellar physics”, eds. G. Cayrel de Strobel and M. Spite, Kluwer Academic Publishers, Dordrecht, p.345
- (18) Cayrel R., Depagne E., Spite M., Hill V., Spite F., François P., Plez B., Beers T.C., Primas F., Andersen J., Barbuy B., Bonifacio P., Molaro P., Nordström B., 2004 A&A 416 1117 (“First Stars V”)
- (19) Centurión M., Molaro P., Vladilo G., 2003, A&A, 403, 55
- (20) Dekker H., D’Odorico S., Kaufer A., et al., 2000 in Optical and IR Telescopes Instrumentation and Detectors eds I., Masanori & A.,F., Morwood Proc., SPIE 4008 534
- (21) Depagne E., Hill V., Spite M., Spite F., Plez B., Beers T.C., Barbuy B., Cayrel R., Andersen J., Bonifacio P., François P., Nordström B., Primas F., 2004 A&A 416 1117 (“First Stars II”)
- (22) Dessauges-Zavadsky, M.; Calura, F.; Prochaska, J. X.; D’Odorico, S.; Matteucci, F., 2004, A&A 416, 79
- (23) Dessauges-Zavadsky, M.; Prochaska, J. X.; D’Odorico, S.; Calura, F.; Matteucci, F., 2006, A&A 445, 93
- (24) Dessauges-Zavadsky, M.; Calura, F.; Prochaska, J. X.; D’Odorico, S.; Matteucci, F., 2007, A&A 470, 431
- (25) Ellison S. L., Lopez S., 2001, A&A, 380, 117
- (26) François P., 1987, A&A 176, 294
- (27) François P., 1988, A&A 195, 226
- (28) Frebel A., Aoki W., Christlieb N., Ando H., Asplund M., Barklem P. S., Beers T. C., Eriksson K., Fechner C., Fujimoto M. Y., 2005, Nature 434, 871
- (29) Frebel A., Collet R., Eriksson K. et al., 2008, ApJ 684, 588
- (30) Gehren T., Shi J.R., Zhang H.W. et al. 2006, A&A 451, 1065
- (31) Heger A., Woosley S.E., 2010, ApJ 724, 341
- (32) Hill V., Plez B., Cayrel R., Beers T.C., Nordström B., Andersen J., Spite M., Spite F., Barbuy B., Bonifacio P., Depagne E., François P., Primas F., 2002, A&A 387, 560 (“First Stars I”)
- (33) Israelian G., Rebolo R., 2001, ApJ 557, L43
- (34) Kobayashi C., Umeda H., Nomoto K., Tominaga N., and Ohkubo T. 2006, ApJ 653,1145
- (35) Korotin S.A., 2008, Odessa Astronomical Pub. 21, 42
- (36) Korotin S.A., 2009, Astronomicheski’ Zhurnal, 2009 86, 702 and 2009, Astr. Rep. 53, 651
- (37) Korotin S.A., Andrievsky S. M., Luck R.E., 1999, A&A 351, 168
- (38) Kurucz R.L., 1992, RMxAA 23, 181
- (39) Ledoux, C., Petitjean P., Srianand, R., 2003, MNRAS, 346, 209L
- (40) Ledoux C., Petitjean P., Fynbo J. P. U., M ller P., Srianand R., 2006, A&A 457, 71L
- (41) Lodders K., 2003, ApJ 591, 1220
- (42) Lodders K., Palme H., Gail H.-P., 2009, Landolt-Börnstein, New Series, Astronomy and Astrophysics, Springer Verlag, Berlin
- (43) Lopez S., Reimers D., D Odorico S., Prochaska J.X., 2002, A&A, 385, 778
- (44) Lopez S., Ellison S. L., 2003, A&A, 403, 573
- (45) McWilliam A., Preston G. W., Sneden C., Searle L., 1995, AJ, 109, 2757
- (46) Molaro P., Vladilo G., Centurion M., 1998, MNRAS 293, L37
- (47) Nakamura T., Umeda H., Iwamoto K., Nomoto K., Hashimoto M., Hix W.R., & Thielemann F.-K. 2001, ApJ, 555, 880
- (48) Nissen P., Chen Y.Q., Asplund M., Pettini M., 2004, A&A 415, 993
- (49) Nissen P.E., Akerman C., Asplund M., Fabbian D., Kerber F., Kaufl H.U., Pettini M., 2007, A&A 469, 319
- (50) Norris J.E., Ryan S.G., Beers T.C., 2001, ApJ 561, 1034
- (51) Noterdaeme P., Ledoux C., Petitjean P., Le Petit F., Srianand R., Smette A., 2007, A&A 474, 393
- (52) Pettini M., Smith L. J., Hunstead R. W., King, D. L., 1994, ApJ 426, 79
- (53) Pettini M., Ellison S. L., Steidel C. C., Shapley A. E., Bowen D. V., 2000, ApJ 532, 65
- (54) Primas F., Brugamyer E., Sneden C., King J.R., Beers T.C., Boesgaard A.M., Deliyannis C.P., 2000, “The First Stars”: Proceedings of the MPA/ESO Workshop, ESO ASTROPHYSICS SYMPOSIA., Eds. A. Weiss, T.G. Abel, and V. Hill. Springer-Verlag, 2000, p. 51
- (55) Prochaska J. X., Wolfe A. M., Tytler D., et al. 2001, ApJS, 137, 21
- (56) Ramaty R., Scully S., Lingenfelter R., Kozlovsky B. 2000, ApJ, 534, 747
- (57) Ryde N., Lambert D.L., 2004, A&A 415, 559
- (58) Ryde N., 2006, A&A 455, L13
- (59) Shigeyama, T., Tsujimoto, T. 1998, ApJ, 507, L135
- (60) Spite M., Spite F., Bonifacio P., Hill V., Andrievsky S., Cayrel R., François P., Korotin S., 2009 “Chemical Abundances in the Universe: Connecting First Stars to Planets”, Proceedings of the IAU Symposium 265, Eds. K. Cunha, M. Spite & B. Barbuy, p. 380
- (61) Srianand R., Petitjean P., Ledoux C., Ferland G., Shaw G., 2005, MNRAS, 362, 549
- (62) Takada-Hidai, M., Takeda, Y., Sato, S., et al. 2002, ApJ, 573, 614
- (63) Takeda Y., Hashimoto O., Taguchi H., Yoshioka K. Takada-Hidai M., Saito Y., Honda S., 2005, PASJ 57, 751
- (64) Takeda Y., Takada-Hidai M., 2010, ArXiv 1009.0824 (to be published in PASJ)
- (65) Venn K.A., Lambert D.L., 2008, ApJ, 677, 572
- (66) Woosley S. E., Weaver T. A. 1995, ApJS, 101, 181
- (67) Zhang K., Jiang B.W., Li A., 2009, ApJ 702, 680