Infall and outflow detections in a massive core JCMT 18354-0649S
Abstract
We present a high-resolution study of a massive dense core JCMT 18354-0649S with the Submillimeter Array. The core is mapped with continuum emission at 1.3 mm, and molecular lines including CH3OH (–) and HCN (3–2). The dust core detected in the compact configuration has a mass of and a diameter of (0.06 pc), which is further resolved into three condensations with a total mass of under higher spatial resolution. The HCN (3–2) line exhibits asymmetric profile consistent with infall signature. The infall rate is estimated to be yr-1. The high velocity HCN (3-2) line wings present an outflow with three lobes. Their total mass is and total momentum is km s-1, respectively. Analysis shows that the N-bearing molecules especially HCN can trace both inflow and outflow.
1 Introduction
Studies of high-mass star formation have received much attention during recent years. One of the main questions is whether massive stars form through an accretion-disk-outflow process, similar to low-mass counterparts (Shu, Adams, & Lizano 1987), or via collision-coalescence (Wolfire & Cassinelli 1987; Bonnell, Bate, & Zinnecker. 1998). Studying the characteristics of massive cores at the early stages is critical for understanding their formation process. High-Mass Protostellar Objects (HMPOs) are precursors of UC Hii regions, and represent an essential phase in high-mass star formation (Churchwell 2002). HMPOs often have strong dust emission and high bolometric luminosity. But their radio emission is weak or non detectable at a level of approximately 1 mJy (Molinari et al. 1996, 2000; Sridharan et al. 2002; Beuther, Schilke, & Menten. 2002; Wu et al. 2006).. Their natal clouds have not been affected significantly by the star forming process. Thus, they present the information about the early kinematic processes of high mass star formation.
The dense core JCMT 18354-0649S was first detected in an ammonia survey of high-mass star forming regions with Max-Planck-Institut für Radioastronomie (MPIfR) 100 m telescope at Effelsberg (Wu et al. 2006), and was later confirmed by the observation with the Submillimeter Common-User Bolometric Array (SCUBA) of James Clerk Maxwell telescope (JCMT) (Wu et al. 2005). Another SCUBA core which harbors a UC H ii region G35.4NW is located about north of JCMT 18354-0649S. The kinetic distance of the two SCUBA cores is 5.7 or 9.6 kpc (Wu et al. 2005), and 5.7 kpc was adopted in this paper. Core JCMT 18354-0649S has no counterpart in radio continuum. Multiple lines towards this core including HCN (3–2), H13CO+ (3–2), and C17O (2–1) reveal typical ”blue profile” (Wu et al. 2005), indicating that the core is undergoing gravitational collapse (Keto, Ho & Haschick. 1988; Zhou et al. 1993; Zhang, Ho, & Ohashi. 1998; Wu & Evans. 2003; Wu et al. 2005; Fuller, Williams, & Sridharan. 2005; Wyrowski 2006; Wu et al. 2007; Birkmann et al. 2007; Klaassen & Wilson 2007; Sun & Gao 2008; Velusamy et al. 2008). The core is also associated with a near-infrared point source, corresponding to a star of 6-11 (Zhu et al.2010, submitted). Carolan et al. (2009) observed sixteen different molecular line transitions including CO, HCN, HCO+ and their isotopes in this region, and modeled the source with a chemically depleted rotating envelope collapsing onto a central protostellar source which has evolved sufficiently to generate a molecular outflow. All the evidence suggests that JCMT 18354-0649S is forming high mass protostellar object(s)(HMPO). However, single-dish observations with a resolution of can not reveal detailed kinematics in the core at a distance as large as 5.7 kpc. In this paper we report the results of a high resolution study with the Submillimeter Array (SMA111Submillimeter Array is a joint project between the Smithsonian Astrophysical Observatory and the Academia Sinica Institute of Astronomy and Astrophysics and is funded by the Smithsonian Institution and the Academia Sinica.) in order to probe the details of the core and its kinematic features. The observation and initial results are presented in sections 2 and 3. Properties of infall and outflow motions are discussed further in section 4, and a brief summary is given in section 5.
2 Observations
The observations of JCMT 18354-0649S was carried out with the SMA in July 2005 with seven antennas in its compact configuration and in September 2005 with six antennas in its extended configuration. The 345 GHz receivers were tuned to 265 GHz for the lower sideband (LSB) and 275 GHz for the upper sideband (USB). The frequency spacing across the spectral band is 0.8125 MHz or 1 km s-1 for both configurations. The phase reference center of both observations was R.A.(J2000) = 18h38m08.10s and DEC.(J2000) = -.
In the observations with the compact configuration, Jupiter, Uranus and QSO 3c454.3 were observed for antenna-based bandpass correction. An amplitude offset was found on some baselines and the baseline-based errors in bandpass were further corrected using the point source QSO 3c454.3. QSOs 1741-038 and 1908-201 were employed for antenna-based gain correction. Uranus was observed for flux-density calibration. The synthesized beam size is (PA=-54).
For the extended configuration, QSO 3c454.3 was used as bandpass calibrator, QSOs 1741-038 and 1908-201 as gain calibrators, and Uranus as a flux calibrator, respectively. The synthesized beam size is about .
Miriad222http://carma.astro.umd.edu/miriad was employed for calibration and imaging. The 1.3 mm continuum data were acquired by averaging all the line-free channels over both the 2 GHz of upper and lower spectral bands. MIRIAD task ”selfcal” was employed to perform self-calibration on the continuum data. Since the dust emission is weak, self-calibration with phase only was performed. The gain solutions from the self-calibration were applied to the line data.
The continuum data combined from both configurations yield a synthesized beam of (PA=-81.4), and 1 rms of 2.5 mJy in the naturally weighted maps. HCN (3-2) and CH3OH (–) were detected in the compact configuration.
The shortest baseline in compact configuration observations is 16.5 m, corresponding to a spatial scale of . Spatial structures more extended than this limit, such as HCN maps close to the cloud velocity, would be filtered out. HCN (3–2) data in JCMT archive (Wu et al. 2005; Carolan et al. 2009) were used to recover the missing flux. The JCMT archive data were reduced using the KAPPA and GAIA packages in the STARLINK suite. The JCMT beam size for HCN (3–2) was , and the main beam efficiency was 0.69. The combination of the SMA compact and JCMT HCN (3–2) data was done using the task ”immerge” in MIRIAD.
3 Results
3.1 Dust core
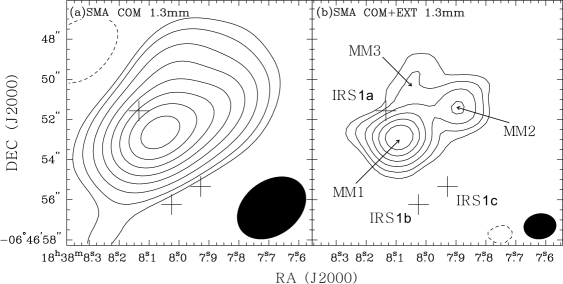
The 1.3 mm continuum images are shown in Fig.1. The left panel is obtained in the compact array and the right panel from the combined data of the compact and extended configurations. An elongated core is revealed with the 1.3 mm continuum emission observed with the compact array, and is further resolved into three condensations by the continuum emission using the combined data from both configurations. The three condensations are named as MM1, MM2 and MM3. The peak position of MM1 is R.A.(J2000)=, DEC.(J2000)=. MM2 peaks at R.A.(J2000)=, DEC.(J2000)=, and MM3 peaks at R.A.(J2000)=, DEC.(J2000)=.
From the fit of an elliptical Gaussian, the core revealed by the compact array is found to be elongated from south-east to north-west. It has an average FWHM diameter of 0.06 pc () at a distance of 5.7 kpc, smaller than the beam size of the compact configuration. The total integrated flux is 0.47 Jy. The total dust and gas mass can be obtained with the formula , where is the flux at 1.3 mm, D is the distance, and is the Planck function. We adopt a dust opacity = cm2g-1 at 1.3 mm calculated from Ossenkopf & Henning (1994) with a dust opacity index . Here the ratio of gas to dust is taken as 100. Molecular line CH3OH (–) is detected, and its emission peak coincides with the dust core very well (see Sec.3.2). The upper energy level of the CH3OH (–) line is 57 K above the ground, indicating a relatively warm conditions. Assuming =57 K, a total dust and gas mass of is derived. A beam-average gas/dust density amounts to cm-3, which is larger than cm-3 obtained from single-dish telescope (Wu et al. 2005).
The three condensations (MM1, MM2 and MM3) have total integrated flux of 0.42 Jy, leading to a total mass of (assuming Td = 57 K as above). MM1 has a diameter of 0.02 pc, and a mass of . MM1 is centrally concentrated and compact, while MM2 and MM3 are much more diffuse and extended.
With UKIRT (United Kingdom Infrared Telescope) Zhu et al. (2010, in preparation) detected three near-infrared sources IRS1a, IRS1b, IRS1c in H, K and L bands. Their positions are marked with crosses in Fig.1. IRS1a (, ) lies about north-east of MM1. IRS1b (, ) and IRS1c (, ) are about southwest from MM1 and are much fainter.
3.2 Gas core
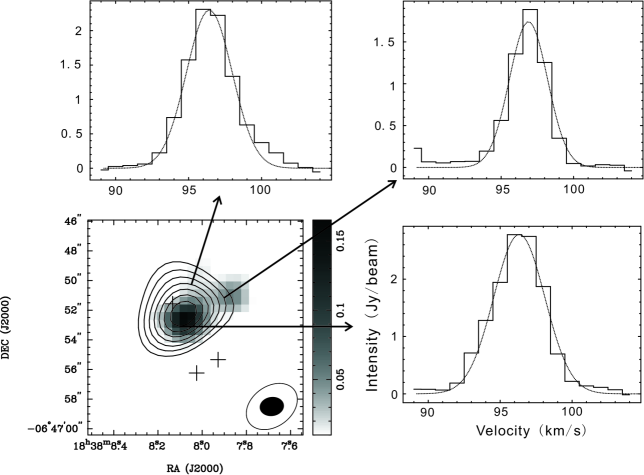
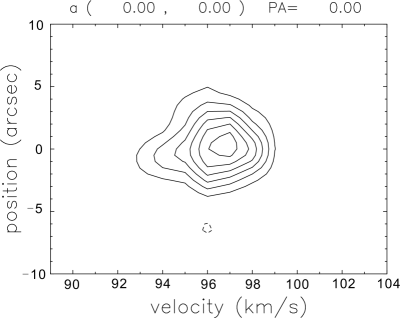
The molecular line CH3OH (–) is detected in the compact configuration. Fig.2 presents its spectrum at three positions and the integrated emission overlaid on the 1.3 mm continuum image. The central velocity of the CH3OH (–) spectra is 96.7 km s-1, which is taken as the systemic velocity of the core. The central velocity of CH3OH (–) does not shift at different positions (see Fig.2), which should exclude rotation at the core. The P-V diagram of CH3OH (–) is shown in Fig.3, indicating a compact gas core without rotation. The emission center of CH3OH (–) (R.A.(J2000)=, DEC.(J2000)=) coincides with MM1 very well. While there are no CH3OH components corresponding with MM2 and MM3. The deconvolved size of the gas core revealed by CH3OH (–) is (PA=-29), comparable to the synthesized beam size of the compact array.
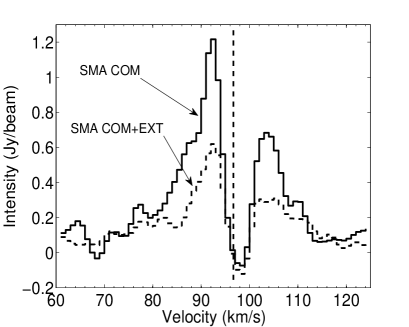
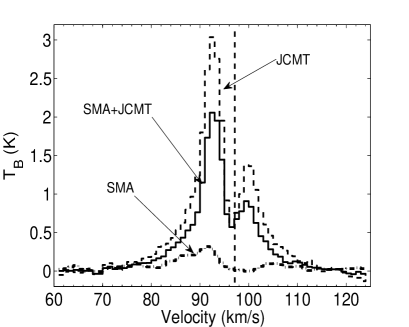
The HCN (3–2) (265.886GHz) spectra obtained from the SMA compact configuration and from the data combined from both compact and extended configurations are presented in the left panel of Fig.4. Both of the two spectra are averaged over a region of , which show a redshifted absorption dip and broad wings. The line profiles observed with the SMA and JCMT, as well as a combination of the two are presented in the right panel of Fig.4. All the spectra in the right panel of Fig.4 are convolved with the JCMT beam () for comparing. One can see that the SMA compact array observations recover less than 10 of JCMT flux around the systematic velocity, but recover more than 30 flux at the wings. The combination of the SMA and JCMT data recovers more than 70 of the JCMT flux at all the velocity channels.
3.3 Kinematic signatures of lines
3.3.1 Infall motion
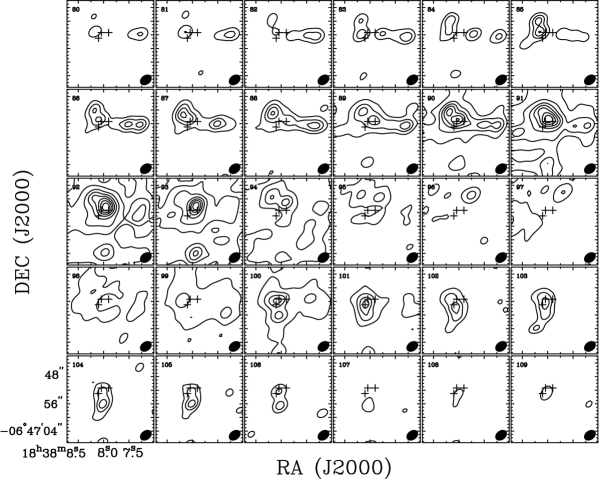
The left panel of Fig.4 shows the most prominent feature (”blue profile”) of the HCN (3–2) line at the core. The absorption gap is more than 8 km s-1 wide, ranging from 93 to 101 km s-1. Fig.5 presents the channel maps of the HCN (3–2) emission from 80 km s-1 to 109 km s-1 constructed from the combined data, which is convolved with the beam of the SMA compact configuration. The absorption is obvious in the velocity range (95,99) km s-1. The absorption dip is also clearly seen in the P-V diagrams (see Fig.6), which is much deeper than that revealed by the single-dish observation (Wu et al. 2005).
From the left panel of Fig.4, it is clearly to see that the centeral velocity of the absorption dip (98 km s-1) is redshifted from the systematic velocity (96.7 km s-1) by 1.3 km s-1. Such a blue asymmetric line profile where the blue emission peak is at a higher intensity than the red one is a collapse signature of molecular cores (Zhou et al. 1993). The spectra constructed from JCMT data and the combined data (the right panel of Fig.4) also show significant ”blue profile”, confirming the existence of infall motions.
3.3.2 Molecular outflow
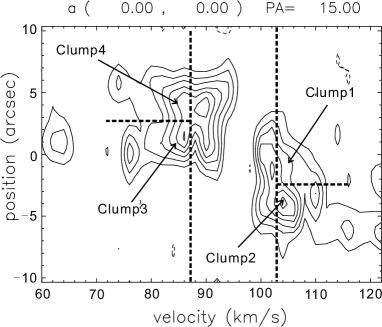
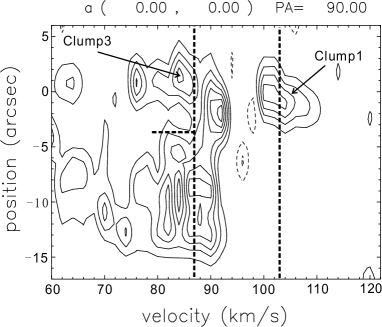
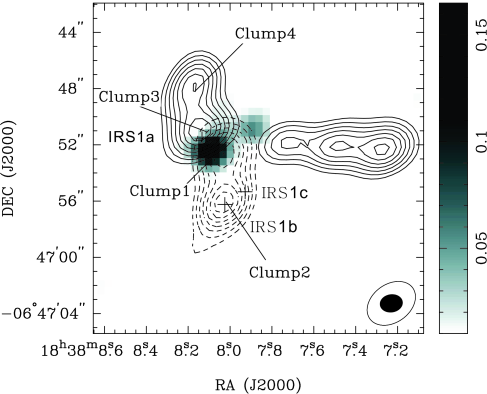
Besides the absorption dip, the HCN (3–2) line exhibits remarkable broad wings extending more than 40 km s-1. High-velocity gas also can be easily identified in P-V diagrams of the HCN (3–2) emission along the direction of P.A.=15 and P.A.=90 as shown in Fig.6. The HCN (3–2) emission obtained from SMA compact configuration is integrated from 80 to 87 km s-1 for the blue lobe and from 103 to 109 km s-1 for the red lobe, respectively. The contour map of the integrated flux are shown in Fig.7. As in the channel maps (Fig.5), we can see several clumps in each lobe in the integrated map. The integrated HCN (3–2) emission seems to comprise an S-shaped structure from north-east to south. Another jet-like structure extended more than is also seen at the west of the continuum emission center. IRS1a seems to be the driving source of the outflow.
The southern redshifted lobe (S-lobe) comprises two clumps named ”Clump1” and ”Clump2”. In the north-east blueshifted lobe (NE-lobe), two clumps are also found and named ”Clump3” and ”Clump4”. These clumps are distributed along the direction of the outflow and likely to be outward gas knots. They are probably not physically related with other stellar sources except the driving source though Clump2 is close to IRS1b and IRS1c.
4 Discussion
4.1 Infall motion
Although the HCN emission is extended over a region larger than the compact configuration beam, the infall region is still difficult to confine due to the contamination of the outflow. Since the size of the gas core traced by CH3OH (–) is comparable to the compact configuration beam size, the beam size of the compact configuration was taken as the radius () of the infall region (Wu et al. 2009). The kinematic mass infall rate can be calculated using dM/dt=, where , , and n= cm-3 are the infall velocity, the mean molecular weight, the H2 mass, and the beam-average gas/dust density, respectively. The infall velocity is 1.3 km s-1 by comparing the systemic velocity (96.7 km s-1) and the velocity of the redshifted absorbing dip (98 km s-1) in the HCN (3-2) spectrum (Welch et al. 1987), leading to a kinematic mass infall rate of 2.0yr-1. In core G10.6-0.4, the redshifted NH3 indicates large infall velocity km s-1 at about 0.05 pc, and a mass infall rate as high as 5yr-1 (Keto, Ho & Haschick. 1987). Also with NH3 inverse lines, Zhang & Ho (1997) obtained a high infall velocity km s-1 within a region smaller than 0.02 pc towards core W51e2. Large infall velocities ( km s-1) and mass infall rates (yr-1) were also detected towards G10.47 and G34.26 with HCO+ (4–3) line (Klaassen & Wilson 2007). In core G19.61+0.23, an infall velocity of 2.5 km s-1 and a mass infall rate as high as yr-1 were derived (Wu et al. 2009). It seems high mass infall rate is required by high-mass star formation. The results of the core JCMT 18354-0649S are comparable with those of the above sources. For comparison, the from pure free-infall assumption is also derived with the formula . The pure free-infall velocity inferred is 2.9 km s-1, larger than the infall velocity obtained from the spectrum.
Wu et al. (2005) obtained a small infall velocity () at a radius of 4. The absorption dip of HCN (3–2) line seen by the SMA is much deeper and broader than that observed by JCMT. However, the kinematic mass infall rate ( yr-1) obtained here is well coincident with that obtained with JCMT (Wu et al. 2005), yr-1.
4.2 Properties of HCN (3-2) outflow
The column density of HCN at each velocity channel in each outflow lobe can be obtained through (Garden et al. 1991):
| (1) |
Where is the central velocity of the channel relative to the systemic velocity, the rotational constant B=44.315976 GHz and permanent dipole moment debye for HCN, the velocity channel width is smoothed to be . Assuming HCN emission in the line wings to be optically thin and excitation temperature of Tex=30 K (Wu et al. 2004), the optical depth can be derived with the equation:
| (2) |
where is the excess brightness temperature of HCN(3–2) emission at . Adopting (Carolan et al. 2009), the mass of each lobe at can be calculated with:
| (3) |
where D, are the cloud distance and the solid angle. Thus the total mass of each lobe is given by , the total momentum by , and the energy by . The dynamical timescale is estimated as , where R is the outflow extent, and is the maximum velocity of the outflow lobe. The mechanical luminosity L, and the mass-loss rate are calculated as L=E/t, ), where the wind velocity is assumed to be 500 km s-1 (Lamers et al. 1995). The derived parameters are listed in Table.1. The total mass, momentum, energy of the three lobes are 12 , 121 km s-1 and erg, respectively. The average dynamical timescale is about yr, and the total mass-loss rate yr-1. The outflow is massive with parameters similar to that of IRAS 05274+3345E and the other outflows detected towards five massive star formation regions (Zhang et al. 2007b; Klaassen & Wilson 2008).
The Position-Velocity diagram at the left panel of Fig.6 shows that at low velocities, the NE-lobe and S-lobe both have compact morphology near the core center. At higher velocities the southern lobe becomes further away from the center. As shown in Fig.7, the outflow axis traced by Clump1 and Clump2 differs from that traced by Clump3 and Clump4. The different outflow orientations in the large and small scales may be attributed to the precession of the outflow axis (Su et al. 2007). From the right panel of the P-V diagram, a high-velocity component (V 85 km s-1) with velocities decreasing with distance from the protostar, and a second component tracing the low-velocity material (V 85 km s-1) extending about along the axis of the W-lobe are clearly seen. Such convex spur PV structure was also revealed in a simulation of a pulsed jet driven outflow (Lee et al. 2001).
4.3 HCN — tracer of both inflow and outflow motions
HCN is among the most abundant molecular species with a high critical density larger than cm-3 (for HCN (1–0)) (Carolan et al. 2009), and is believed to trace dense molecular cores. HCN is detected in both low mass class 0 and I sources (Park, Kim, & Ming. 1999; Yun et al. 1999), and high-mass hot cores (Boonman et al. 2001).
HCN is thought as a good tracer of inflow motions (Wu & Evans. 2003). The infall asymmetry in the HCN spectra is found to be more prevalent, and more prominent than in any other previously used infall tracers such as CS (2–1), DCO+ (2–1), and N2H+(1–0) during a survey toward 85 starless cores (Sohn et al. 2007). Among the small group of pre- and protostellar objects in L1251B, infall signature was also detected in the HCN emission (Lee et al. 2007). HCN also traces inflow motions very well in massive star-formation regions. Wu and Evans. (2003) found 12 sources showing ”blue profile” in the HCN lines during a spectroscopic survey of 28 massive cores with water maser. Besides HCN, other nitrogen bearing molecules such as N2H+ are also tracers of inflow motions (Tsamis et al. 2008; Schnee et al. 2007; Crapsi et al. 2005). Recently inverse P Cygni profile of CN line in hot cores was found (Zapata et al. 2008; Wu et al. 2009). These results suggest nitrogen bearing molecular species be good tracers of inflowing motions in star-formation regions.
Outflows traced by HCN are often detected not only in low-mass star-formation regions but also in massive star-formation regions (Bachiller, Gutiérrez, & Pérez. 1997; Choi 2001; Su et al. 2007; Zhang et al. 2007a). HCN outflow of the core JCMT 18454-0649S is another good sample. Additionally, Zhu et al. (2010 in preparation) and Cyganowski (2008) found excess emission at 4.5 at the position of source IRS1a, which is close to the center of the NE-lobe and S-lobe. Such excess emission at the 4.5 band could be shock-excited. In IRAS 20126+4104, HCN emission is also found to be closely related to the shock-excited near-IR H2 knots and was identified to be associated with shock wings (Su et al. 2007). The inner clumps (Clump1 in the S-lobe and Clump3 in the NE-lobe) of the core JCMT 18354-0649S should also be coincident with shocks. In fact, models have already demonstrated a dramatic increase of HCN molecules, during the intense interaction between outflow and ambient gas, or slow shock front (Mitchell 1984; Nejad, Williams, & Charnley. 1990). In this process sulfur and nitrogen react with hydrocarbons to produce various compounds, wherein HCN abundance gets higher than the rest of the products (Nejad, Williams, & Charnley. 1990). Thus HCN may trace the outflow even better than sulfur containing molecules.
5 Summary
Both dust continuum at 1.3 mm and CH3OH emission detected with SMA reveal a compact core in JCMT 18354-0649S. The core observed with the compact configuration has a mass of and an average density of cm-3. With the combination of the compact and extended configurations, the core is resolved to three condensations with a total mass of .
HCN (3-2) spectra exhibit an infall signature in this region. The red shifted absorption seen in the SMA observation is deeper and broader than that in the JCMT observation. The infall rate is yr-1. High velocity gas is detected in HCN (3-2) emission. The outflow has three lobes and their total mass is 12 and momentum of 121 km s-1. The average dynamical timescale and the total mass-loss rate are about yr and yr-1, respectively. All the findings indicate a high-mass protostar is forming via rapid accretion. Our results suggest that nitrogen bearing molecules especially HCN are good for probing both infall and outflows.
Acknowledgment
References
- Arce et al. (2007) Arce, H. G., Shepherd, D., Gueth, F., Lee, C.-F., Bachiller, R., Rosen, A., Beuther, H., 2007, arXiv:astro-ph/0603071
- Bachiller, Gutiérrez, & Pérez. (1997) Bachiller, R., Gutiérrez, M., & Pérez. 1997, ApJ, 487, L93
- Beuther, Schilke, & Menten. (2002) Beuther, H., Schilke, P., & Menten, K. M. 2002, ApJ, 566, 945
- Birkmann et al. (2007) Birkmann, S. M., Krause, O., Hennemann, M., Henning, Th., Steinacker, J., Lemke, D. 2007, A&A, 474, 883
- Bonnell, Bate, & Zinnecker. (1998) Bonnell, I. A., Bate, M. R., & Zinnecker, H. 1998, MNRAS, 298, 93
- Boonman et al. (2001) Boonman, A. M. S., Stark, R., Van der tak, F. F. S., Van dishoeck, E. F., Van der wal, P. B., Scháfer F., De lange, G., & Laauwen, W. M. 2001, ApJ, 553, L63
- Carolan et al. (2009) Carolan, P. B., Khanzadyan, T., Redman, M. P., Thompson, M. A., Jones, P. A., Cunningham, M. R., Loughnane, R. M., Bains, I., Keto, E. 2009, MNRAS, 400, 78
- Choi (2001) Choi, Minho. 2001, ApJ, 553, 219
- Churchwell (2002) Churchwell, E. 2002, ARA&A, 40, 27
- Crapsi et al. (2005) Crapsi, A., Caselli, P., Walmsley, C., M., Myers, P., C., Tafalla, M., Lee, C., W., Bourke, T., L. 2005, ApJ, 619,379
- Cyganowski (2008) Cyganowski, C. J. et al. 2008, AJ, 136, 2391
- Fuller, Williams, & Sridharan. (2005) Fuller, G. A., Williams, S. J., & Sridharan, T. K. 2005, A&A, 442, 949
- Garden et al. (1991) Garden, R. P., Hayashi, M., Gatley, I., Hasegawa, T., & Kaifu, N. 1991, ApJ, 374, 540
- Keto, Ho & Haschick. (1987) Keto, E. R., Ho, P. T. P., & Haschick, A. D. 1987, apj, 318, 712
- Keto, Ho & Haschick. (1988) Keto, E. R., Ho, P. T. P., & Haschick, A. D. 1988, ApJ. 324, 920
- Klaassen & Wilson (2007) Klaassen, P. D. & Wilson, C. D. 2007, ApJ, 663, 1092
- Klaassen & Wilson (2008) Klaassen, P. D., & Wilson, C. D. 2008, ApJ, 684, 1273
- Lamers et al. (1995) Lamers, H. J. G. L. M., Snow, T. P., Lindholm, D. M. 1995, ApJ, 455, 269
- Lee et al. (2001) Lee, C.-F., Stone, J. M., Ostriker, E. C., & Mundy, L. G. 2001, ApJ, 557, 429
- Lee et al. (2007) Lee, J.-E., Di Francesco, J., Bourke, T. L., Evans, N. J. II & Wu, J. 2007, ApJ, 671, 1748
- Lester et al. (1985) Lester, D. F., Dinerstein, H. L., Werner, M. W., Harver, P. M., Evans, N. J. II, Brown, R. L. 1985, ApJ, 296, 565L
- Mitchell (1984) Mitchell, G. F. 1984, ApJ, 287, 665
- Molinari et al. (1996) Molinari, S., Brand, J., Cesaroni, R., Palla, F. 1996, A&A, 308, 573
- Molinari et al. (2000) Molinari, S., Brand, J., Cesaroni, R., & Palla, F. 2000, A&A, 355, 617
- Motoyama & Yoshida (2003) Motoyama, K., & Yoshida T. 2003, MNRAS, 344, 461
- Myers et al. (1996) Myers, P. C., Mardones, D., Tafalla, M., Williams, J. P. & Wilner, D. J. 1996, ApJ, 465, L133
- Nejad, Williams, & Charnley. (1990) Nejad, L. A. M., Williams, D. A., & Charnley, S. B. 1990, MNRAS, 246, 183
- Ossenkopf & Henning (1994) Ossenkopf, V., Henning, Th. 1994, A&A, 291, 943
- Park, Kim, & Ming. (1999) Park, Y. S., Kim, J., & Ming Y. C. 1999, ApJ, 520, 223
- Schnee et al. (2007) Schnee, S., Caselli, P., Goodman, A., Arce, H. G., Ballesteros-Paredes, J., Kuchibhotla, K. 2007, ApJ, 671, 1839
- Shu (1977) Shu, F. H. 1977, ApJ, 214, 488
- Shu, Adams, & Lizano (1987) Shu, F. H., Adams, F. C., & Lizano, S. 1987, ARA&A, 25, 23
- Sohn et al. (2007) Sohn, J. J., Lee, C. W., Park, Y.-S., Lee, H. M., Myers, P. C., & Lee Y. 2007, ApJ, 664,928
- Sridharan et al. (2002) Sridharan, T. K., Beuther, H., Schilke, P., Menten, K. M., Wyrowski, F. 2002, ApJ, 566, 931
- Su et al. (2007) Su, Y.-N., Liu, S.-Y., Chen, H.-R., Zhang, Q., Cesaroni, R. 2007, ApJ, 671,571
- Sun & Gao (2008) Sun, Y., & Gao, Y. 2008, MNRAS, 392, 170
- Tsamis et al. (2008) Tsamis, Y. G., Rawlings, J. M. C., Yates, J. A., Viti, S. 2008, MNRAS, 388, 898
- Velusamy et al. (2008) Velusamy, T., Peng, R., Li, D., Goldsmith, P. F., Langer, William D. 2008, ApJ, 688, L87
- Welch et al. (1987) Welch, Wm. J., Dreher, J. W., Jackson, J. M., Terebey, S., Vogel, S. N. 1987, Science, 238, 1550
- Wolfire & Cassinelli (1987) Wolfire, M. G. & Cassinelli, J. P. 1987, ApJ, 319, 850
- Wu & Evans. (2003) Wu, J., Evans N. J. II. 2003, ApJ, 592, L79
- Wu et al. (2004) Wu, Y., Wei, Y., Zhao, M., Shi, Y., Yu, W., Qin, S., Huang, M. 2004, A&A, 426, 503
- Wu et al. (2005) Wu, Y., Zhu, M., Wei, Y., Xu, D., Zhang, Q., & Fiege, J. D. 2005, ApJ, 628, L57
- Wu et al. (2006) Wu, Y., Zhang, Q., Yu, W., Miller, M., Mao, R., Sun, K., & Wang, Y. 2006, A&A, 450, 607
- Wu et al. (2007) Wu, Y., Henkel, C., Xue, R., Guan, X., Miller, M. 2007, ApJ, 669, L37
- Wu et al. (2009) Wu, Y., Qin, S.-L., Guan, X., Xue, R., Ren, Z., Liu, T., Huang, M., Chen, S. 2009, ApJ, 697, L116
- Wyrowski (2006) Wyrowski, F., Heyminck, S., Gsten, R., Menten, K. M. 2006, A&A, 454, L95
- Yun et al. (1999) Yun, J. L., Moreira, M. C., Afosso, J. M. & Clemens, D. P. 1999, ApJ, 118, 990
- Zapata et al. (2008) Zapata, L. A., Palau, A., Ho, P. T. P., Schilke1, P., Garrod, R. T., Rodr guez, L. F., & Menten, K. 2008, A&A, 479, L25
- Zhang & Ho (1997) Zhang, Q., & Ho, P. T. P. 1997, ApJ, 488,241
- Zhang, Ho, & Ohashi. (1998) Zhang, Q., Ho, P. T. P., & Ohashi, N. 1998, ApJ, 494, 636
- Zhang et al. (2007a) Zhang, Q., Sridharan, T. K., Hunter, T. R., Chen, Y.; Beuther, H., Wyrowski, F. 2007a, A&A, 470, 269
- Zhang et al. (2007b) Zhang, Q., Sridharan, T. K., Hunter, T. R., Chen, T., Beuther, H., & Wyrowski, F. 2007b, ApJ, 658, 1152
- Zhou et al. (1993) Zhou, S., Evans, N. J. II., Koempe, C., Walmsley, C. M. 1993, ApJ, 404, 232
| outflow | Vmax | Mass | momentum | Energy | |||
|---|---|---|---|---|---|---|---|
| km s-1 | (10) | () | ( km s-1) | (10) | () | ( yr-1) | |
| southern lobe | 11.7 | 1.4 | 3.3 | 29 | 3.0 | 1.8 | 4.0 |
| north-eastern lobe | 15.3 | 1.0 | 4.2 | 42 | 4.5 | 3.6 | 8.0 |
| western lobe | 15.3 | 2.3 | 4.6 | 50 | 5.5 | 2.1 | 4.0 |