Particle size dependence of magnetization and non-centrosymmetry in nanoscale BiFeO3
Abstract
The saturation magnetization (MS), antiferromagnetic transition point (TN), and the off-center displacements of Bi and Fe ions have been measured as a function of particle size in nanoscale BiFeO3. TN decreases down to 550 K for particles of size 5 nm from 653 K in bulk while MS rises by more than an order of magnitude. Analysis of crystallographic structure from Rietveld refinement of x-ray diffraction patterns shows significant rise in off-center displacements of Bi () and Fe () ions within a unit cell with the decrease in particle size. The net unit-cell polarization PS too, is found to be larger in nanoscale regime.
pacs:
75.80+q, 75.75.+a, 77.80.-eI Introduction
Extensive research work has been done on BiFeO3 over the decades because of its magnetoelectric multiferroicity at room temperature.Schmid The linear magnetoelectric coupling originates from striction mediated interaction between polar and magnetic domains.Lee The bulk BiFeO3 is G-type antiferromagnetic with a spiral of long period ( 62 nm). Therefore, the magnetostriction is weak which, in turn, gives rise to weak coupling. The electric polarization is also small (5-6 C/cm2) in bulk.Teague It improves (55 C/cm2) in thin films due to the strain between substrate and film.Wang Large polarization and magnetization will render BiFeO3 quite useful as a single phase multiferroic compound. In this paper, we show that it is possible to achieve both the aspects - large polarization and magnetization - in nanoscale BiFeO3 (5-50 nm). We found that intrinsic ferromagnetism develops in nanoscale BiFeO3 with rise in saturation magnetization MS, decrease in antiferromagnetic transition point TN, and increase in coercive field HC. We also found that the unit-cell off-center displacements of Bi and Fe ions - which render BiFeO3 ferroelectric - increases monotonically with the decrease in particle size. The net unit-cell polarization PS too, is found be higher in nano-sized particles.
II Experiments
The experiments were carried out on both bulk and nano-sized particles of BiFeO3. The nanoparticles of BiFeO3 have been synthesized by sonochemical process where coprecipitation takes place from mixed aqueous solution of metal nitrates within a suitable medium in presence of ultrasonic vibration. The precipitate was washed in alcohol and dried. Finally, the product was calcined at 350o-450oC for 2-6h. The sonochemical process was shown to yield nanosized particles of various oxide compounds in the past. We have separated out finer particles by a centrifuge running at different speeds - 10000, 12000, and 15000 rpm. The variation of heat-treatment temperature and time also yields particles of different sizes. In order to synthesize the bulk sample, the calcined powder was compacted in the form of pellets and sintered at 830oC for 5-10h. The average grain size in the sintered pellet was 0.1m.
The samples have been characterized by studying the x-ray diffraction (XRD) patterns at room temperature and from the transmission electron microscopy (TEM) and high resolution TEM. The electrical resistivity and magnetic measurements were carried out across a temperature range 300-900 K. The resistivity of the particles was measured by depositing a coating of the particles on an alumina substrate with gold electrodes printed on it. The XRD patterns were refined by Fullprof (ver 2.3) to determine the structural parameters such as space group, lattice parameters, crystallite size, strain, atom positions, bond lengths and angles etc. The off-center displacements of Bi3+ () and Fe3+ () ions have also been calculated as a function of particle size.
III Results and Discussion
The average size of the nanoscale BiFeO3 particles varies from to 50 nm. In Fig. 1, we show a representative TEM photograph. The average size was estimated by image analyzer software Image-J. It is compared with the crystallite size estimated from the Rietveld refinement of x-ray diffraction patterns. Both the results corroborate each other.

| Samples |
Lattice
parameters |
Atoms | Positions | x | y | z | Bonds | length | Bonds | angle | microstrain | |
|---|---|---|---|---|---|---|---|---|---|---|---|---|
|
BiFeO3
-bulk |
a = 5.578
c = 13.868 |
Bi
Fe O |
6a
6a 18b |
0.0
0.0 0.4346 |
0.0
0.0 0.0121 |
0.0
0.2198 -0.0468 |
Bi-O
Fe-O Fe-O |
2.309
1.949 2.118 |
Fe-O-Fe
O-Bi-O |
154.05o
73.88o |
0.015 | 22.6 |
|
BiFeO3
- 25 nm |
a = 5.573
c = 13.849 |
Bi
Fe O |
6a
6a 18b |
0.0
0.0 0.4715 |
0.0
0.0 0.0119 |
0.0
0.22324 -0.0622 |
Bi-O
Fe-O Fe-O |
2.130
1.804 2.269 |
Fe-O-Fe
O-Bi-O |
152.76o
78.93o |
0.029 | 6.68 |
|
BiFeO3
- 22 nm |
a = 5.579
c = 13.870 |
Bi
Fe O |
6a
6a 18b |
0.0
0.0 0.4455 |
0.0
0.0 0.03123 |
0.0
0.2256 -0.05351 |
Bi-O
Bi-O Fe-O Fe-O |
2.179
2.515 1.955 2.172 |
Fe-O-Fe
O-Bi-O |
147.77o
73.84o |
0.049 | 11.7 |
|
BiFeO3
- 19 nm |
a = 5.624
c = 13.672 |
Bi
Fe O |
6a
6a 18b |
0.0
0.0 0.3712 |
0.0
0.0 -0.0898 |
0.0
0.2285 0.00216 |
Bi-O
Bi-O Fe-O Fe-O |
2.381
2.586 1.941 2.267 |
Fe-O-Fe
O-Bi-O |
140.91o
85.17o |
0.105 | 15.8 |
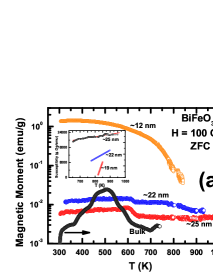
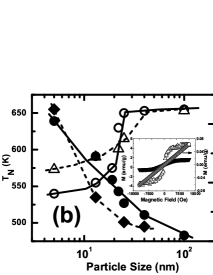
The magnetic measurements were carried out in zero-field cooled mode across 300-900 K under an applied field 100 Oe. In Fig. 2a, we show the magnetization versus temperature plot for a few representative samples. Quite evident is the monotonic increase in magnetization with the decrease in particle size. This observation corroborates earlier observations by us as well as by other authors.Mazumder ,Park Interestingly, the antiferromagnetic transition point TN drops significantly with the decrease in particle size: from 653 K in bulk to 550 K in particles of average size 5 nm. Dc electrical resistance has also been measured across 300-800 K. Around TN, a distinct feature in the resistance versus temperature plot could be noticed (data not shown here). TN was thus estimated both from the magnetic and electrical measurements. In Fig. 2b, the TN versus particle size plot is shown. There is a certain discrepancy between TN estimated from magnetic and electrical measurements, especially, in finer particle regime. This could result from progressive broadening of the transition zone. We have carried out Curie-Weiss fitting of the magnetization data in the paramagnetic regime (Fig. 2a inset). With the decrease in particle size, the Weiss constant appears to be switching from negative (signaling antiferromagnetic order) to positive (marking ferromagnetism) regime. The degree of frustration f = /TN increases from 1.0 to 1.4 with the decrease in particle size. This could be because of enhanced geometry-driven frustration in spin ordering within near neighbors in finer particles. This has been observed in nanosized ferromagnetic particles by others as well.Guimaraes The Curie constant C yields the magnetization to be varying within 0.108-0.452 /Fe for particle size varying within 5-50 nm. For the bulk system, the magnetization is 0.02 /Fe. The room temperature saturation magnetization MS and coercivity HC are plotted as a function of particle size in Fig. 2b. The intrinsic ferromagnetism in nanoscale BiFeO3 results fromMazumder (i) incomplete spiral of magnetic order in particles of size less than 62 nm, and (ii) enhanced strain of the nano-crystals.
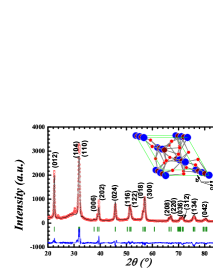

The XRD patterns have been refined by Fullprof (ver 2.3) to find out the dependence of non-centrosymmetry of the crystallographic structure on particle size. In BiFeO3, the ferroelectric polarization develops primarily because of covalency in Bi-O bonds resulting from Bi3+ 6s2 lone pair and consequent off-center displacement of Bi3+ ions with respect to the near-neighbor oxygen network. Interestingly, the Fe3+ ions too occupy non-centrosymmetric positions in spite of Jahn-Teller distortion within Fe3+O6 octahedra. In Fig. 3a, we show the experimental and refined x-ray diffraction patterns for a representative case (22 nm particle). Following points could be noted in the evolution of the patterns: (i) space group changes from Rc in bulk to lower symmetric R3c in the nanoscale samples; (ii) the strain increases with the decrease in particle size; (iii) the lattice parameters and volume change systematically with particle size. In Table-I, we provide the list of structural parameters as a function of particle size: (i) lattice parameters, (ii) atom positions, (iii) bond lengths and angles within a unit cell, and (iv) lattice strain. The weighted reliability factor Rwp which defines the goodness of fit between experimental and refined XRD patterns is also shown.
We estimated the off-center displacements of Fe3+ and Bi3+ ions within a unit cell of BiFeO3 from the atom position data. In bulk sintered pellet, the and are 1.235 and 0.229 , respectively. Remarkably, both and exhibit monotonic rise as the particle size is reduced (Fig. 3b).Selbach Interestingly, in contrast to the results in Ref. 8, we found that while results in polarization along [111]rh [001]hex axis, is oriented in a different direction which gives polarization along all three directions. Using the and the component of along [111]rh [001]hex, we estimated the polarization PS in a unit cell following the procedure described in Ref. 9. PS is plotted in Fig. 3b as a function particle size. It shows that the resultant PS of a unit cell increases substantially in nanoscale regime around 28 nm. It decreases with further decrease in particle size and eventually stabilizes at a value which is much higher than what has been observed in bulk sample Teague or even in thin films. Wang This is the central result of this paper. Of course, the large unit cell polarization may not yield large ferroelectric polarization for the entire nanoparticle. This is because of the depolarization originated from surface effects (dead layer) of a nanoparticlePetkov . It is necessary to design an appropriate electrode-nanoparticle architecture to cancel out the depolarizing field and thus observe large polarization even across an entire nano-sized particle.
IV Conclusion
We observe significant improvement in unit cell polarization in nanoscale BiFeO3. Both the off-center displacements of Bi3+ and Fe3+ ions increase monotonically with the decrease in particle size. The nanosized particles also exhibit intrinsic ferromagnetic order. Large magnetostriction resulting from ferromagnetism, possibly, gives rise to striction mediated enhanced ferroelectric polarization in a unit cell. Large ferroelectric polarization and ferromagnetism in nanosized particles will render nanoscale BiFeO3 even more useful than the bulk system for magnetoelectric device applications.
Acknowledgments. This work is supported by a Networked research program of CSIR ”Nanostructured Advanced Materials” (NWP051). The authors thank J. Ghosh for x-ray diffraction measurements and P.A. Joy for magnetic measurements.
References
- (1) H. Schmid, Ferroelectrics 162, 317 (1994); G. Catalan and J.F. Scott, Adv. Mater. 21, 2463 (2009).
- (2) S. Lee et al., Nature (London)451, 805 (2008).
- (3) J.R. Teague, R. Gerson, and W.J. James, Solid State Commun. 8, 1073 (1970); Y.P. Wang et al., Appl. Phys. Lett. 84, 1731 (2004).
- (4) J. Wang et al., Science 299, 1719 (2003); Y. K. Yun, M. Noda, M. Okuyama, H. Saeki, H. Tabata, and K. Saito, J. Appl. Phys. 96, 3399 (2004).
- (5) R. Mazumder et al., Appl. Phys. Lett. 91, 062510 (2007).
- (6) T.-J. Park, G.C. Papaefthymiou, A.J. Viescas, A.R. Moodenbough, and S.S. Wong, Nano Lett. 7, 766 (2007).
- (7) See, for example, A.P. Guimaraes, Principles of Nanomagnetism (Springer, New York, 2009).
- (8) S.M. Selbach, T. Tybell, M-A. Einarsrud, and T. Grande, Chem. Mater. 19, 6478 (2007).
- (9) S.C. Abrahams, S.K. Kurtz, and P.B. Jamieson, Phys. Rev. 172, 551 (1968); see also, C-L Ja et al., Nature Mater. 6, 64 (2006).
- (10) See, for example, V. Petkov, V. Buscaglia, M.T. Buscaglia, Z. Zhao, and Y. Ren, Phys. Rev. B 78, 054107 (2008).