Critical view of the claimed pentaquark.
Abstract
We use a theoretical model of the reaction adapted to the experiment done at LEPS where a peak was observed and associated to the pentaquark. The study shows that the method used in the experiment to associate momenta to the undetected proton and neutron, together with the chosen cuts, necessarily creates an artificial broad peak in the assumed invariant mass in the region of the claimed . It is shown that the LEPS fit to the data, used to make the claim of the , grossly distorts the background. An alternative fit, assuming a background plus a fluctuation, returns a background practically equal to the theoretical one and a fluctuation identical to the one seen in the experimental spectrum of 2 significance.
Keywords:
Critical view of pentaquark:
14.20.PtIn Ref.(Nakano et al., 2003) the reaction was studied and a peak was found in the invariant mass spectrum around 1540 MeV, which was identified as a signal for a pentaquark of positive strangeness, the “”. The unexpected finding lead to a large number of poor statistics experiments where a positive signal was also found, but gradually an equally big number of large statistics experiments showed no evidence for such a peak. A comprehensive review of these developments was done in (Hicks, 2005), where one can see the relevant literature on the subject, as well as in the devoted section of the PDG (Amsler et al., 2008).
More recently a new experiment was done at LEPS on a deuteron target, and with more statistics, and a clear peak was observed around 1526 MeV in the invariant mass distribution (Nakano et al., 2009). Yet, the experiment of (McKinnon et al., 2006) dealing with the same reaction as in LEPS but with ten times more statistics and with complete kinematics (but excluding small angles), failed to see any peak around the “” region. The detail of complete kinematics should be stressed because in the LEPS experiment neither the proton nor the neutron were measured and an educated guess had to be made for their momenta.
In order to understand what is behind the peak seen in (Nakano et al., 2009), we have constructed a theoretical model which contains the basic ingredients seen in the LEPS experiment, production on the proton and the neutron and production on the proton, together with rescattering of the kaons. The details of this model can be seen in (A. Martinez Torres and E. Oset, 2010). We adapt the model to the set up of the LEPS experiment, generating twenty random energies between 2 GeV to 2.4 GeV and implement the angular cuts and the mass cuts to eliminate the peak.
The LEPS detector is a forward magnetic spectrometer. Its geometry is implemented in our simulation by imposing that the angle of the kaons in the final state with respect the incident photon is not bigger than 20 degrees.
The nucleons are not detected at LEPS, therefore, some prescription is required in order to estimate the momentum of the and in the reaction and determine the invariant mass of or . This is done using the minimum momentum spectator approximation (MMSA). For this purpose one defines the magnitude
| (1) |
which corresponds to the four momentum of the outgoing pair. From there one evaluates the nucleon momentum in the frame of reference where the system is at rest, . Boosting back this momentum to the laboratory frame, we will have a minimum modulus for the momentum of the spectator nucleon when the momentum for this nucleon goes in the direction opposite to . Thus, the minimum momentum, , is given by
| (2) |
where is the energy of the nucleon in the CM frame. In this case, the momentum of the other nucleon will be in the direction of the missing momentum with a magnitude
| (3) |
In (Nakano et al., 2009) the invariant mass for the reaction is evaluated assuming the proton to have a momentum (actually what one is evaluating is , with the non spectator nucleon). Consequently, in this prescription, the momentum of the neutron in the final state will be
| (4) |
which is used to calculate the invariant mass for the reaction in (Nakano et al., 2009). A cut is imposed at LEPS demanding that 100 MeV. This condition is also implemented in our simulation of the process.
In order to remove the contribution from the production at LEPS one considers events which satisfy that the invariant mass of the pair is bigger than 1030 MeV and bigger than the value obtained from the following expression
| (5) |
where is defined as the effective photon energy
| (6) |
with the square of the total center of mass energy for the system calculated using the MMSA approximation to determine the momentum of the neutron assuming the proton as spectator. In (Nakano et al., 2009) only events for which MeV MeV are considered, a condition which is also incorporated in our simulation. The of Eq. (6) with the MMSA prescription would correspond to the photon energy in the frame where the original non spectator (participant) nucleon is at rest.
The association of the spectrum to at LEPS has a repercussion in the assumed experimental distribution. The real distribution from the model has no peak of the distribution around the “” peak. Instead we show in Fig. 1 the distribution obtained using the LEPS cuts and the MMSA prescription, normalized to the experimental data, which are also shown in the figure.
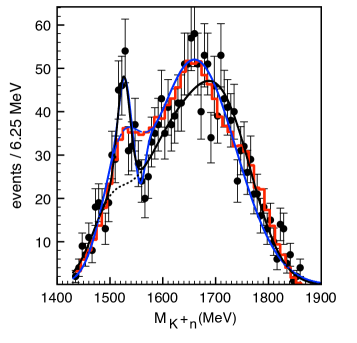
We use the full model of (A. Martinez Torres and E. Oset, 2010) including production on the proton and the neutron plus production on the proton. The MMSA prescription is used to compare to the data as explained before. As we can see in Fig. 1 (histogram), the combination of the LEPS cuts and the MMSA prescription, which also affects the cut, has produced an artificial peak below the region of the “”. Coming back to the comparison of the “exact” distribution, generated from the theoretical model, with the data (taken from Fig. 12 a) from (Nakano et al., 2009)), we see that the “” peak has three points on top of the “exact” distribution. The accumulated strength of these three bins over the “exact” curve is about 35 events. The question now remains: could this peak, measured from the “exact” curve, be a statistical fluctuation due to the limited number of events of the experiment (around 2000 events)?. A hint to answer this question is provided by the LEPS experiment in fig. 10 a) of (Nakano et al., 2009), where a peak followed by a dip is seen on top of the assumed background in the mass distribution. In order to compare with these data,
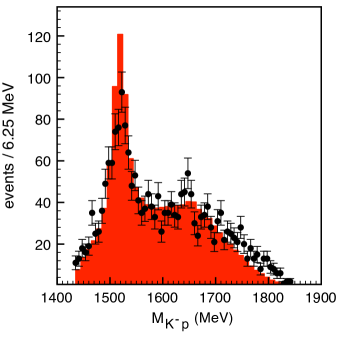
we show in Fig. 2 the mass distribution for obtained with our model and the MMSA prescription (actually the distribution, as discussed above), together with the data (Fig. 10 a) of (Nakano et al., 2009)). The agreement with experiment is good, like for the distribution shown in Fig. 1, indicating that we have indeed a realistic model. The discrepancies in the large momentum tail can be cured adding a small contribution of the broad (= 300 MeV) (1800) production to account for the tail of the p distribution, which also reduces a bit the peak of the upon normalization to the data, and we found minor changes in the n distribution, less than 5 in the region of the “” peak. Yet, the point we want to make is that there is a peak in the data around 1650 MeV with four points over the “exact” curve with an accumulated strength of about 33 events, followed by a similar dip, a typical structure of a statistical fluctuation. Since for this distribution there are no discrepancies in the interpretation with respect to (Nakano et al., 2009) we can take the background from there (solid line of Fig. 10 a) of (Nakano et al., 2009)) and we also find about 40 events. This peak was not associated to any resonance in (Nakano et al., 2009). Instead it was dismissed as a statistical fluctuation. In fact, the peak disappeared when a slightly different cut was made (see Fig. 16 (Right) of (Nakano et al., 2009)). The interpretation of this peak and dip as a fluctuation, as done in (Nakano et al., 2009), is fair, as this peak has about significance over the background ( is the statistical error of the data for which is taken in (Nakano et al., 2009)). But the peak of the “” over the “exact” distribution has also about 35 accumulated events and consequently could also be considered as a statistical fluctuation.
Here we would like to make a more quantitative study of the statistical significance of the “” peak, complementing the discussion done in (A. Martinez Torres and E. Oset, 2010). In (Nakano et al., 2009) a best fit to the data was done assuming a background and a Gaussian peak in the “” region. The best fit with these assumptions provided a background of about 22 events per bin below the “” peak, as can be seen in Fig. 12 a) of (Nakano et al., 2009) and reproduced in Fig. 1. With respect to this background, the “” peak has a strength of about . According to this, the statistical significance of the peak would rule out the possibility of it being a statistical fluctuation.
Conversely, after the theoretical evaluation of the background, our argumentation goes as follows: The actual background below the “” peak is bigger than the one provided by the LEPS best fit, around 36 events per bin instead of the 22 assumed in (Nakano et al., 2009). This makes the strength of the peak with respect to the background much smaller than in the LEPS best fit. It also makes larger and the statistical significance is now of about , something acceptable as a fluctuation, as in the case of the experimental spectrum. This can be made more quatitative by making the fit shown in Fig. 1 by means of a background and a fluctuation, with a gaussian peak followed by a gaussian dip, as it corresponds to the fluctuation seen in the spectrum in Fig. 2. This fit to the data has about the same than the LEPS fit. Remarkably, the fit with this shape returns a background practically identical to the one evaluated with the theoretical model.
This argumentation about the significance of the peaks is corroborated by further calculations. Indeed, in order to know the actual errors of the limited LEPS statistical we have made 10 runs with the Von Neumann rejection method, producing about 2000 events each, like in (Nakano et al., 2009). This method proceeds like the experiment, generating events or not according to their probability to be produced, and we have checked that the statistical significance of the runs is equivalent to that of the experiment. From these runs we have evaluated the statistical errors of each run for each bin (see section VI of (A. Martinez Torres and E. Oset, 2010)). The errors found are of the order of 20% in the region of the “”. This means an error () of about 7 events per bin, such that the difference of the peak to the background is indeed of the order of .
The other point we want to make is that it is possible to produce peaks by changing the cuts. This is shown explicitly in the experiment of (Nakano et al., 2009) since the mentioned peak at 1650 MeV in the mass distribution in Fig. 10 a) of that paper disappears when a slightly different cut is made in Fig. 16 (Right) of the same paper.
In summary, our study has shown that the background in the reaction is fairly larger than the one obtained in the best fit to the data of LEPS assuming a background and a Gaussian peak in the region of the “”. We also mentioned that the fit of LEPS is not unique and other fits to the data, assuming a background and a fluctuation, are possible, producing the same reduced and returning a background nearly identical to the calculated one. Based on the calculated background and the errors obtained from different Monte Carlo Von Neumann runs, we evaluated the statistical significance of the “” peak and found it to be of about with respect to the background, compatible with a fluctuation. The larger statistical significance claimed in (Nakano et al., 2009) was tied to the assumption of a significantly smaller background, which we have found is not justified.
This work is partly supported by the DGICYT contract FIS2006-03438, the Generalitat Valenciana in the program Prometeo and the EU Integrated Infrastructure Initiative Hadron Physics Project, n.227431.
References
- Nakano et al. (2003) T. Nakano et al., Phys. Rev. Lett. 91, 012002 (2003).
- Hicks (2005) K. H. Hicks, Prog. Part. Nucl. Phys. 55, 647 (2005).
- Amsler et al. (2008) C. Amsler et al., Phys. Lett. B 667, 1 (2008).
- Nakano et al. (2009) T. Nakano et al., Phys. Rev. C 79, 025210 (2009).
- McKinnon et al. (2006) B. McKinnon et al., Phys. Rev. Lett. 96, 212001 (2006).
- A. Martinez Torres and E. Oset (2010) A. Martínez Torres and E. Oset, Phys. Rev. C 81, 055202 (2010).
- A. Martinez Torres and E. Oset (2010) A. Martinez Torres, E. Oset, Phys. Rev. Lett. 105, 092001 (2010). [arXiv:1008.4978 [nucl-th]].