Detection of Periodic Variability in Simulated QSO Light Curves
Abstract
Periodic light curve behavior predicted for some binary black hole systems might be detected in large samples, such as the multi-million quasar sample expected from the Large Synoptic Survey Telescope (LSST). We investigate the false-alarm probability for the discovery of a periodic signal in light curves simulated using damped random walk (DRW) model. This model provides a good description of observed light curves, and does not include periodic behavior. We used the Lomb-Scargle periodogram to search for a periodic signal in a million simulated light curves that properly sample the DRW parameter space, and the LSST cadence space. We find that even a very conservative threshold for the false-alarm probability still yields thousands of “good” binary black hole candidates. We conclude that the future claims for binary black holes based on Lomb-Scargle analysis of LSST light curves will have to be interpreted with caution.
1 Introduction
Modern surveys of the sky, such as the Sloan Digital Sky Survey (SDSS, York et al. 2000), have collected huge amounts of data (20 TB for SDSS), requiring the development of automated analysis methods. The Large Synoptic Survey Telescope (LSST, Ivezić et al. 2008) will gather even more data than the SDSS did (one SDSS equivalent per night over ten years of operations). Among other populations, LSST will identify several million quasars (QSO) and obtain their light curves. In this contribution, we discuss an automated analysis of a million simulated light curves to search for periodic variability.
The optical variability of QSOs has been recognized since they were first identified (Matthews & Sandage 1963) and is aperiodic and on the order of 20% on timescales of months to years (for recent results see, e.g., MacLeod et al. 2010, hereafter M10). Periodic variability has been suggested as one of the observational characteristics of a binary black hole system (Komossa 2003), (also see Shen & Loeb 2010, for an investigation of broad line emission spectra in binary black holes), but there is no convincing observational evidence for such systems yet.
2 Goal
The large QSO sample expected from LSST might enable a detection of periodic signal in observed light curves. Recently we employed the Lomb-Scargle periodogram (Lomb 1976; Scargle 1982; Horne & Baliunas 1986) to test 9000 spectroscopically confirmed QSOs from SDSS Stripe 82 (S82) for periodic variability (see Appendix of M10). We reuse the tools developed for the analysis of SDSS data and study light curves simulated using a mathematical variability model trained on SDSS data, and sampled using simulated LSST cadences.
3 Creation of Light Curves
Approximately QSO light curves were generated using the damped random walk model (Kelly et al. 2009; Kozlowski et al. 2010, M10). The difference between this model and the well-known random walk is that an additional self-correcting term pushes any deviations back towards the mean flux on a time scale . The above studies have established that DRW can statistically explain the observed light curves of quasars at an impressive fidelity level (0.01-0.02 mag).
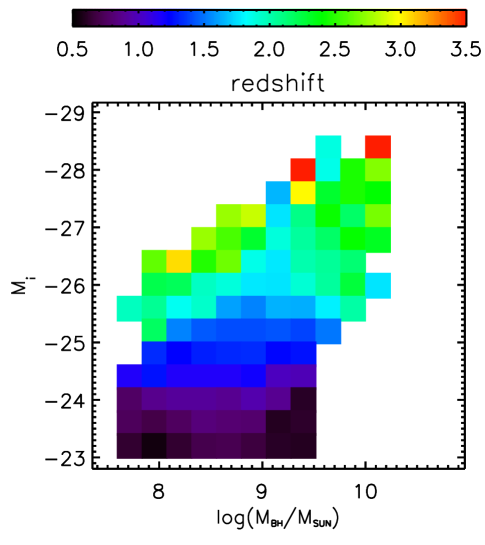
The input parameters to the model are the characteristic time scale, , and the root-mean-square (rms) variability on long time scales, or structure function, sf. The input parameters were determined using the scalings with black hole mass (), absolute magnitude (), and redshift found by M10. These physical parameters were drawn from the distribution shown in Figure 1. After generating 83,500 well-sampled light curves, each light curve was resampled to the 12 different simulated -band LSST cadences from Delgado et al. (2006, 200 observations spread over 10 years) to obtain total light curves.
All light curves were analyzed with Lomb-Scargle periodogram software. If the maximum power spectral density (PSD) value was above the level set according to the false alarm probability, fap, then the curve became part of a set used for further examination.
4 Results
We found that for high fap values, the actual number of light curves which exceeded the fap level was less than the theoretical value by an appreciable amount. For a fap value of 5%, there were 13,294 (1.3%) light curves that exceeded that level, for a fap value of 1%, there were 4696 (0.47%), and for a fap value of 0.1%, there were 1035 (0.1%).
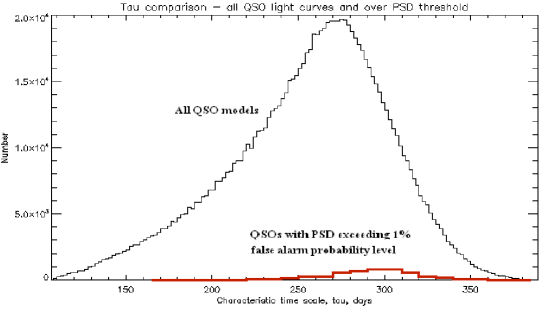
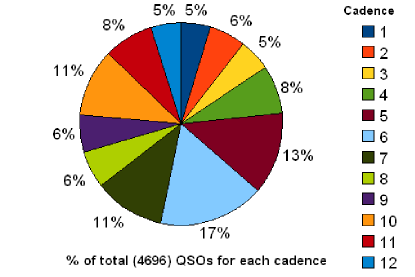
Figure 2 shows that values of for QSO models with PSD exceeding the 1% fap level (red histogram) are distributed differently than those for all the QSO models (black histogram). This bias is due to the fact that when is long, only a few “oscillations” are observed over the duration of the light curve, causing the periodogram to mistake the damped random walk behavior for a periodic behavior.
Figure 3 compares the proportions of QSO models found to exceed the 1% fap level for each of the cadences. There is a marked difference between the various cadences here, showing that some of the cadences allow many more periodogram results for which the 1% fap level is exceeded. This may be because the variations in the sampling pattern and the “windowing” effect of the Lomb-Scargle periodogram can cause a resonance effect at some test frequencies. Therefore, the results obtained by using the Lomb-Scargle periodogram method can be greatly influenced by the pattern of the observations used.
5 Conclusion
This work shows that the Lomb-Scargle periodogram method may be useful for detecting potentially periodic behavior in QSO light curves in a large-scale surveys, such as the one to be carried out by the LSST. However, even with fap as small as 0.1%, the large LSST sample would yield 1,000 false candidates. Therefore, future claims of periodic behavior based on Lomb-Scargle analysis of LSST light curves will have to be interpreted with caution. In particular, black hole binary candidates identified by this method would have to be examined individually and with supplemental observations.
Acknowledgments
We acknowledge support by NSF grant AST-0807500 to the University of Washington, and NSF grant AST-0551161 to the LSST for design and development activity. Ž. Ivezić thanks the University of Zagreb, where a portion of this work was completed, for its hospitality, and acknowledges support by the Croatian National Science Foundation grant O-1548-2009.
References
- Delgado et al. (2006) Delgado, F., et al. 2006, in Observatory Operations: Strategies, Processes, and Systems, edited by D. R. Silva, & R. E. Doxsey (Bellingham, WA, USA: SPIE), vol. 6270 of Proc. SPIE, 62701D
- Horne & Baliunas (1986) Horne, J. H., & Baliunas, S. L. 1986, ApJ, 302, 757
- Ivezić et al. (2008) Ivezić, Ž., Tyson, J. A., Allsman, R., Andrew, J., Angel, R., & for the LSST Collaboration 2008, ArXiv e-prints. arXiv:0805.2366
- Kelly et al. (2009) Kelly, B. C., Bechtold, J., & Siemiginowska, A. 2009, ApJ, 698, 895
- Komossa (2003) Komossa, S. 2003, in The Astrophysics of Gravitational Wave Sources, edited by J. Centrella (Mellville, NY, USA: AIP), vol. 686 of AIP Conf. Proc., 161
- Kozlowski et al. (2010) Kozlowski, S., et al. 2010, ApJ, 708, 927
- Lomb (1976) Lomb, N. R. 1976, Ap&SS, 39, 447
- MacLeod et al. (2010) MacLeod, C. L., et al. 2010, ApJ, 721, 1014
- Matthews & Sandage (1963) Matthews, T. A., & Sandage, A. R. 1963, ApJ, 138, 30
- Scargle (1982) Scargle, J. D. 1982, ApJ, 263, 835
- Shen & Loeb (2010) Shen, Y., & Loeb, A. 2010, ApJ, 725, 249
- York et al. (2000) York, D. G., et al. 2000, AJ, 120, 1579. arXiv:astro-ph/0006396