Complex magnetic behavior and high spin polarization in Fe3-xMnxSi alloys
Abstract
Fe3Si is a ferromagnetic material with possible applications in magnetic tunnel junctions. When doped with Mn, the material shows a complex magnetic behavior, as suggested by older experiments. We employed the Korringa-Kohn-Rostoker (KKR) Green function method within density-functional theory (DFT) in order to study the alloy Fe3-xMnxSi, with . Chemical disorder is described within the coherent potential approximation (CPA). In agreement with experiment, we find that the Mn atoms align ferromagnetically to the Fe atoms, and that the magnetization and Curie temperature drop with increasing Mn-concentration . The calculated spin polarization at the Fermi level varies strongly with , from at (ordered Fe3Si) through at , to for ; i.e., at high Mn concentrations the system is half-metallic. We discuss the origin of the trends of magnetic moments, exchange interactions, Curie temperature and the spin polarization.
pacs:
75.50.Bb, 71.20.Be, 71.70.Gm, 71.20.LpI Introduction
Magnetic intermetallic alloys show very rich physics depending on the degree of doping and chemical disorder, which can therefore be used as “control parameters” allowing to tune the electronic and magnetic structure for desired effects. In particular, physical properties that are fundamental for technological applications in spintronics, such as the magnetization , Curie temperature , or spin polarization at the Fermi energy, vary strongly with respect to these control parameters
The alloy Fe3-xMnxSi, belonging to the wider class of Fe3-xTMxSi alloys with TM a transition-metal element,Niculescu83 is an example of such dependence on the degree of doping.Yoon77 As the Mn concentration increases, the magnetization of Fe3-xMnxSi drops continuously from 5 to zero; its temperature-dependent magnetic properties change from high- (800 K) ferromagnetism, through low- ferromagnetism with re-entrant behavior at 70 K, to complex non-collinear magnetism; its calculated spin polarization increases from to the ideal, half-metallic ,Fujii95 and then drops again due to the non-collinear behavior. These observations are not new, however, there is a recent revival of the interest in Fe3-xMnxSi due to potential applications in magnetic tunnel junctions.Hayama09
Motivated by this revival, we present here a theoretical study to the electronic and magnetic properties of Fe3-xMnxSi for based on ab initio calculations. The choice of concentration range is motivated by the specific site preference of Mn for , so that the resulting state is ferromagnetic as we see later; for , non-collinear magnetic configurations can occur. We provide an interpretation of the magnetization drop as a function of concentration in terms of wavefunction symmetry and hybridization, together with the requirement for local charge neutrality. We further propose that the increase in spin polarization up to the half-metallic point is due to the same mechanisms that cause the magnetization drop. Moreover, after extracting exchange interactions from the ab initio results, we calculate the Curie temperature using a Monte Carlo approach, and are able to reproduce the drop of as a function of Mn concentration. Finally, we discuss where our results do not agree with experiment, and we propose a possible reason for the disagreement; this is particularly the case for the re-entrant behavior and the value of magnetization at high Mn concentrations.
The paper is structured as follows. In Sec. II we summarize the experimental and theoretical background on Fe3-xMnxSi. Sec. III is devoted to the description of our calculational approach. We continue with a presentation of our results on the magnetization and spin polarization in Secs. IV and V and of the Curie temperature in Sec. VI. In Sec. VII we discuss the limitations of our approach, their consequences, and possibilities for a more accurate description. Our conclusions are summarized in Sec. VIII.
II Experimental and theoretical background
II.1 Experimental
Quite a few experimental studies have been done on the magnetic properties of Fe3-xMnxSi, revealing a highly complex magnetic behavior dependent on the Mn concentration . Here we recall the main results of these experiments, with emphasis on the concentration range which interests us in the present work. At high concentrations, one reaches the Fe-doped Mn3Si compound, which exhibits more complicated properties; e.g., Mn3Si is an incommensurate antiferromagnet with a Néel temperature of about 25 K, while Fe3Si is a ferromagnet.
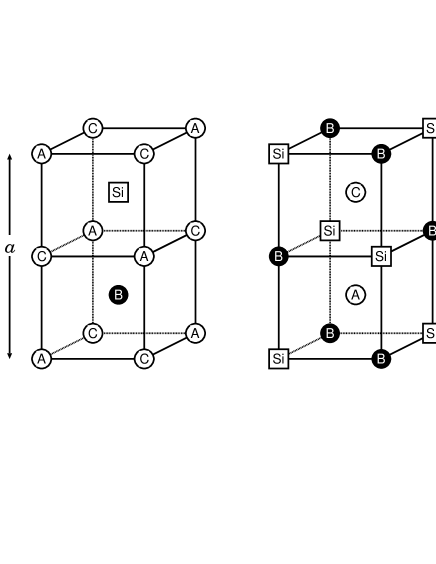
Structure and site preference. Fe3Si crystallizes in the D03 structure consisting of a fcc lattice with four basis atoms (see Fig. 1). These are placed at (Si atom), (FeA-atom), (FeB-atom), (FeC-atom), where is the lattice constant. The FeA and FeC atoms are tetrahedrally coordinated to four FeB and four Si atoms and exhibit equivalent electronic ground-state properties due to symmetry. The FeB atoms are octahedrally coordinated to eight FeA,C atoms; their electronic properties therefore resemble somewhat bcc Fe, as we will discuss.
When Mn is doped into Fe3Si, it substitutes FeB atoms, as is found by experiment. This appears to be part of a general trend found experimentallyBurch74 ; Pickart75 ; Niculescu83 and modeled theoreticallySwintendick76 in which transition-element atoms which are to the left of Fe in the periodic table prefer to reside at the B-site when doped into Fe3Si, while transition-element atoms which are to the right of Fe prefer to substitute the Fe atoms at the A and C sites.
Yoon and BoothYoon74 ; Yoon77 report that, in the range , the Mn atoms substitute the B-site Fe, as verified by hyperfine field measurements of Niculescu et al..Niculescu76 ; Niculescu83 Above , an increasing fraction of Mn atoms tends to reside at the A,C sites with equal probability. At , this “swap” fraction is 12% according to Ziebeck and WebsterZiebeck76 and 15% according to Yoon and BoothYoon77 ; i.e., even Fe2MnSi contains a small amount of chemical disorder. Fe3-xMnxSi has thus the L21, or full-Heusler, structure. Similar results are found in more recent hyperfine-field experiments.Mahmood04
The measured lattice parameter changes linearly and only slightly as a function of the concentration (see Ref. Niculescu76, ) from 5.653 Å at to 5.663 Å at , i.e., by about 0.2%. The linear change continues for higher .
Magnetic moments. As was shown by Booth et al.Booth74 and Yoon and Booth,Yoon74 ; Yoon77 the saturation magnetization drops linearly from about 4.8 to 2.6 per formula unit in the range . The local magnetic moments depend strongly on the site. The B-site has a high moment of about between , which then drops gradually and vanishes at ; at the A,C sites (containing only Fe for low ), the moment decreases from 1.4 to 0.3 as increases from 0 to 0.75. The net result is the aforementioned drop of the total magnetic moment.
Anomalous temperature dependence of the magnetization. In the concentration range a re-entrant behavior of the magnetization curve is found:Yoon74 ; Yoon77 for temperatures from K up to the re-entry temperature K, is increasing, while for is decreasing, as expected for a usual ferromagnet, up to the Curie temperature . Thus, two values of the saturation magnetization can be defined, one () as the actual measured value , and another () as the extrapolated value of from data taken for ; evidently, . For , in fact, where this effect just starts to appear, the two values are close (), and application of a magnetic field of kOe can further saturate the sample so as to reach the value . The anomalous temperature dependence of was also found by Ziebeck and Webster Ziebeck76 for the Fe2MnSi alloy, as well as by Nagano and co-workersNagano95 and by Ersez et al.Ersez96 who analyzed the effect via neutron scattering. However, in a recent work where the samples were grown by molecular beam epitaxy,Hayama09 this anomalous behavior was not observed (up to ).
Curie temperature. The Curie temperature drops as a function of the Mn concentration , from about K at to K at ; i.e., for no saturation magnetization is found, while the sample is at a complex non-collinear magnetic state. At , where the re-entrant magnetic behavior sets on, K and K, while at , K and K.Yoon77
Thermodynamic properties. The anomalous behavior at also shows in measurements of thermodynamic quantities. In particular, Smith et al.Smith80 have measured a specific heat anomaly at , most pronounced for the compounds. Furthermore, Miles et al.Miles88 report a sharp peak of the thermal expansion coefficient at K for the Fe2MnSi alloy (i.e., ), while they find no such pronounced behavior at .
Heat treatment. As reported in Ref. Yoon77, , the sample preparation included a 24-hour heating at 830∘C and water quenching; a different heat treatment (21 days at 550∘C and slow cooling) for samples with appeared to increase , bringing it closer to , but had no effect on the values of or . Ziebeck and WebsterZiebeck76 and Smith et al.Smith80 also used an annealing treatment at over 800∘C for 24 hours water quenching. Miles et al.Miles88 used two samples, one quenched from 800∘C and one slowly cooled, with no change in the expansion coefficient and its anomaly at .
II.2 Theoretical
Only few theoretical results exist on the electronic structure of Fe3-xMnxSi. Mohn and SupanetzMohn98 employed an augmented spherical wave method and the local spin density approximation (LSDA) to density-functional theory to examine non-collinear states in the ordered alloys Fe3Si, Fe2MnSi (with the Mn atom at the B-site), FeMn2Si (with one Mn atom at the B-site and one at the A-site), and Mn3Si. For Fe3Si they found a ferromagnetic ground state, while non-collinear ground states were found for all other compounds. In particular for Fe2MnSi, which is of interest here, Mohn and SupanetzMohn98 found a local energy minimum at the ferromagnetic state, with a lower minimum for a spin-spiral along the [111] axis, at a -vector of . According to their calculation, the ground state was an antiferromagnetic state, with the Mn moments alternating along the [111] axis, while the moment direction was canted off the [111] direction by about 60∘. The energy difference between the non-collinear ground state and the ferromagnetic state in Fe2MnSi was reported to be around 0.8 mRyd (10.9 meV). A canting of the magnetic moments below was also assumed by Yoon and BoothYoon74 ; Yoon77 in order to explain the neutron scattering data.
More recently, ab initio calculations were presentedGo07 on Fe3-xMnxSi for using the supercell method. Mn was considered to occupy the B site. It was found that the spin moments of Fe at the A and C sites are reduced in the presence of Mn nearest neighbors, which induces a redistribution of the FeA,C states; a drop of the total moment with increasing Mn concentration was observed and attributed to the FeA,C moments. Furthermore, ab initio calculations on Fe3-xMnxSi and Fe3-xMnSix alloys were presented in Ref. Hamad10, ; the calculations here agree with the previous results that the magnetic moments of the A and C sites drop as a function of Mn concentration, while it is found that the B-site atomic moments increase. The Fe moments appear to be higher than the Mn moments, so that the B-site average moment does not change much.
Further theoretical work appears in parallel with experiments. Szymański et al.Szymanski91 examined the spin dynamics of Fe3-xMnxSi using neutron scattering at room temperature and at liquid nitrogen temperature, and fitted their results to effective interatomic exchange integrals which enter a Heisenberg Hamiltonian. The fitted values of the exchange constants depend on the number of neighbors considered; the nearest-neighbor exchange for Fe3Si ranges between 10 and 20 meV. Brown and co-workersBrown85 analyze the behavior of the magnetic moments based on symmetry arguments and on a model by SwintendickSwintendick76 and conclude that, as the Mn concentration increases, the reduction of the exchange splitting leads to the drop of the FeA,C moment.
III Method of calculation, models and cutoff parameters
Our electronic-structure calculations are based on density-functional theory within the generalized gradient approximation (GGA)PW91 to account for exchange and correlation effects. The local spin density approximationVosko was also used for comparison and proved to be inadequate for the prediction of the correct magnetic ground state at low and intermediate Mn concentrations (see Sec. IV). Calculations were also performed within the “single-shot GGA”,Asato99 where, using the self-consistent LSDA spin density, , the total energy is calculated within the GGA functional ; i.e. one calculates . This approach is based on the idea that , as a trial density, is not too far from the self-consistent GGA density , so that, due to the variational character of the energy functional, . The single-shot GGA is known, for instance, to correct the LSDA overbinding, giving an improved equilibrium lattice parameter, very close to the one predicted by the GGA.Asato99
The Kohn-Sham equations are solved in most cases within the full-potential Korringa-Kohn-Rostoker (KKR) Green function methodSPRTBKKR with exact treatment of the atomic cell shapes,Stefanou91 using an angular momentum cutoff of and an integration mesh of points in the full Brillouin zone. The substitutional disorder was described within the coherent potential approximation (CPA). For the calculation of magnetically non-collinear states and static magnon spectra we employed the full-potential linearized augmented plane wave FLAPW1 ; FLAPW2 ; FLAPW3 (FLAPW) method as implemented in the FLEUR code,FLEUR using a plane-wave cutoff of , an angular momentum cutoff of , muffin-tin radii of 1.19 Å for Fe and Mn and 1.222 Å for Si, and an mesh in the full Brillouin zone. The FLAPW code was also used to cross-check the KKR results in some cases. Relativistic effects were taken into consideration within the scalar relativistic approximation, whereas spin-orbit coupling was not accounted for.
Since the lattice parameter varies only slightlyNiculescu76 in the range we used the experimental value at , Å, in all calculations.
Magnetic excitations are modeled within a classical Heisenberg Hamiltonian,
| (1) | |||||
| (2) |
where and are unit vectors along the directions of the spin moments, and , at sites and , while the exchange pair-interaction constants reflect the energy cost for the mutual tilting of the moments. It is sometimes convenient for the discussion to use the form (2) with . The constants were extracted from the spin-dependent KKR structural Green functions and -matrices by virtue of the Liechtenstein formulaLiechtenstein87
| (3) |
Here, and are matrices in angular momentum space and denotes a trace over the angular momentum indices ().
Having calculated the exchange constants, the Curie temperature of the compounds was calculated within a Monte Carlo method. For this purpose, exchange constants of atom pairs with distance up to lattice constants were used; the simulation supercells included 1536 magnetic atoms (512 unit cells). The Curie temperature was identified through the characteristic peak of the calculated susceptibility. The method, either in combination with Monte Carlo simulations or with the random phase approximation for the solution of the Heisenberg model, has proven useful for the calculation of the exchange constants and Curie temperature with a 10-15% accuracy in several cases, including elemental ferromagnets and intermetallic alloys.Sasioglu05 ; Turek06 ; Lezaic07
IV Ground state magnetic moments and configuration
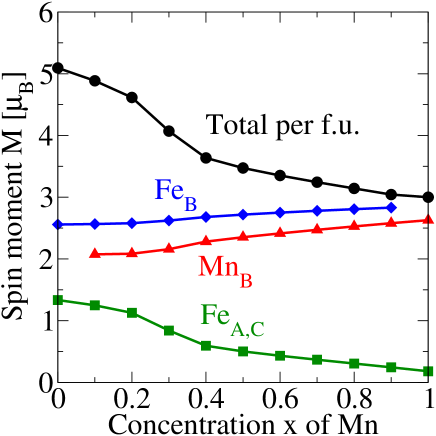
The calculated magnetic moments (per atom and total) as a function of concentration are depicted in Fig. 2. Here the Mn atoms were assumed to reside at the B site for all . Evidently, the B-site atoms (Fe and Mn alike) are generally in a high-spin state, while the Fe atoms at the A and C sites are in a low-spin state. A small, monotonic increase of the B-site atomic moment is observed as a function of the Mn concentration: the FeB moment ranges between 2.6 and 2.9 , while the Mn moment ranges between 2.1 and 2.6 . In strong contrast, the FeA,C moments drop significantly as the Mn content increases, from 1.3 for pure Fe3Si to 0.2 for the ordered Fe2MnSi alloy. This drop of the FeA,C moment causes the decrease in the total magnetic moment per unit cell.
This trend is in agreement with experimental findingsBooth74 ; Yoon74 ; Yoon77 that the average moment at the B-site is high and remains more or less unaffected by Mn-doping, while the A and C-site moments drop significantly. (A deviation from the experimental result is found for , where there is experimental evidence for re-entrant behavior and reordering of spins.) The trend can be understood by an analysis of the density of states and an understanding of the different wavefunction hybridization of MnB-FeA,C and FeB-FeA,C atoms; we defer the discussion to section V.
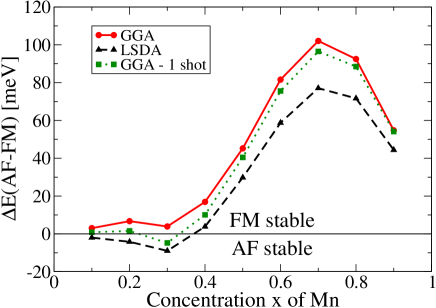
In the calculation, the Mn dopants can be chosen to align ferromagnetically or antiferromagnetically to the Fe3Si matrix. Total-energy calculations are then needed to identify the correct ground state, which experimentally is found to be ferromagnetic,Booth74 at least for concentrations . The calculations within the GGA show that the ferromagnetic state is stable for all Mn concentrations (see Fig. 3). However, the result within the LSDA is that the antiferromagnetic state is more stable than the ferromagnetic one for , in clear disagreement with experiment;Booth74 actually, for , the LSDA lowest energy is found in a disordered local moment state of the form Fe3-xMnMnSi, as the Mn atoms progressively change the moment orientation from antiferromagnetic (Mn↓) to ferromagnetic (Mn↑). This indicates a possible non-collinear LSDA ground state (our calculations for the disordered alloys were always magnetically collinear). The dispute between the LSDA and GGA results at low concentrations was cross-checked and verified by a calculation within the FLAPW method, where a low Mn concentration of was approximated by construction of a large supercell (the same lattice parameter was used in LSDA and GGA calculations, see Sec. III).
The failure of the LSDA to predict the correct magnetic ground state can be attributed to the exchange and correlation part of the total energy, rather than the single-particle energies. We arrive at this conclusion for two reasons. Firstly, the GGA density of states is very similar to the LSDA density of states (when both are calculated in the ferromagnetic configuration). Secondly, we attested our suggestion by using the single-shot GGA (described in Sec. III), which changes only the exchange-correlation part of the total energy, while retaining the LSDA single-particle energies. The total-energy results are then improved significantly, although not entirely, towards the correct magnetic ground state as can be seen in Fig. 3. We note that there is no general rule favoring the GGA over the LSDA as far as the magnetic properties are concerned. For example, long-wavelength spin-wave spectra calculated within the adiabatic approximation agree rather well with experiment if the LSDA is used (see, e.g., Pajda et al.Pajda01 for Fe, Co and Ni, or Buczek et al.Buczek09 for intermetallic alloys). There are even reported cases, such as Fe3Al,Lechermann02 where GGA gives the wrong crystal structure, while LSDA corrects the structure as well as the magnetic moments.
V Density of states, magnetic moments, and half-metallic behavior
V.1 Trends of DOS with concentration; magnetic moments
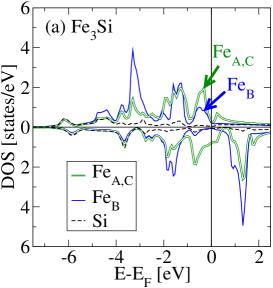
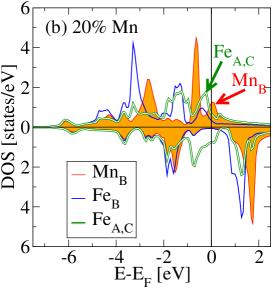
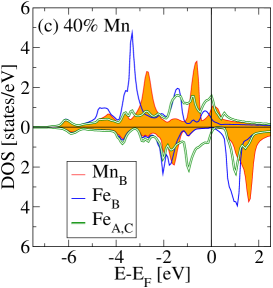
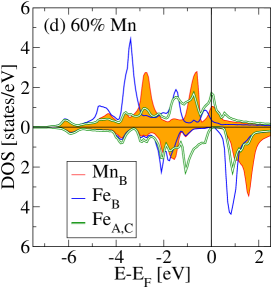
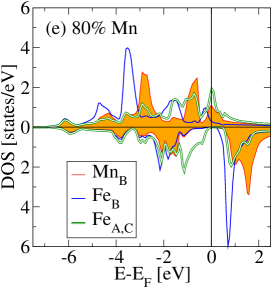
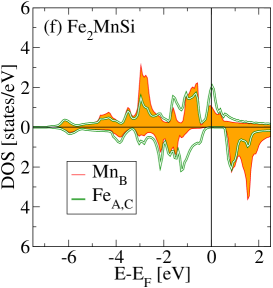
The density of states (DOS) of Fe3-xMnxSi at various concentrations is depicted in Fig. 4. The gross features have been analyzed in the past in studies of full Heusler alloys.Galanakis02 Most important points specifically for our discussion are: (i) The hybridization of -states of character of the B-site atom (Fe or Mn) with states of the A and C-site Fe atoms. (ii) The strong-ferromagnet character of the B-atoms as opposed to the weak-ferromagnet character of the (A,C) atoms. (iii) The progressive shift, for charge-neutrality reasons, of the majority-spin states at the B-site as the Mn concentration is increased, dragging with them the (A,C)-site states due to hybridization and affecting the FeA,C moment and DOS. We now discuss these points in detail; the trends of the magnetization and the appearance of half-metallicity are directly connected to this behavior and also discussed in this section.
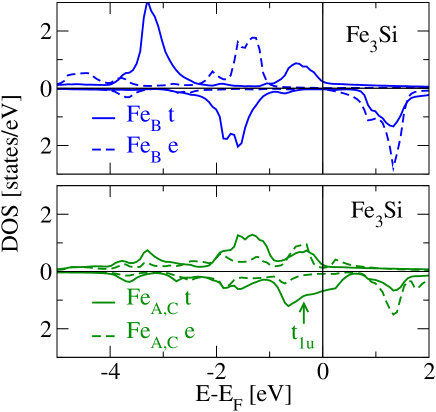
(i) The -states of FeB and Mn are split by the octahedral environment into two irreducible representations: the , including the , , and orbitals, and the , including the and orbitals (, , and are implied to be directions along the cubic crystal axes). The FeA,C -states are also split by the tetrahedral environment. However, it is also important that orbitals of FeA,C atoms interact with each other, although the FeA,C atoms are second-nearest neighbors. This interaction produces bonding-antibonding splittings between and -type of states, and also between and -type of states.Galanakis02
Hybridization between -states of B-site atoms with FeA,C atoms is allowed only among the states of or the ones of character; by symmetry, the and states remain oblivious to the -states of their B-site neighbors.Galanakis02 The symmetry-decomposed DOS is shown in Fig. 5 for Fe3Si, and is completely analogous in Fe3-xMnxSi, with the peaks appropriately shifted as discussed below.
(ii) On the one hand, the local DOS of the B-site atoms (either Fe or Mn) has in all cases the characteristics of the DOS of a strong ferromagnet. Namely, the B-site local DOS of one spin direction (here spin down) is very low at and in a region around , as is evident by inspection of Fig. 4. Consequently, on-site transfer between spin-up and spin-down charge is energetically expensive, because a strong shift of -bands is involved. This, together with the requirement of local charge neutrality in a metallic system, stabilizes the local atomic moment of Fe or Mn at the B-site against perturbations (such as change of concentration or lattice parameter). Therefore there is only weak dependence of the Fe and Mn moment on concentration, as seen in Fig. 2. The strong-ferromagnet behavior of the B-site is favored by its octahedral bcc-like coordination, which results in large bonding-antibonding splittings via - and --hybridization of the B-site atoms with FeA,C neighbors. The line-shape of the local DOS at the B-site is reminiscent of bcc iron.
On the other hand, the local DOS of the FeA,C atoms has the characteristics of a weak ferromagnet, i.e., -states of both spin directions are present at and around . This allows for energetically cheap transfer between spin-up density and spin-down density, and therefore relatively easy change of moment. Note from Fig. 2 that the drop of the FeA,C-moment is strongest for , at the same concentration range when the FeA,C-DOS at is large for both spins in Fig. 4, i.e., when the weak-ferromagnet character is most evident; before there is a DOS valley at for spin-up, and after there is a valley for spin-down. The weak-ferromagnet behavior of FeA,C is favored by the and states forming the spin-down peak of FeA,C around in Fe3Si.
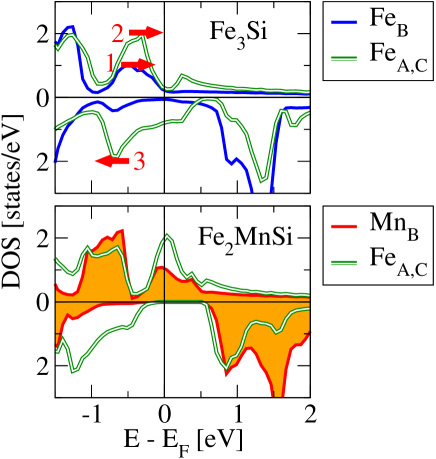
(iii) Now we consider the consequences of observations (i) and (ii) (see Figure 6). We first focus on the B-site in Fe3-xMnxSi. Since a metal must show approximate local charge neutrality, the Mn states must be appropriately shifted with respect to those of Fe so that one less electron is accommodated by Mn. This is achieved by a shift of the spin-up and peaks, which are just under for the FeB atom, so that they fall at for the Mn atom (as indicated by arrows in Fig. 4(a,b)). Now, there is a peak of character (also indicated by arrows in Fig. 4(a,b)) in the FeA,C DOS, associated by hybridization to the aforementioned B-site peak. This, at low Mn concentrations, is associated more to the FeB DOS, while at high Mn concentrations it is associated more to the Mn DOS. At intermediate concentrations, as the Mn content increases, the FeA,C peak is dragged to higher energies and starts crossing the Fermi level, depriving the FeA,C atoms of spin-up charge. This is readily compensated (to maintain local charge neutrality) by a shift of spin-down FeA,C states from to slightly below , gaining spin-down charge. The net effect is a reduction of the FeA,C spin moment, accompanied by the appearance of a spin-down gap at , i.e., the signature of a half-metallic behavior.
Thus we see that the - hybridization between states at the B and A,C sites, together with the requirement of local charge neutrality, leads to the drop of FeA,C moment as the Mn concentration increases.
In spite of the calculated drop of the magnetization per formula unit, the values are still too high compared to experiment,Yoon77 although they are in agreement with previous calculations.Fujii95 ; Galanakis02 ; Go07 ; Hamad10 For Fe2MnSi, the calculated value is 3 , while the experiment gives and . We propose an explanation of this discrepancy in Sec. VII.
V.2 Spin polarization and transition to half-metallic behavior
The spin polarization at is defined as
| (4) |
with and , respectively, the spin-up and spin-down DOS at . The mechanism described in the previous subsection, involving a shift of the peaks around , leads to a drastic change of as a function of the Mn concentration. This is visualized in Fig. 7. At low , is negative, approximately (the negative sign means that the DOS at is dominated by minority-spin carriers). At higher concentrations crosses zero and reaches high positive values, as the spin-up DOS peak shifts to , while the spin-down peak is retracted below . At around the spin polarization reaches the highest possible value of , and the alloy becomes half-metallic. At this point the (experimentally found) Curie temperature is about 370 K. A half-metallic behavior of ordered Fe2MnSi was also found in previous calculations.Fujii95 ; Galanakis02 ; Go07 ; Hamad10
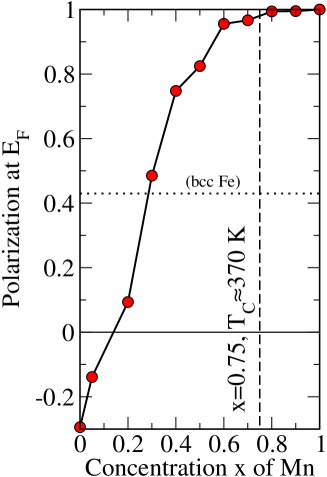
This is a rare occasion in which a continuous change of a material parameter — here the Mn concentration — results in a continuous change of the spin polarization over such an extended range. Assuming that this effect is present in experiment, it could be efficiently used to compare to each other various experimental methods of probing the spin polarization (such as spin-polarized photoemission spectroscopy, positron annihilation, Andreev reflection, or tunneling magnetoresistance). It should be noted that the half-metallic behavior is already present at , i.e., before the start of the re-entrant behavior.
VI Exchange interactions and Curie temperature
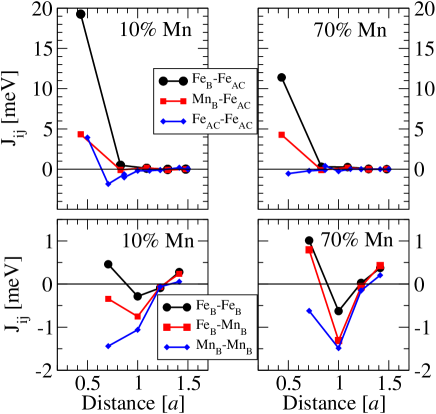
The exchange pair-interaction constants were calculated for several Mn concentrations as described in Sec. III. They are plotted as a function of distance in Fig. 8. In all cases, we find that the dominant contribution comes from the first-neighbor interaction between the site-B atom (Mn or Fe) and FeA,C. The FeB-FeA,C interaction, , is between 20 and 10 meV, depending on concentration, and the MnB-FeA,C interaction, , is between 3-5 meV; next-nearest neighbor interactions (Fe-Fe, Mn-Mn or Fe-Mn) are typically at least one order of magnitude weaker. Therefore we expect the Curie temperature trend with concentration to follow the behavior of the averaged , at least qualitatively.
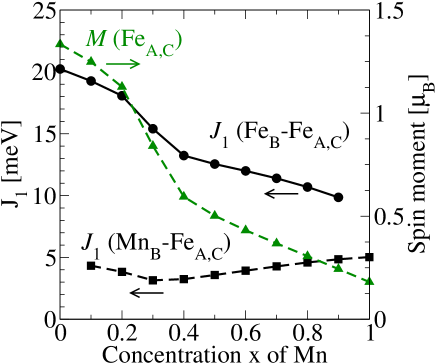
The trends of with concentration are depicted in Fig. 9, together with the moment of the FeA,C atoms, (FeA,C). There is a clear correlation between and (FeA,C), while seems unaffected by the drop of (FeA,C). We now discuss these observations. The pair-interaction energies , determined by the electronic structure, contain the absolute value of the atomic spin moments in a non-trivial way. By this we mean that, if the moments are varied by some external parameter (e.g., here, by changing the concentration), can be affected either just by the variation of the absolute value of the moment (as suggested by the alternative form derived from Eq. (2), ), or also by an alteration of the exchange mechanism, which is induced by the change of the electronic structure via the external parameter and affects the constants .
Apparently, in Fe3-xMnxSi we are faced with both situations. On the one hand, the dominant trend for comes from the reduction of the FeA,C moment as the Mn concentration increases, although there seems to be also an alteration of , since the drop of (FeA,C) is faster than the drop of . On the other hand, is left practically unaltered despite the strong reduction of (FeA,C). In order to interpret this, we again observe the shifting of the peak, indicated by an arrow in the FeA,C DOS in Fig. 4, as a function of . This hybridization-induced peak coincides more and more with its associated Mn peak as the Mn concentration is increased. Since the Fermi level bisects the Mn peak (and increasingly more the FeA,C peak), the double-exchange mechanism sets in progressively more and more, favoring ferromagnetic alignment of the moments. (We remind the reader that the double-exchange mechanism is present when half-filled states of the same spin hybridize with each other, resulting in a band broadening and a gain in energy; in a tight-binding picture, the kinetic energy is lowered by the inter-atomic hopping of electrons, allowed by the half-filled band.) Thus, the progressive shift of the indicated peak in the FeA,C DOS causes two competing effects: a reduction of the moment (FeA,C) (as discussed in Sec. V) and a strengthening of the Mn-Fe pair exchange interaction. These effects by and large cancel each other in the Heisenberg energy expression, and the net result is only a weak dependence of on concentration.
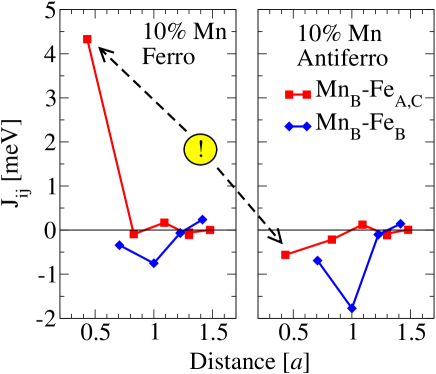
We close the discussion on the exchange parameters with the following comments on the calculations. In the present work, the exchange constants were calculated starting from the ground-state (ferromagnetic) configuration. As a test, however, we calculated the Mn-Fe exchange constants starting from the antiferromagnetic (AF) state (i.e., with the Mn moments antiferromagnetically aligned to the Fe3Si matrix) for a Mn concentration of , and compared with the result starting from the ferromagnetic (FM) ground state. As can be seen in Fig. 10, there is a strong qualitative difference in the calculated value of the nearest-neighbor Mn-Fe interaction in the two cases: starting from FM, we obtain a tendency to retain ferromagnetism (positive exchange constant); while starting from AF, we obtain a tendency to retain antiferromagnetism (negative exchange constant). For the more distant neighbors the two calculations give quantitative, but not so much qualitative, differences. This discrepancy demonstrates the significant change in electronic structure at high angles, far beyond the assumptions of a Heisenberg model. The discrepancy is not observed at higher Mn concentrations, when the electronic structure of the FeB-atoms at is dictated more and more by the hybridization of their -states with the Mn -states. In addition, we note that, in the case of Fe2MnSi, the LSDA result for the Mn-FeA,C nearest-neighbor exchange parameter is weaker by approximately compared to the GGA result. This reflects also on the magnon spectra that are discussed in Sec. VII. Such a discrepancy between LSDA and GGA does not show up for Fe3Si.
Calculated Curie temperatures of Fe3-xMnxSi are shown in Table 1 together with experimental results. The experimental finding of a reduction of with increasing concentration is reproduced, although the calculated results systematically underestimate the experimental values. The reason for this trend is obviously the reduction of as a function of concentration, in conjunction with the comparatively low values of which become important at high concentrations. Note that, at , the Fe2MnSi alloy is found experimentallyZiebeck76 to possess a degree of disorder in the form of a MnB-FeA,C swap of 12%. When considering such a swap in the calculations, we found an increased of 200 K, mainly because the Fe atoms replacing Mn at the B-site have a stronger exchange interaction with the FeA,C neighbors. However, a possible Mn clustering at this concentrations, which could affect the value of the exchange interactions, cannot be taken into account within the CPA. This is discussed in more detail in the next section.
| [K] (exp.) | [K] (calculated) | |
|---|---|---|
| 0.0 | 803 | 730 |
| 0.5 | 450 | 320 |
| 1.0 | 200 | 160 (ordered; Mn at B) |
| 200 (12% Mn at A,C) |
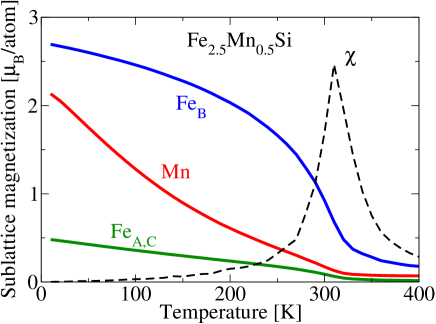
Before closing this section, we show an interesting behavior of the Mn sublattice magnetization at low or intermediate concentrations. Kepa et al.Kepa88 and Ersetz et al.Ersez95 find experimentally that the MnB moment at room temperature is significantly lower than what is reported close to K. E.g., for ,Ersez95 at room temperature instead of 2.2 . Therefore they propose that the Mn average moment drops with temperature faster than the Fe moment. This is reproduced by our Monte Carlo simulations, and is due to the weak coupling of Mn to FeA,C compared to the coupling of FeB to FeA,C. As we see in Fig. 11, the Mn magnetization curve does not follow the critical-behavior form with an inflection point of the Fe curve, but rather drops almost linearly. This is also reflected in the Mn sublattice susceptibility (not shown here), which does not show a peak at .
VII Discussion on the re-entrant behavior; Limitations of present calculations
In Sec. II we summarized what is known on the anomalous behavior of the magnetization of Fe3-xMnxSi for . The magnetization increases for (contrary to the behavior in a usual ferromagnet), then decreases again up to ; varies with concentration, starting from low values at and saturating at about 70-80 K at . This so-called re-entrant behavior and the resulting re-ordered phase, which has been the focus of many experimental works, could not be reproduced by calculations within the approximations used in the present work.
There is experimental evidence,Ziebeck76 ; Yoon77 based on neutron scattering data, that the re-entrant behavior arises from transverse ordering of the MnB magnetic moments. This means that, in the ground state, the Mn moments are partly canted to the direction of average magnetization. As the temperature is increased, the Mn moments absorb energy by aligning their spins and thus the average magnetization increases.
Mohn and SupanetzMohn98 performed first-principles (LSDA-based) calculations of non-collinear magnetic structures for spin-spirals of several wavevectors . For ordered Fe2MnSi they found that the ferromagnetic state represents a local minimum, while a spin spiral of wavevector has a lower energy by about 0.75 mRyd (10.2 meV). The absolute energy minimum which they found is very slightly lower, for a state which shows a canted antiferromagnetic ordering of the Mn moments along the [111] axis, with a canting angle of with respect to the [111] axis.
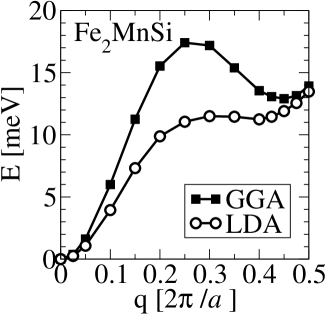
We also performed calculations of magnetically non-collinear spin spirals along the [111] axis using the FLAPW method.FLEUR However, the results of Ref. Mohn98, were not reproduced. Our results are shown in Fig. 12. Calculations within both the LSDA and the GGA show a ferromagnetic ground state (i.e., a global minimum at ), while a local minimum is found close to , i.e., at the point where the spin-spiral minimum is found in Ref. Mohn98, . The energy difference between the two (local and global) minima is of the order of 11 meV within the LSDA and 13 meV within the GGA. We do not know the origin of the discrepancy between our calculations and the calculations of Ref. Mohn98, . A possible source of discrepancy is the use of a spherical potential approximation in Ref. Mohn98, , as opposed to a full potential calculation here.
However, these non-collinear calculations (ours as well as the ones of Ref. Mohn98, ) neglect a 12% Mn-Fe swap which is seen experimentally in Fe2MnSi; i.e., experimentally this alloy has a small degree of disorder. Given the small calculated energy differences between the local and global minima (about 10 meV per formula unit), a correct description of this swap can have important consequences. We attempted to model the swap by calculating the electronic structure of (Fe0.94Mn0.06)A,C(Fe0.12Mn0.88)BSi within the CPA; here, the indexes (A,B,C) refer to the corresponding positions in the unit cell. The magnetic structure was subsequently investigated both by calculating the exchange constants and the resulting configuration at K and by calculating a possible (collinear) disordered local moment state at the central site. However, in all cases the outcome was a ferromagnetic ground state.
What is missing within the CPA description is the short-range configurational order, i.e., the possibility to describe clustering of MnA,C atoms around MnB atoms. We speculate that this swap and clustering causes the canting of some MnB moments by interaction with the neighboring MnA,C atoms and is therefore essential for the appearance of the re-entrant behavior (such a scenario was already suggested in Ref. Niculescu76, ). Possibly, as the temperature is increased, the canting of the MnB moments is reduced on the average and the total magnetization increases; this hypothesis would require a weak coupling of the canted MnB moments to their MnA,C neighbors compared to the coupling of the non-canted MnB moments to their FeA,C neighbors.
Our hypothesis is supported by the following experimental findings. (i) The re-entrant behavior and the swap appear in the same concentration range (). (ii) The re-entrant behavior is sensitive to the heat treatment of the alloy; after proper annealing, it was found that the re-entrant behavior smoothens, although does not change.Yoon77 This, in conjunction with the calculations showing that the un-swapped state is the ground state, suggests that annealing causes a fraction of the Mn atoms to return from the A,C site to the B-site, so that the number of Mn clusters (and canted Mn moments, as we suspect) lessens. If this hypothesis is true, should be indeed unaffected by annealing, because it would correspond to a finite-size effect (characteristic exchange-energy scale of a small cluster) rather than a phase transition. Such a possibility has been suggested by Nielsen and collaborators,Nielsen96 based on Monte Carlo calculations of model systems. (iii) Clustering would result in a local environment which is closer to Mn3Si, which is known to show antiferromagnetic behavior.
Furthermore, it is observed that the “smoothening” of the re-entrant behavior after annealing is accompanied by an increase of both and (shown in Fig. 7 of Ref. Yoon77, for Fe1.75Mn1.25Si). We therefore make the plausible assumption that this behavior is present also at concentrations , and that the ground state, with all Mn atoms being at the B-site, will show a higher magnetic moment than . This could resolve the discrepancy between the measuredYoon77 magnetization value of compared to calculated value of 3 in Fe2MnSi.
VIII Conclusion
The electronic and magnetic structure of the magnetic intermetallic alloy Fe3-xMnxSi, for has been investigated using density-functional theory within the GGA, together with the CPA to describe disorder. We find that important experimental findings, such as the trends of the magnetization and of the Curie temperature as a function of concentration, are reproduced. They can be interpreted in terms of single-particle energies with the help of the density of states, by using simple physical arguments, namely symmetry-dependent hybridization of wavefunctions and local charge neutrality. Quantitatively, the drop of the magnetization as a function of Mn concentration is underestimated, especially at , however this could be due to Mn-Fe swap and Mn clustering in experiment that cannot be captured by the CPA; the same applies to the re-entrant behavior. It is therefore worthwhile to investigate Fe3-xMnxSi beyond this approximation in the future.
However, it is rather surprising that the two most common approximations to DFT, namely the LSDA and the GGA, give ground states that differ at low concentration not only quantitatively but also qualitatively, although they almost agree on the single-particle spectrum. The superiority of GGA that we find here is common but certainly not general, which shows the need for theory to go hand-in-hand with experiment for the understanding of magnetic intermetallic compounds.
Concerning the relevance to spintronics, the most important finding here is the continuous variation of the spin polarization at over a wide range, between for , i.e., in the region where theory and experiment are in reasonable agreement and before the onset of the re-entrant behavior. Since the polarization at is a property that is notoriously difficult to measure with precision, the variation which is found theoretically could be used to improve or calibrate the methods of measurement of in a single type of material, so that spurious effects in measurement can be treated on the same footing and understood better.
References
- (1) V. Niculescu, T. J. Burch, and J. I. Budnick, J. Magn. Magn. Mater. 39, 223 (1983).
- (2) S. Yoon and J.G. Booth, J. Phys. F: Metal Phys. 7, 1079 (1977).
- (3) S. Fujii, S. Ishida, and S. Asano, J. Phys. Soc. Jpn. 64, 185 (1995).
- (4) K. Hamaya, H. Itoh, O. Nakatsuka, K. Ueda, K. Yamamoto, M. Itakura, T. Taniyama, T. Ono, and M. Miyao, Phys. Rev. Lett. 102, 137204 (2009).
- (5) T.J. Burch, T. Litrenta, and J.I. Budnick, Phys. Rev. Lett. 33, 421 (1974).
- (6) S. Pickart, T. Litrenta, T. Burch, and J.I. Budnick, Phys. Lett. 53A, 321 (1975).
- (7) A.C. Swintendick, Solid State Commun. 19, 511 (1974).
- (8) S. Yoon and J.G. Booth, Phys. Lett. 48A, 381 (1974).
- (9) V. Niculescu, K. Raj, T. J. Burch, and J. I. Budnick, Phys. Rev. B 13, 3167 (1976).
- (10) K. R. A. Ziebeck and P. J. Webster, Philosoph. Mag. 34, 973 (1976).
- (11) S.H. Mahmood, A.-F. Lehlooh, A.S. Saleh, and F.E. Wagner, Phys. Stat. Sol. (b) 241, 1186 (2004).
- (12) J. G. Booth, J. E. Clark, J. D. Ellis, P. J. Webster, and S. Yoon, Proc. Int. Conf. Magnetism Vol. IV, Moscow, p.557 (1974).
- (13) T. Nagano, S. Uwanuyu, M. Kawakami, J. Magn. Magn. Mater. 140,123 (1995).
- (14) T. Ersez, S.J. Kennedy, and T.J. Hicks, J. Phys.: Condens. Matter 8, 7771 (1996).
- (15) T. F. Smith, G. K. Bristow, C. V. Boughton, and P. R. W. Hudson, J. Phys. F: Metal Phys. 10, 2867 (1980).
- (16) J. R. Miles, T. F. Smith, and T. R. Finlayson, Aust. J. Phys. 41, 781 (1988).
- (17) P. Mohn and E. Supanetz, Philosoph. Mag. B 78, 629 (1998).
- (18) A. Go, M. Pugaczowa-Michalska, and L. Dobrzyński, Eur. Phys. J. B 59, 1 (2007).
- (19) B. Hamad, J. Khalifeh, I.A. Aljarayesh, C. Demangeat, H.-B. Luo, and Q.-M. Hu, J. Appl. Phys. 107, 093911 (2010).
- (20) M. Szymański, M. Jankowski, L. Dobrzyński, A. Wiśniewski, and S. Bednarski, J. Phys.: Condens. Matter 3, 4005 (1991).
- (21) P.J. Brown, K.R.A. Ziebeck and J.M. Huntley, J. Magn. Magn. Mater. 50, 169 (1985).
- (22) J.P. Perdew, J.A. Chevary, S.H. Vosko,K.A. Jackson, M.R. Pederson, D.J. Singh, and C. Fiolhais, Phys. Rev. B 46, 6671 (1992).
- (23) S. H. Vosko, L. Wilk, and N. Nusair, Can. J. Phys. 58, 1200 (1980).
- (24) M. Asato, A. Settels, T. Hoshino, T. Asada, S. Blügel, R. Zeller, and P. H. Dederichs, Phys. Rev. B 60, 5202 (1999).
- (25) The SPR-TB-KKR package, H. Ebert and R. Zeller, http://olymp.cup.uni-muenchen.de/ak/ebert/SPR-TB-KKR
- (26) N. Stefanou and R. Zeller, J. Phys.: Condens. Matter 3, 7599 (1991); N. Stefanou, H. Akai, and R. Zeller, Computer Phys. Commun. 60, 231 (1990).
- (27) M. Weinert, E. Wimmer and A. J. Freeman, Phys. Rev. B 26, 4571 (1982)
- (28) Ph. Kurz, F. Förster, L. Nordström, G. Bihlmayer, and S. Blügel, Phys. Rev. B 69, 024415 (2004).
- (29) M. Ležaić, Ph. Mavropoulos, G. Bihlmayer, S. Blügel unpublished.
- (30) http://www.flapw.de
- (31) A.I. Liechtenstein, M.I. Katsnelson, V.P. Antropov, and V.A. Gubanov, J. Magn. Magn. Mater. 67 65 (1987).
- (32) E. Sasioglu, L.M. Sandratskii, P. Bruno, and I. Galanakis Phys. Rev. B 72, 184415 (2005).
- (33) I. Turek, J. Kudrnovský, V. Drchal, and P. Bruno, Philos. Mag. 86, 1713 (2006).
- (34) M. Ležaić, Ph. Mavropoulos, and S. Blügel Appl. Phys. Lett. 90, 082504 (2007).
- (35) M. Pajda, J. Kudrnovský, I. Turek, V. Drchal, and P. Pruno, Phys. Rev. B 64, 174402.
- (36) P. Buczek, A. Ernst, P. Bruno, and L.M. Sandratskii, Phys. Rev. Lett. 102, 247206 (2009).
- (37) F. Lechermann, F. Welsch, C. Elsässer, C. Ederer, M. Fähnle, J. M. Sanchez, and B. Meyer, Phys. Rev. B 65, 132104 (2002).
- (38) I. Galanakis, P. H. Dederichs, and N. Papanikolaou, Phys. Rev. B 66, 174429 (2002); I. Galanakis, Ph. Mavropoulos and P. H. Dederichs, J. Phys. D 39, 765 (2006).
- (39) H. Kepa, T.J. Hicks, and R.L. Davis, Mater. Sci. Forum 27-28, 267 (1988).
- (40) T. Ersez, S.J. Kennedy, and T.J. Hicks, J. Phys.: Condens. Matter 7, 8423 (1995)
- (41) M. Nielsen, D. H. Ryan, H. Guo, and M. Zuckermann, Phys. Rev. B 53, 343 (1996).
- (42) M. Jarrell and H.R. Krishnamurthy, Phys. Rev. B 63 125102 (2001); D.A. Rowlands, J.B. Staunton, and B.L. Györffy Phys. Rev. B 67 115109 (2003); D. Ködderitzsch, H. Ebert, D.A. Rowlands, and A. Ernst, New J. Phys. 9, 81 (2007).
- (43) R. Zeller, J. Phys.: Condens. Matter 20, 294215 (2008).