Object-X: The Brightest Mid-IR Point Source in M33
Abstract
We discuss the nature of the brightest mid-IR point source (which we dub Object X) in the nearby galaxy M33. Although multi-wavelength data on this object have existed in the literature for some time, it has not previously been recognized as the most luminous mid-IR object in M33 because it is entirely unremarkable in both optical and near-IR light. In the Local Group Galaxies Survey, Object X is a faint red source visible in and H but not or . It was easily seen at in the 2MASS survey. It is the brightest point source in all four Spitzer IRAC bands and is also visible in the MIPS 24 band. Its bolometric luminosity is . The source is optically variable on short time scales (tens of days) and is also slightly variable in the mid-IR, indicating that it is a star. Archival photographic plates (from 1949 and 1991) show no optical source, so the star has been obscured for at least half a century. Its properties are similar to those of the Galactic OH/IR star IRC+10420 which has a complex dusty circumstellar structure resulting from episodic low velocity mass ejections. We propose that Object X is a evolved star obscured in its own dust ejected during episodic mass loss events over at least half a century. It may emerge from its current ultra-short evolutionary phase as a hotter post-RSG star analogous to M33 Var A. The existence and rarity of such objects can be an important probe of a very brief yet eventful stellar evolutionary phase.
1 Introduction
Explaining mass loss from massive stars, especially episodic mass loss in evolved massive stars, is one of the outstanding problems in stellar evolution theory. Systematic studies of rare, luminous, dusty massive stars in nearby galaxies were carried out in parallel by Bonanos et al. (2009, 2010) for the Large and Small Magellanic Clouds (LMC and SMC), and Thompson et al. (2009) and Khan et al. (2010) for M33, NGC 300, M81, and NGC 6946. Luminous blue variables (LBVs), supergiant B[e] (sgB[e]), some Wolf-Rayet stars (WRs) and red supergiants (RSGs) contribute to this class of objects, and their rarity implies they are a very short but perhaps critical stage in the evolution of massive stars. Given that the LBV mass loss mechanism is poorly understood (Humphreys & Davidson 1994; Smith & Owocki 2006) and that there is mounting evidence for some core collapse supernovae with dust enshrouded progenitors (Prieto et al. 2008; Thompson et al. 2009) or very recent mass loss episodes (Gal-Yam et al. 2007; Smith et al. 2008, and references therein), a census of these stars in nearby galaxies is vital for understanding the mass loss mechanisms and final stages of evolution of massive stars.
Bonanos et al. (2009, 2010) cross-matched massive stars with known spectral types with the SAGE and SAGE-SMC photometric databases, which resulted in a multi-band photometric catalog from 0.3 to 24m providing spectral energy distributions (SEDs) for most classes of hot and cool stars. These works showed that in the LMC and the SMC, the LBVs, RSGs, and sgB[e] stars are some of the most-luminous mid-IR sources, due to the combination of high actual luminosities with surrounding dust from recent episodic mass ejections. However, these studies required the presence of a bright optical, spectroscopically classified source. The opposite approach, focusing on bright mid-IR sources, was undertaken by Thompson et al. (2009) and Khan et al. (2010).
The Thompson et al. (2009) re-analysis of the McQuinn et al. (2007) mid-IR images of M33 focused on detecting extremely red (optically thick even at 3.6m) analogs of the progenitors of SN 2008S and the NGC 300 optical transient, finding that such analogs are extremely rare. Less red, but more luminous, stars are still rare, and only in some cases do they correspond to LBVs and other spectroscopically classified evolved stars. In Khan et al. (2010), we carried out a systematic mid-IR photometric search for self-obscured stars in four galaxies: M33, NGC 300, M81, and NGC 6946. In particular, we confirmed the conclusion of Thompson et al. (2009) that stars analogous to the progenitors of SN 2008S and NGC 300 transients are truly rare—there may be as few as per galaxy at any given moment. This result empirically supports the idea that the dust-enshrouded phase is a very short-lived phenomenon in the lives of some massive stars.
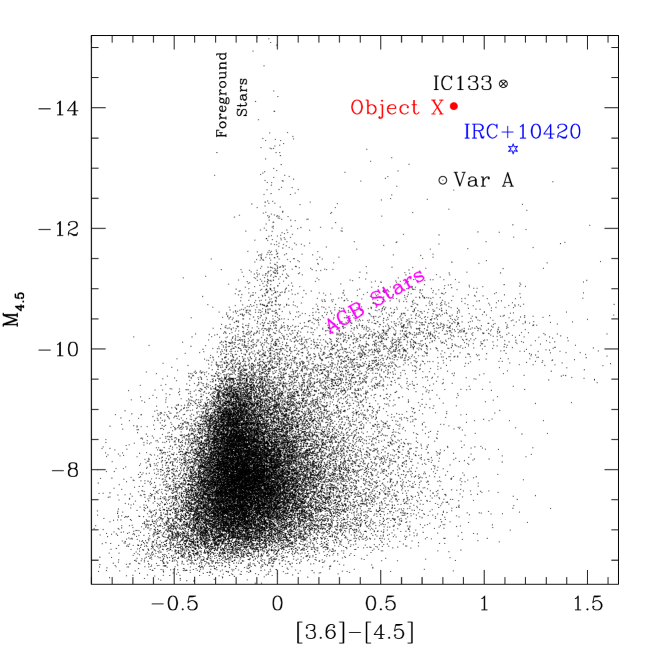
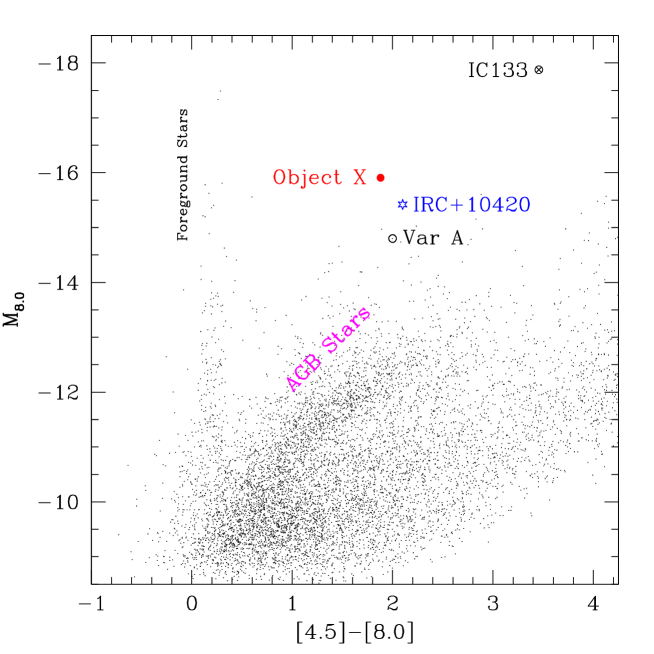
At this point, we set out to examine the most luminous mid-IR sources in M33 that had not been considered by either Thompson et al. (2009) or Khan et al. (2010). In this paper, we discuss the nature of the brightest mid-IR star in M33. We started by examining the brightest objects off the primary stellar locus in the mid-IR CMD of M33 (Figure 1, adopted from Thompson et al. 2009, also see Figure 2). The brightest source is a known compact, young star cluster IC133. It is spatially unresolved by Spitzer, but immediately recognizable as a star cluster. It is both too luminous to be a single star () and its mid-IR SED peaks at a temperature (K) that is too cold for dust associated with material ejected by a single star (because the required mass ). The second brightest source, the brightest mid-IR star in all of M33, is the subject of this paper. We call this star, located at R.A.=1h33m241 and Dec.=+30°25′348 (J2000.0), “Object X”.
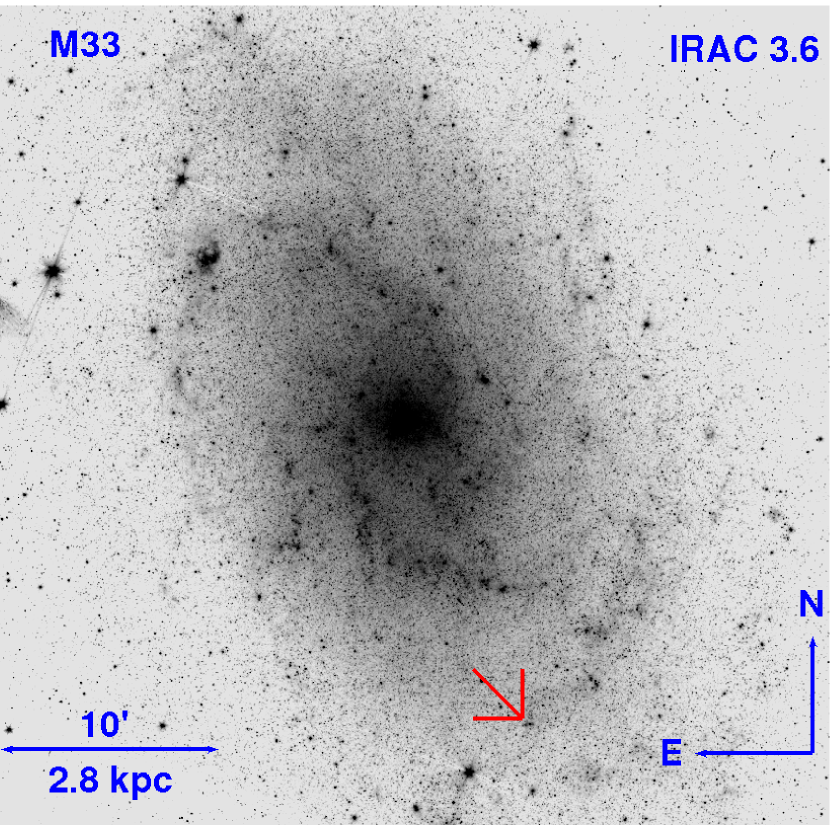
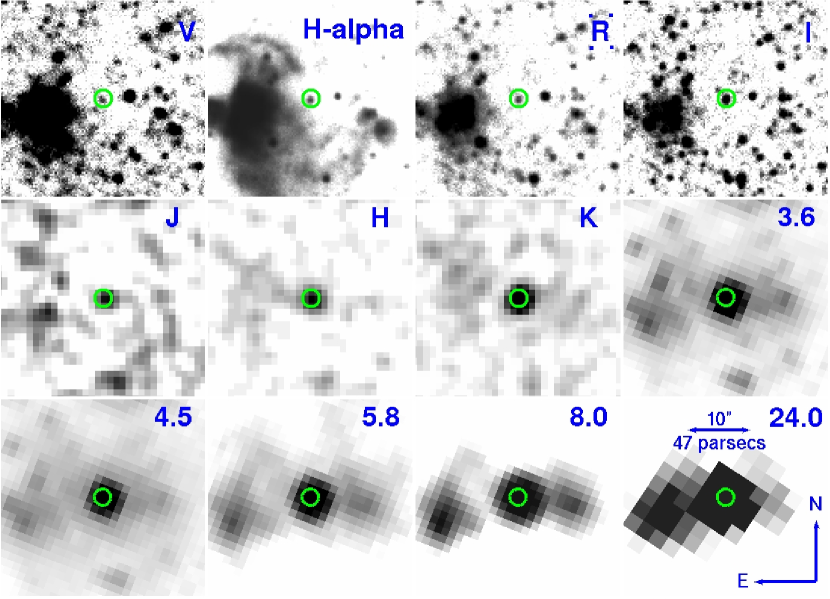
Figure 3 shows its location in M33, and Figure 4 shows the -band through 24 band images of its surrounding region based on the data we describe in Section 2. Section 3 presents the SED and simple models of it. Section 4 discusses the possible explanations of the physical nature of Object X and its implications for understanding the late-stage evolution of the most massive stars.
2 Data
The optical photometry ( and H) was measured from the Local Group Galaxies Survey images (Massey et al. 2006). The catalog of M33 point sources published by Massey et al. (2006) does not include Object X as a point source because it did not satisfy their criterion that it is 4 sigma above the background. We used DAOPHOT/ALLSTAR (Stetson 1992) to identify point sources in the bands. Object X is identified as a relatively faint and red point source in the bands with a detection. However, it is not detected in the and bands. We estimated upper limits on its luminosity in these bands using the APPHOT/PHOT package. The measured magnitudes and the limits were transformed to the Vega-calibrated system using zero-point offsets determined from the bright stars in the Massey et al. (2006) catalog of M33 point sources.
The near-IR () images were taken from the 2MASS survey (Skrutskie et al. 2006) and the calibrated magnitudes were obtained from the 2MASS All-Sky Catalog of Point Sources (Cutri et al. 2003).
For the mid-IR photometry, we used the six co-added epochs of data from McQuinn et al. (2007) as processed and used by Thompson et al. (2009) and Khan et al. (2010). For the MIPS 24 band, we downloaded the Post-Basic Calibrated Data (PBCD) from the Spitzer archive (Program 5, PI: Gehrz). Although we examined the MIPS 70 and 160 images for the target region as well, we were unable to obtain reliable flux measurements due to the nearby H II region being extremely luminous in these two bands. We measured the magnitudes using DAOPHOT/ALLSTAR (Stetson 1992). The PSF-magnitudes obtained with ALLSTAR were transformed to Vega-calibrated magnitudes using aperture corrections derived from bright stars using the APPHOT/PHOT package. Figures 1 and 2 show the mid-IR CMDs of M33.
The measured fluxes are reported in Table 1, and -band through 24 band images of Object X are shown in Figure 4.
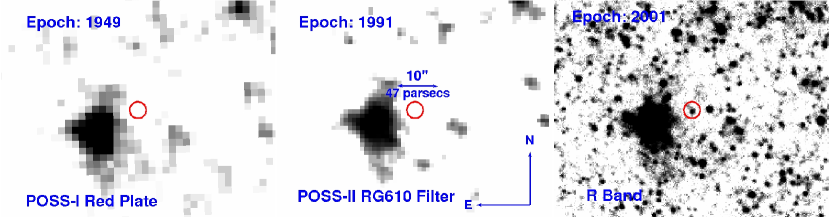
We also examined the photographic plates from the 48 inch Oschin Schmidt Telescope used in the STScI Digitized Sky Survey. The first image (epoch 1949) was a POSS-I Red Plate, while the second (epoch 1991) was a POSS-II RG610 filter. Both of these are roughly comparable to the modern standard -band. Neither image shows an optical source at the location of Object X. These images are much shallower than the Local Group Survey (Massey et al. 2006). Based on the faintest -band USNO stars in this region and calibrating them by their counterparts in Massey et al. (2006), we estimate an upper limit of R magnitude for Object X in 1949. This is consistent with our detection of Object X at R (epoch 2001). The epoch 1991 image also does not show a source, but we were unable to converge on a self-consistent calibration for the region, and so will not discuss this image further. Figure 5 shows these historical images of this region.
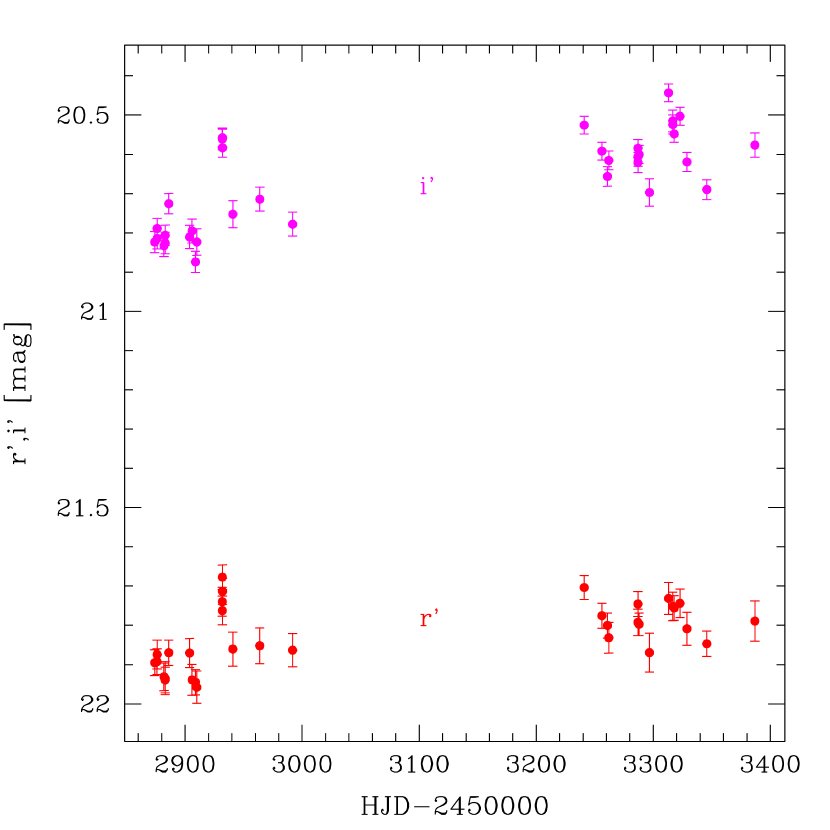
Object X is identified as an optically variable point source in the Canada-France-Hawaii Telescope (CFHT) photometric survey of M33 (Hartman et al. 2006). Figure 6 shows the and band lightcurves of Object X from this survey. The correlated short-term variability of magnitude (fractional variability of 45%), definitively indicates that it is a single stellar object rather than multiple objects blended together. If we were to dilute the source with additional non-variable sources of comparable total luminosity, the observed magnitude variability would be unphysical. This is significant given the lack of archival HST images for this location.
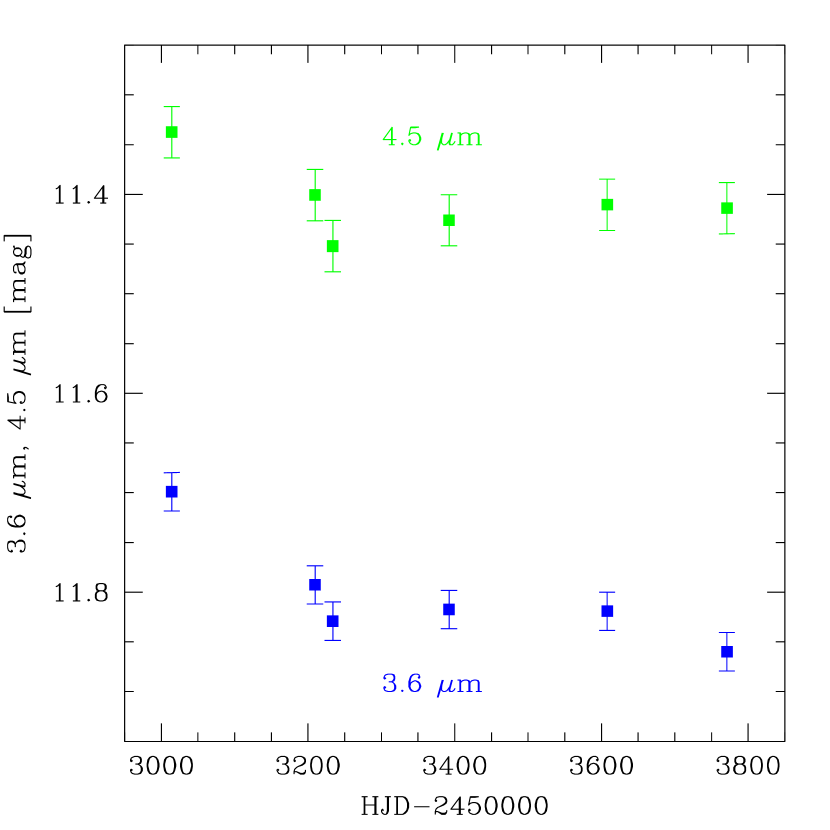
McQuinn et al. (2007) collected six epochs over two years and identified Object X as a variable source in the mid-IR, although for this paper, we use the mid-IR lightcurves generated by Thompson et al. (2009). Figure 7 shows the 3.6 and 4.5 band lightcurves. Object X shows correlated variability of about 0.15 magnitude in both bands (fractional variability of 15%). This suggests that the dust opacity and geometry surrounding Object X are not undergoing any rapid evolution.
3 Analysis
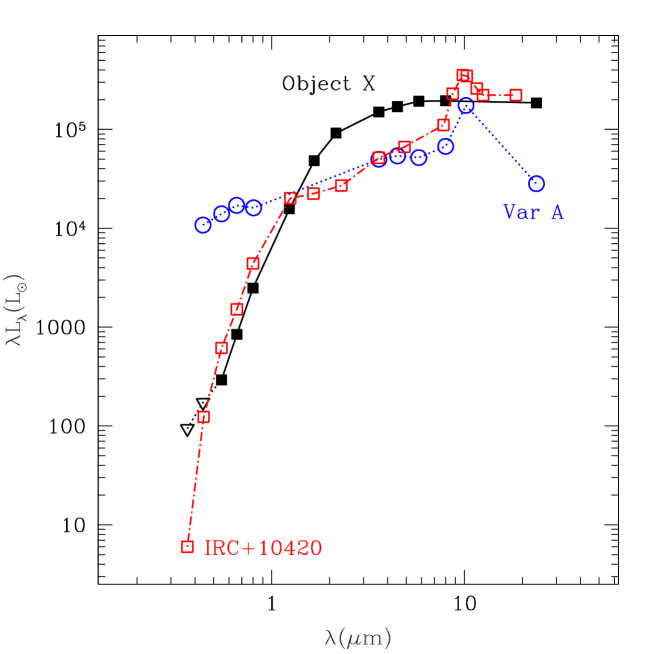
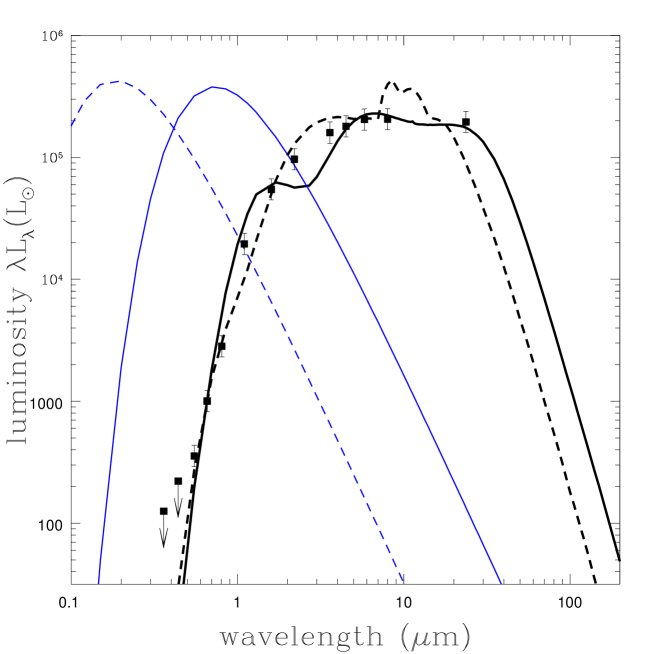
Figure 8 shows the spectral energy distribution (SED) of Object X.
The low optical luminosity means that Object X is unlikely to be
a YSO embedded in a dusty disk, and if we model the SED using the YSO models of
Robitaille et al. (2006), we find no good, or even plausible fits111We fit the SED using the online tool (Robitaille et al. 2007) at
http://caravan.astro.wisc.edu/protostars/sedfitter.php.. In essence, 1% of the luminosity is emitted in the optical, while even edge-on YSO disk models tend to scatter more optical light into the observer’s line of sight.
The alternate is that we are examining a self-obscured star. For this case, we fit the SED of the source using DUSTY (Ivezic & Elitzur 1997; Ivezic et al. 1999; Elitzur & Ivezić 2001) to model the radiation transfer through a spherical dusty medium surrounding a star. We considered models using either the graphitic or silicate dust models of Draine & Lee (1984). We distributed the dust either as a shell, with ratios of outer to inner radii of either 2:1 or 4:1, or with the standard DUSTY wind model. The density distributions inside the shells were assumed to be . The models are defined by the stellar luminosity, , stellar temperature, , the V-band optical depth , and the dust temperature at the inner edge of the dust distribution, . The stellar luminosity and the dust temperature together determine the radius of the inner edge of the dust distribution. To fit the data we tabulated the DUSTY models on a grid of stellar temperatures, optical depths and dust temperatures.
We find that two dust types that can fit the SED equally well but with very different preferred stellar temperatures. The graphitic models prefer cool stars, K, while the silicate models prefer hot stars, K. The stellar luminosity is to with the silicate models favoring the somewhat higher luminosities (see Figure 9). The three different dust geometries produce similarly good statistical fits. For the fits we assumed minimum flux uncertainties of 20% and included the optical upper limits as constraints, leading to for for the best fits. Each model was a modestly poor match to some part of the SED, but this is not very surprising given our use of a simple spherical model and a discrete sampling of its parameter space. A clear detection (or not) of the silicate dust feature near 10 would determine the dust composition. The typical optical depths and inner/outer dust temperatures were and / K for the graphitic models, and and / K for the silicate models. Much of this difference is created by the higher scattering opacities of the silicate dust. The inner edge of the dust lies at R1016.3 cm for the graphitic models and R1015.8 cm from the silicate models.
Based on the CO and H I data from (Gratier et al. 2010), the estimated column density at the location of Object X is atoms/cm2 (P. Gratier, private communication), where the higher number comes from using the CO to estimate the amount of H2. For a standard Galactic dust to gas ratio of mag cm2/atom (Bohlin et al. 1978), this implies a maximum foreground extinction in M33 of roughly 1.2 magnitude. Adding this to the Galactic extinction changes the DUSTY models very little, modestly reducing the optical depths () and slightly raising the stellar luminosity (by 20%).
If we search the Padova stellar models (Marigo et al. 2008) for stars with such luminosities, there are examples with both the high and low stellar temperatures, although the higher temperature stars of the silicate models are preferred. The stellar masses are always , but without an independent constraint on the stellar temperature it is difficult to say more. In many, but not all cases, the stars have lost significant fractions of their initial masses.
We also note that while stars ordinarily do not have significant H emission, Object X is a strong H source. We determine this by using difference imaging methods to match the H image to the flux scale and PSF structure of the -band image and then subtract. All the normal stars disappear to leave us only with the stars having significant H emission. In practice, we use the ISIS image subtraction software package (Alard & Lupton 1998; Alard 2000) following the procedures of Khan et al. (2010). Figure 10 shows the result of this procedure for the region around Object X. It is clear from the subtracted image that Object X is a strong H emission source.
4 Discussion
An evolved star can cloak itself in dust through two broad mechanisms, winds and mass ejection. The classic examples of wind obscured stars are the AGB stars. In the most extreme cases, such as the progenitors of SN 2008S and the 2008 NGC 300 transient, the wind can be optically thick even in the mid-IR (Prieto et al. 2008). Shells formed by impulsive mass ejections are seen around many evolved massive stars (e.g., Humphreys & Davidson 1994; Humphreys et al. 1997; Smith & Frew 2010; Gvaramadze et al. 2010; Wachter et al. 2010), and they are distinguished by the frequency of the ejections, their mass, and their velocities. The most famous example is the “Great Eruption” of Carina in the 19th century, which ejected of material at velocity kms-1 (Humphreys & Davidson 1994). At the other end of the velocity spectrum are the OH/IR stars such as IRC+10420, where the ejection velocities are closer to kms-1 (Tiffany et al. 2010).
Our best constraint on these possibilities comes from the time variability of the source. The absence of the source in 1949 means that the star has been obscured for at least 60 years, but the SED models require fairly hot dust close to the star. If we assume that the material obscuring the star today is the same as that obscuring the star in 1949, we get characteristic velocities of the order of kms-1 and kms-1 for the graphitic and silicate models, respectively. The outer edge then requires a velocity twice as large for a shell with a 2:1 ratio between the inner and outer edges. These velocity scales favor the slower ejections of the OH/IR stars over the higher velocities of the giant LBV eruptions like Carina. The significant optical and mid-IR variability then favors a patchy evolving ejecta over a steady wind. The extended period of the obscuration comes close to requiring multiple ejections, approaching the limit of an unsteady wind. It would be interesting to determine if the source was visible in still older archival plates, if any exist, since it would be a relatively bright mag source without the dust.
Overall, Object X seems to most closely resemble the cool, hypergiant, stars such as IRC+10420 and Var A. The three sources have comparable bolometric luminosities of , although their SEDs, shown in Figure 8, differ because Object X is more obscured. In the case of IRC+10420, the star is surrounded by a series of shells and seems to have undergone a period of high mass loss for the last years (Humphreys et al. 1997) that ended 50-100 years ago leading to its current optical brightening (Blöcker et al. 1999). Var A, on the other hand, seems to have had a brief period of high mass loss rates over the last years and is now re-emerging in the optical (Humphreys et al. 2006). Object X would seem to be intermediate, requiring a longer period of heavy mass loss than Var A, but perhaps less than IRC+10420. If Object X is a true analog to IRC+10420 or Var A, then it may conceivably emerge from its current self-obscured state over the next few decades since the optical depth of an expanding shell drops as . We cannot make this statement with any degree of certainty, as each of these objects are going through tumultuous evolutionary phases that are both unique and poorly understood. Follow-up observations of this source at all wavelengths should begin to reveal its long term evolution and may provide us with unexpected surprises. Deep optical and IR spectra of Object X will enable to us to determine the spectral type of the central star and place it on an H-R diagram.
Stars like Object X are extremely rare. As a unique star in a brief yet eventful evolutionary state, we encourage further study of this interesting object. Furthermore, there is mounting evidence that mass loss from massive stars may be dominated by impulsive transients rather than steady winds (e.g., Smith & Owocki 2006), particularly with the downward revision of mass-loss rates in recent years (e.g., Fullerton et al. 2006). If so, the period in which mass loss is most important will also tend to be the period when the star is most obscured. Surveys of massive stars such as those by Massey et al. (2006) and Bonanos et al. (2009, 2010), which focus on bright optical sources, will miss Object X and similar sources that may best probe the frequency and duration of these mass loss episodes as well as the amount of ejected mass. Characterizing these stars and the amount of mass loss by massive stars clearly requires systematic surveys in the mid-IR as well as the optical.

| Band | Magnitude | Flux | Luminosity | Year |
|---|---|---|---|---|
| (mJy) | (log()) | |||
| 1.98 | 2001 | |||
| 2.24 | 2001 | |||
| 2.467 | 2001 | |||
| 2.927 | 2001 | |||
| 3.395 | 2001 | |||
| 4.197 | 2001 | |||
| 4.684 | 2001 | |||
| 4.963 | 2001 | |||
| 3.6 | 5.177 | 2004 | ||
| 4.5 | 5.230 | 2004 | ||
| 5.8 | 5.286 | 2004 | ||
| 8.0 | 5.290 | 2004 | ||
| 24.0 | 5.268 | 2005 |
References
- Alard (2000) Alard, C. 2000, A&AS, 144, 363
- Alard & Lupton (1998) Alard, C. & Lupton, R. H. 1998, ApJ, 503, 325
- Blöcker et al. (1999) Blöcker, T., Balega, Y., Hofmann, K., Lichtenthäler, J., Osterbart, R., & Weigelt, G. 1999, A&A, 348, 805
- Bohlin et al. (1978) Bohlin, R. C., Savage, B. D., & Drake, J. F. 1978, ApJ, 224, 132
- Bonanos et al. (2006) Bonanos, A. Z., Stanek, K. Z., Kudritzki, R. P., Macri, L. M., Sasselov, D. D., Kaluzny, J., Stetson, P. B., Bersier, D., Bresolin, F., Matheson, T., Mochejska, B. J., Przybilla, N., Szentgyorgyi, A. H., Tonry, J., & Torres, G. 2006, ApJ, 652, 313
- Bonanos et al. (2009) Bonanos, A. Z. et al. 2009, AJ, 138, 1003
- Bonanos et al. (2010) —. 2010, AJ, 140, 416
- Cutri et al. (2003) Cutri, R. M. et al. 2003, 2MASS All Sky Catalog of point sources., ed. R. M. Cutri et al.
- Draine & Lee (1984) Draine, B. T. & Lee, H. M. 1984, ApJ, 285, 89
- Elitzur & Ivezić (2001) Elitzur, M. & Ivezić, Ž. 2001, MNRAS, 327, 403
- Fullerton et al. (2006) Fullerton, A. W., Massa, D. L., & Prinja, R. K. 2006, ApJ, 637, 1025
- Gal-Yam et al. (2007) Gal-Yam, A. et al. 2007, ApJ, 656, 372
- Gratier et al. (2010) Gratier, P. et al. 2010, A&A, 522, A3+
- Gvaramadze et al. (2010) Gvaramadze, V. V., Kniazev, A. Y., & Fabrika, S. 2010, MNRAS, 405, 1047
- Hartman et al. (2006) Hartman, J. D., Bersier, D., Stanek, K. Z., Beaulieu, J., Kaluzny, J., Marquette, J., Stetson, P. B., & Schwarzenberg-Czerny, A. 2006, MNRAS, 371, 1405
- Humphreys & Davidson (1994) Humphreys, R. M. & Davidson, K. 1994, PASP, 106, 1025
- Humphreys et al. (1997) Humphreys, R. M. et al. 1997, AJ, 114, 2778
- Humphreys et al. (2006) —. 2006, AJ, 131, 2105
- Ivezic & Elitzur (1997) Ivezic, Z. & Elitzur, M. 1997, MNRAS, 287, 799
- Ivezic et al. (1999) Ivezic, Z., Nenkova, M., & Elitzur, M. 1999, arXiv:astro-ph/9910475
- Jones et al. (1993) Jones, T. J. et al. 1993, ApJ, 411, 323
- Khan et al. (2010) Khan, R., Stanek, K. Z., Prieto, J. L., Kochanek, C. S., Thompson, T. A., & Beacom, J. F. 2010, ApJ, 715, 1094
- Marigo et al. (2008) Marigo, P., Girardi, L., Bressan, A., Groenewegen, M. A. T., Silva, L., & Granato, G. L. 2008, A&A, 482, 883
- Massey et al. (2006) Massey, P., Olsen, K. A. G., Hodge, P. W., Strong, S. B., Jacoby, G. H., Schlingman, W., & Smith, R. C. 2006, AJ, 131, 2478
- McQuinn et al. (2007) McQuinn, K. B. W. et al. 2007, ApJ, 664, 850
- Prieto et al. (2008) Prieto, J. L. et al. 2008, ApJ Letters, 681, L9
- Robitaille et al. (2007) Robitaille, T. P., Whitney, B. A., Indebetouw, R., & Wood, K. 2007, ApJ Supplement, 169, 328
- Robitaille et al. (2006) Robitaille, T. P., Whitney, B. A., Indebetouw, R., Wood, K., & Denzmore, P. 2006, ApJ Supplement, 167, 256
- Schlegel et al. (1998) Schlegel, D. J., Finkbeiner, D. P., & Davis, M. 1998, ApJ, 500, 525
- Skrutskie et al. (2006) Skrutskie, M. F. et al. 2006, AJ, 131, 1163
- Smith et al. (2008) Smith, N., Chornock, R., Li, W., Ganeshalingam, M., Silverman, J. M., Foley, R. J., Filippenko, A. V., & Barth, A. J. 2008, ApJ, 686, 467
- Smith & Frew (2010) Smith, N. & Frew, D. J. 2010, arXiv:astro-ph/1010.3719
- Smith & Owocki (2006) Smith, N. & Owocki, S. P. 2006, ApJ, 645, L45
- Stetson (1992) Stetson, P. B. 1992, 25, 297
- Thompson et al. (2009) Thompson, T. A., Prieto, J. L., Stanek, K. Z., Kistler, M. D., Beacom, J. F., & Kochanek, C. S. 2009, ApJ, 705, 1364
- Tiffany et al. (2010) Tiffany, C., Humphreys, R. M., Jones, T. J., & Davidson, K. 2010, AJ, 140, 339
- Wachter et al. (2010) Wachter, S., Mauerhan, J. C., Van Dyk, S. D., Hoard, D. W., Kafka, S., & Morris, P. W. 2010, AJ, 139, 2330