Now at ]Department of Physics & Astrophysics, University of Delhi, Delhi 110007, India.
Now at ]Department of Physics and Astronomy, University of Rochester, New York 14627 USA.
Now at ]Department of Physics and Astronomy, University of Alabama, Tuscaloosa, Alabama 35487, USA.
The MINOS Collaboration
Measurement of the underground atmospheric muon charge ratio using the MINOS Near Detector
Abstract
The magnetized MINOS Near Detector, at a depth of 225 meters of water equivalent (mwe), is used to measure the atmospheric muon charge ratio. The ratio of observed positive to negative atmospheric muon rates, using 301 days of data, is measured to be . This measurement is consistent with previous results from other shallow underground detectors, and is lower than the measurement at the functionally identical MINOS Far Detector at a depth of 2070 mwe. This increase in charge ratio as a function of depth is consistent with an increase in the fraction of muons arising from kaon decay for increasing muon surface energies.
pacs:
13.85.Tp. 95.55.Vj, 95.85.RyI Introduction
High energy cosmic-ray primaries interact with nuclei in the upper atmosphere and produce showers which contain pions and kaons. These secondary mesons can either interact in further collisions in the atmosphere, or decay to produce atmospheric muons. Since the majority of primary cosmic-rays are protons, there is an excess of positively charged mesons in the showers, and consequently, the atmospheric muon charge ratio is larger than unity. A precise measurement of the atmospheric muon charge ratio can be used to constrain cosmic-ray shower models and, since atmospheric neutrinos are produced in conjunction with atmospheric muons, better determine atmospheric neutrino fluxes.
The differential muon production spectrum in extensive air showers can be parameterized as Gaisser (1990):
| (1) |
where is the muon surface energy and * is the zenith angle at the muon production point. Accounting for the curvature of the earth, this angle is geometrically related to the observed zenith angle ,
| (2) |
where is the radius of the Earth, and is the muon production height for horizontal muons. Assuming the mean column depth for the initial cosmic ray primary interaction to be 85 g/cm2 gives =30 kmLipari (1993). The two terms in Eq. (1) represent the contribution to muon production from pion and kaon decay respectively. The values =115 GeV and =850 GeV are the critical energies at the muon production height above which the pion and kaon interaction probability exceeds the decay probability. The larger value of implies that the kaon contribution to the muon flux, and therefore to the charge ratio, will be more significant at values of the vertical muon surface energy Eμcos* exceeding . The charge ratio is expected to increase as a consequence of the increasing kaon contribution to the muon flux because in high energy interactions, single ’s can be produced in associated production with strange baryons while single ’s cannot. The muon charge ratio is expected to decrease at even higher energies due to heavy flavor production Zas et al. (1993); Gaisser and Honda (2002) and changes in composition of the cosmic-ray primaries Aglietta et al. (2004); Derbina et al. (2005); Schreiner et al. (2009). However, as these latter two processes are expected to only affect the charge ratio at energies greater than those studied here they are not considered further.
Atmospheric muon charge ratio measurements utilizing deep underground detectors are typically higher in value than those produced using detectors which are shallower since they sample muons with a larger value of Eμcos*. A previous measurement of the muon charge ratio utilizing the MINOS Far Detector, at a depth of 2070 meters of water equivalent (mwe), reported a value of (stat.)(syst.) Adamson et al. (2007) for surface energies greater than 1 TeV. Another measurement Agafonova et al. (2010) of the charge ratio at TeV energies, conducted using the OPERA experiment located at a depth of 3800 mwe, is in good agreement with the MINOS Far Detector result. Atmospheric muon charge ratio measurements performed by the L3+C Achard et al. (2004), Bess-TEV Haino et al. (2004) and CMS Khachatryan et al. (2010) collaborations, for muons with surface energy Eμ above 10 GeV and below 300 GeV, are consistent with the 2001 world average of 1.268 Hebbeker and Timmermans (2002).
The MINOS Near and Far Detectors Michael et al. (2008) are large underground magnetic calorimeters at depths of 225 mwe and 2070 mwe respectively. The detectors are designed to study neutrino interactions from the Fermilab Neutrinos at the Main Injector (NuMI) beam Crane et al. (1995), but also trigger on atmospheric muons between beam spills. The depths of the MINOS detectors are ideal for making a measurement of the muon charge ratio at values of Eμcos* in the region dominated by the pion contribution and the transition region where the kaon contribution becomes significant. In this paper we present a measurement of the atmospheric muon charge ratio using the MINOS Near Detector. This result is then compared to the same measurement performed using the MINOS Far Detector Adamson et al. (2007).
This paper is organized as follows. Sections II and III describe the MINOS Near Detector and the atmospheric muon Monte Carlo simulation respectively. Section IV describes the criteria for selecting atmospheric muon tracks with correct charge sign identification. Section V outlines the technique used to combine the data collected from two detector magnetic field configurations to determine the atmospheric muon charge ratio. Section V also elaborates on the evaluation of the systematic uncertainties. Finally, Sec. VI presents the results of this analysis.
II The MINOS Near Detector
The MINOS Near Detector Michael et al. (2008) at Fermilab is a magnetized-steel and scintillator sampling calorimeter. It is located 94 m underground, with an approximately flat overburden of 225 mwe. Its dimensions are 3.8 m4.8 m16.6 m. The detector contains 282 vertical steel planes, each 2.54 cm thick. The scintillator layers are composed of either 64 or 96, 4.1 cm wide and 1 cm thick strips which vary in length from 2.5 to 4 m. The scintillator strips are rotated by 90∘ with respect to the previous layer to allow for three dimensional track reconstruction. The first 120 steel planes each have a scintillator layer attached to their surface. The scintillator layer of every fifth steel plane contains 96 strips, and is said to be fully instrumented. The remaining four planes in each set of five are partially instrumented and contain 64 strips. Of the last 162 steel planes, only every fifth plane has an attached scintillator layer. These scintillator layers are fully instrumented.
Scintillation light is collected by wavelength shifting fibers embedded in the scintillator strips. Each strip is coupled to a single pixel on a 64-pixel multi-anode photo-multiplier tube Tagg et al. (2005) by a clear fiber. Each PMT pixel is digitized continuously at a frequency of 53 MHz. The detector response for a candidate atmospheric muon event is recorded when either four strips in five sequential planes, or when strips from any 20 planes, register a signal above the 1/3 photo-electron dynode threshold within 151 ns.
The detector’s approximately toroidal magnetic field Michael et al. (2008) varies in strength from 2.1 T near the magnetic coil hole to 0.2 T near the periphery of the steel planes. The magnetic field can be oriented to focus either northerly going or . These magnetic field orientations will be referred to as “forward” and “reverse”, respectively. The detector is oriented horizontally and its long axis points 26.5548∘ west of north. The curvature induced by the magnetic field together with the three dimensional track reconstruction allows the determination of the charge sign of a muon traversing the detector.
III Simulated Atmospheric Muons
A sample of 42106 simulated atmospheric muon events are used to evaluate the analysis sensitivities and efficiencies, as well as to help assess systematic errors. Surface level muon events were generated by the HEMAS Scapparone (1998) atmospheric cascade simulation. Muons expected to intersect with the detector are propagated through a GEANT3 Agostinelli et al. (2003) model of the overburden and the MINOS Near Detector.
IV Event Selection
The selection criteria have been chosen to optimize the event selection efficiency observed in the data and the charge sign identification purity obtained from the Monte Carlo simulations. The data sample for this analysis consists of atmospheric muons with well-reconstructed energy and charge sign. Pre-selections are made to reject events that are not consistent with the passage of an atmospheric muon through the detector. Further selections are applied to ensure track reconstruction quality and good charge sign determination. A summary of the selection criteria, as well as the selection efficiencies and charge identification purities, can be found in Table 1.
This analysis uses data collected between 2006 and 2009. During the data taking period, the direction of the magnetic field was periodically changed between the two orientations referred to as forward and reverse magnetic field. The final reverse magnetic field exposure was 150.5 days. Equivalent exposures of forward magnetic field data were collected immediately following the reverse magnetic field data periods to reduce systematic uncertainties. A total of 7.16108 triggers were collected over a combined 301 day exposure.
IV.1 Pre-Selections and Track Quality
For an event to be included in this analysis it must possess a single downward-going atmospheric muon track, have been collected during a period of good detector run conditions, and have a reconstructed initial interaction point (RIIP) within 50 cm of the detector edge. If the reconstructed initial interaction point is further than 3 cm outside the detector volume the track is rejected. The curvature of the track is known to be poorly determined, and the track is rejected, if any scintillator strips hit are further than 3 cm from the reconstructed position of the track, or if the track does not pass through a region of the detector where there is scintillator on each layer of steel.
Track reconstruction errors may occur when the event contains a large amount of activity which is not related to the track. These extra hits degrade the charge sign determination and can be generated by muon bremsstrahlung, natural radioactivity, or by electrical and optical cross-talk between the channels on the multi-anode PMT Tagg et al. (2005). Events are rejected if more than 40% of the strips hit are not track-related. Muon tracks determined to be poorly reconstructed by internal consistency checks of the reconstruction algorithm are also removed from the data sample.
IV.2 Charge Sign Quality Selection
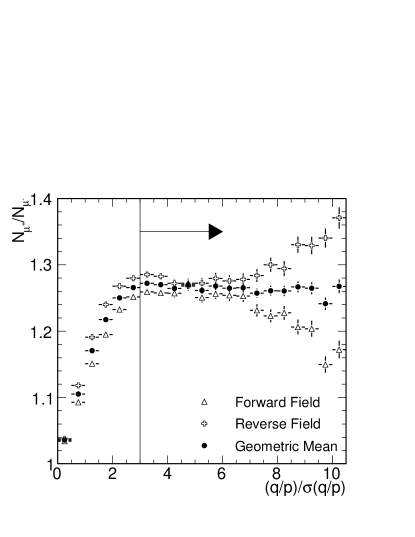
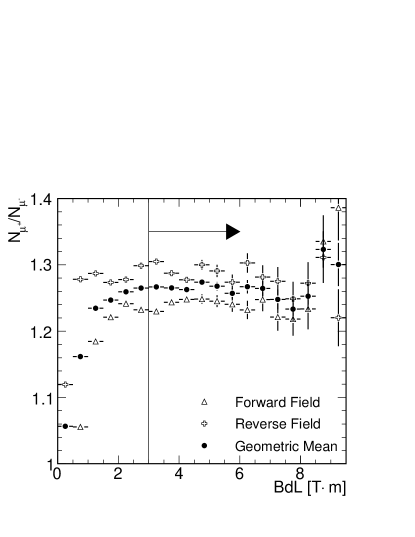
Two selection variables are used to further increase the degree of confidence in the assigned curvature and charge sign of the track. The Kalman filter Fruhwirth (1987) used in the track curvature fitting provides an uncertainty on the measured value of , where is the charge and the momentum of the track. The first charge sign quality selection is based on the value of determined by the track fitter. The second selection variable BdL is defined to be equivalent to where N is the total number of planes in the muon track, and Bi and dLi are the magnetic field and muon path length vectors, respectively, at plane i. A selection based on BdL is used to ensure that the magnitude of the bending due to curvature is larger than the apparent bending due to multiple scattering. Figure 1 shows the muon charge ratio as a function of and Fig. 2 the charge ratio as a function of , for data collected in both magnetic field orientations as well as the combined data set. The charge ratio for data collected during a single magnetic field orientation is defined as the ratio of positive to negative muons collected only in that orientation. The observed variation in the charge ratio above the selection thresholds in a single field orientation, as well as the difference in the charge ratio between the two different field orientations, stems from acceptance effects due to the magnetic field, detector asymmetry and detector alignment errors. The technique used to combine data taken in the two field orientations and remove these biases is discussed in the next section. For this analysis we required that and . Below these values the charge ratio tends towards unity, indicating a degradation of the charge sign determination. Events which have passed all the selections described in this section are used in the calculation of the atmospheric muon charge ratio described in the next section.
| Data | Monte-Carlo | |
| Selection | Charge ID | |
| Selection | Efficiency | Purity |
| Number of Triggers | 7.16 (100%) | - |
| Pre-Selections | ||
| Single Track Events | 3.18 (44.46%) | 70.7% |
| Detector Quality | 3.16 (44.19%) | 70.7% |
| Track Quality Selections | ||
| RIIP and Curvature Selections | 1.01 (14.19%) | 72.9% |
| Track-related Activity | 6.13 (8.56%) | 77.5% |
| Good Reconstruction | 5.31 (7.42%) | 78.8% |
| Charge Sign Quality Selections | ||
| 1.11 (1.55%) | 97.0% | |
| BdL 3.0 Tm | 3.23 (0.45%) | 99.5% |
V Charge Ratio Determination
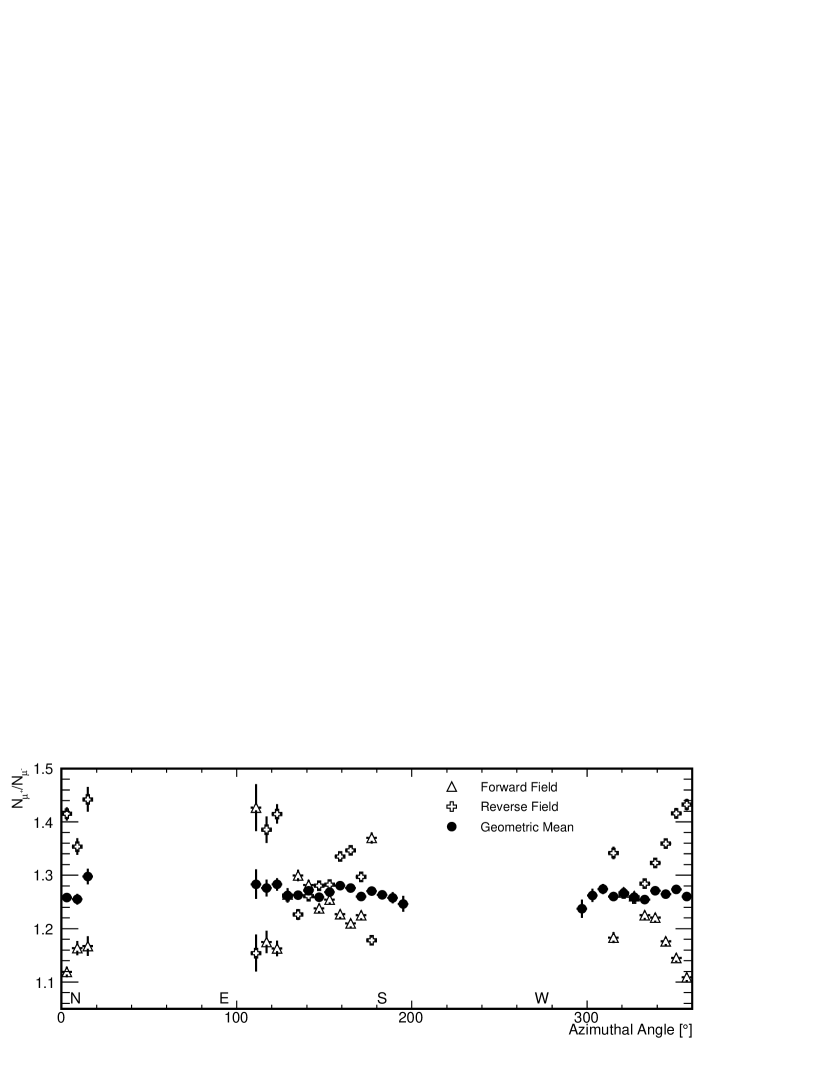
As demonstrated in the previous section acceptance effects in the Near Detector introduce a bias in the charge ratio when it is calculated using only data from a single magnetic field orientation. Figure 3 shows the charge ratio as a function of azimuthal angle, a variable sensitive to these biases, for the forward and reverse magnetic field data sets. Canceling these biases is done in the same manner as described in Adamson et al. (2007); Matsuno et al. (1984). If is the efficiency for the selection of and is the selection efficiency of in the forward field direction (FF) then the selection efficiencies for and in the reverse field direction (RF) are and respectively. Two independent equations for the charge ratio, and , can be constructed in which the acceptance effects cancel. These ratios, corrected for live time, are
| (3) |
and
| (4) |
where () is the number of positive (negative) muons observed during an exposure time t in a particular magnetic field orientation. The geometric mean of and
| (5) |
provides a measurement of the charge ratio that is free of biases due to geometric acceptance effects, alignment errors and the different magnetic field live times.
Figure 3 illustrates that the significant bias in the charge ratio, that is apparent in a single field orientation data set, is strongly suppressed in the geometric mean.
After the selection criteria in Table 1 have been applied we obtain a final data set of 3,234,066 events. In the forward field sample we select 893,854 and 721,428 . In the reverse field sample we select 912,944 and 705,840 . The resulting charge ratio obtained by applying Eq. (5) is =1.2660.001(stat.).
V.1 Systematic Uncertainties
The event selection criteria are chosen to remove events in which the charge sign of the muon track has been incorrectly assigned. Systematic uncertainties associated with event selection are determined by establishing the sensitivity of the measured charge ratio to variations in the selections above their thresholds. Two selections, track-related activity and , display variations in the observed charge ratio above their thresholds. These data were divided into three equal statistics samples, corresponding to increasing confidence in the muon charge sign, and their charge ratios calculated. The maximum deviation from the nominal charge ratio, 0.012 and 0.006 for the track related activity and selections respectively, is taken as the systematic uncertainty associated with that particular selection.
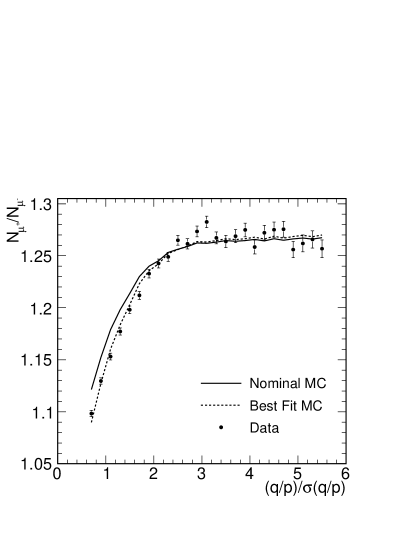
Another systematic uncertainty relates to the remaining events that have a misidentified charge sign after the selections. Since the atmospheric muon charge ratio is a value greater than unity more positive than negative muons will have their charge sign misidentified. Thus charge sign misidentification can only decrease the measured charge ratio resulting in a positive one-sided systematic uncertainty. Monte Carlo studies suggest that 0.5% of the events in the final data sample have an incorrect charge sign determination. However, one cannot discount the possibility that the misidentification rate is different in the data than in the Monte Carlo simulation. For this analysis it is assumed that the true charge sign misidentification rate in data differs from that in the nominal Monte Carlo by an energy independent factor . The true charge sign misidentification rate in data can be estimated by exploiting the fact that it influences the shape of the charge ratio versus curve shown in Fig. 1. A toy Monte Carlo was written to produce similar curves assuming a charge ratio Ra, and a charge sign misidentification rate equivalent to that in the nominal Monte Carlo scaled by a factor . The difference between the measured charge ratio and Ra for the values of and Ra that provide the best agreement between the data and the Monte Carlo prediction is taken as a systematic uncertainty on the measured charge ratio. Figure 4 plots the charge ratio as a function of , along with the nominal and best-fit Monte Carlo. The best fit Monte Carlo is obtained using a charge ratio of 1.272. A similar study was performed on the curvature of the charge ratio versus data in Fig. 2; in that study the best fit Monte Carlo is obtained with an actual charge ratio of 1.266. The maximum deviation of Ra from the nominal charge ratio is +0.006, which is taken as the one-sided systematic uncertainty associated with charge sign misidentification uncertainties.
Two alternative charge confidence selection criteria, similar in motivation to the , have been investigated. The first alternative required that the muon traverse at least 27 planes at positions covered by the partially instrumented scintillator planes, within 1.75 m of the magnetic coil hole. The second alternative required that at least 37 planes be traversed where the for each of those planes is greater than 0.03 Tm. These particular selection criteria have been chosen to optimize data selection efficiency while maintaining a charge misidentification rate in the Monte Carlo similar to that of the default selection. The maximum deviation from the nominal charge ratio was observed to be 0.003. This value is taken as the systematic uncertainty associated with the selection.
An imperfect reversal of the detector’s magnetic field would introduce a geometric bias and lead to a systematic uncertainty in the charge ratio stemming from imperfect acceptance asymmetry cancellation. This error can be determined by evaluating the charge ratios calculated using Eq. (3) and Eq. (4) since the quantities and will diverge as the magnitude of this bias increases. It is found that and agree to within their statistical uncertainties, indicating that the magnetic field bias is negligible compared to the statistical uncertainty.
| Uncertainty Classification | |
|---|---|
| Track-Related Activity | 0.012 |
| 0.006 | |
| Selection | 0.003 |
| Charge Misidentification | +0.006 |
| Total Systematic Uncertainty |
Table 2 lists the systematic errors that are discussed above, and their assigned values. Including systematic uncertainties the atmospheric muon charge ratio measured at the MINOS Near Detector is 1.2660.001(stat.)(syst.).
V.2 The Muon Charge Ratio Underground
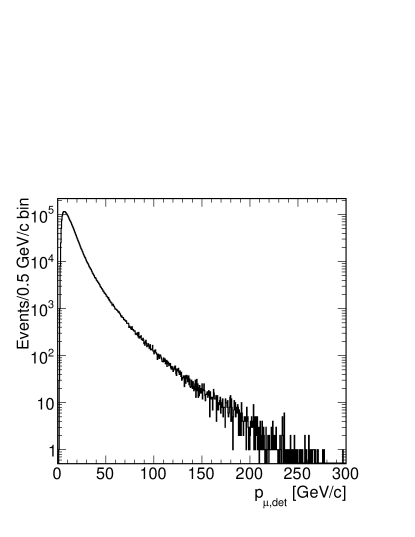
The maximum momentum for which the charge sign of a muon track can accurately be determined with the MINOS Near Detector is limited by the scintillator granularity and the strength of the magnetic field. The reconstructed momenta of all muon tracks which pass the selections outlined in Table 1 is shown in Fig. 5. The maximum momentum of muons used in this analysis is approximately 300 GeV; the mean momentum is 15 GeV. The observed charge ratio as a function of reconstructed track momentum underground is shown in Fig. 6. The charge ratio is observed to be flat as a function of track momentum to within the statistical uncertainty of the measurements.

VI The Atmospheric Muon Charge Ratio at the Surface
The muon energies measured at the Near Detector depth must now be converted to energies at the surface of the Earth by accounting for energy lost by the muons in the overburden above the detector. For muons, the energy loss in matter can be parameterized by
| (6) |
where X is the slant depth; a is the ionization term and the bn account for the radiative energy loss from bremsstrahlung, pair production and photo-nuclear processes. These parameters have a mild energy dependence, whose values for standard rock can be found in Yao et al. (2006). Using the technique outlined in Reichenbacher and
de Jong (2008), the energy lost by muons traversing the Near Detector overburden has been calculated as a function of reconstructed track energy and zenith angle. These energies have been calculated assuming a flat vertical overburden of 224.6 mwe, which is comprised of two distinct geological layers. Above the cavern hall lies 72.1 m of Dolomite/Shale bedrock with a density of 2.41 g/cm3, followed by 22.2 m of Glacial till with a density of 2.29 g/cm3. It has been suggested in Schreiner et al. (2009) that at the MINOS Near Detector depth the slightly higher rate of energy loss of over Smith et al. (1953); Barkas et al. (1956); Jackson and McCarthy (1972); Clark et al. (1972); Jackson (1998); Lee et al. (2005) could lead to a surface charge ratio that is slightly higher than that observed underground. However, as the magnitude of this effect is negligible when compared to the systematic uncertainties of this measurement we have assumed the same energy loss function for both charges.
The surface energy resolution obtained with this extrapolation method is dependent on the accuracy of the overburden model and the muon pointing accuracy. Topographical measurements of the Interior Geological Survery (2010) show that the surface altitude varies by no more than 13 m within 3 km of the detector. This contributes a 14% uncertainty on the surface energy estimation at all zenith angles. The zenith pointing resolution of the Near Detector has been determined to be 1.10.2∘ by measuring the zenith angle separation between the two muons in multi-muon cosmic-triggered events for which both muons pass the charge ratio selection criteria. The corresponding error on the surface energy is negligible for vertical muons increasing to 5% at 70∘,14% at 81∘, 25% at 85∘ and 50% at 87∘.
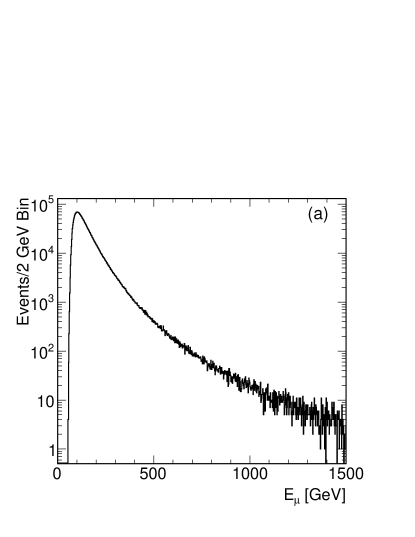
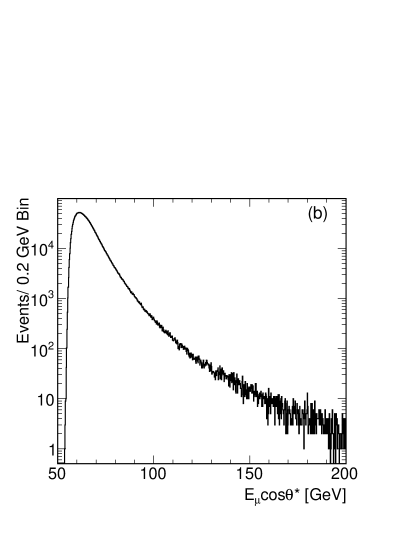
The extrapolated muon surface energy distribution, Eμ, is plotted in Fig. 7(a). The muons which populate the high energy tail have a large zenith angle and thus pass through the largest amount of matter before reaching the detector. To first approximation the minimum energy a surface muon needs to reach the Near Detector is 52 GeV/cos. The Eμcos* distribution is much narrower than the Eμ distribution as the cos* and cos terms effectively cancel. Due to this cancellation the muon events which occupy the high energy tail in Fig. 7(b) are those which possess the highest reconstructed momentum at the detector.
| cos* | Surface Energy | Eμcos* | Charge Ratio | ||||
|---|---|---|---|---|---|---|---|
| [GeV] | [GeV] | ||||||
| Interval | Median | Interval | Median | Interval | Median | r | (stat.) |
| 0.9 | 0.914 | 55-67 | 61.5 | 53.5-61.0 | 56.5 | 1.257 | 0.069 |
| 0.8-0.9 | 0.824 | 60-77 | 70.5 | 54.2-62.9 | 58.0 | 1.270 | 0.013 |
| 0.7-0.8 | 0.735 | 69-91 | 80.5 | 54.6-65.0 | 59.2 | 1.277 | 0.005 |
| 0.6-0.7 | 0.642 | 79-112 | 94.5 | 55.2-69.0 | 60.8 | 1.270 | 0.003 |
| 0.5-0.6 | 0.549 | 95-142 | 115 | 56.2-74.0 | 62.7 | 1.269 | 0.003 |
| 0.4-0.5 | 0.452 | 115-191 | 145 | 57.4-80.9 | 64.8 | 1.259 | 0.003 |
| 0.3-0.4 | 0.356 | 148-280 | 195 | 59.4-91.0 | 68.0 | 1.263 | 0.003 |
| 0.2-0.3 | 0.262 | 212-484 | 290 | 63-109 | 75 | 1.263 | 0.005 |
| 0.15-0.2 | 0.181 | 382-864 | 513 | 76-140 | 92 | 1.276 | 0.013 |
| 0.15 | 0.139 | 697-3450 | 964 | 104-390 | 134 | 1.249 | 0.032 |
Table 3 presents the measured atmospheric muon charge ratio, Eμ and Eμcos* in equal bins of cos*. The median surface energy increases as cos* decreases due to the increasingly large overburden. Eμcos* increases more slowly than Eμ as the increase is due primarily to the detector’s larger analyzable momentum range as a function of zenith angleGoodman (2008). The charge ratio is observed to be independent of cos*, Eμ and Eμcos* to within the uncertainties of our measurements. The charge ratio measurement at Eμ964 GeV is consistent with the MUTRON spectrograph measurement Matsuno et al. (1984), but is lower than other TeV energy scale measurements Ashley et al. (1975); Adamson et al. (2007); Agafonova et al. (2010). This difference is due to the range of zenith angles sampled by each of the detectors and the cos* dependency of Eq. (1).
The “K” Adamson et al. (2007); Schreiner et al. (2009) model is derived from the differential muon production spectrum parameterization given in Eq. (1), and predicts that the muon charge ratio is only dependent on Eμcos*. The K model is a qualitative model describing the relative contribution of pions and kaons to the atmospheric muon charge ratio. Following the prescription in Adamson et al. (2007) and defining and as the fraction of all decaying pions and kaons which decay with a detected , the atmospheric muon charge ratio is given in Eq. (7):
| (7) |
The charge ratio as a function of Eμcos* is plotted in Fig. 8 along with the results from L3+C Achard et al. (2004)Mau (2010), Bess-TEV Haino et al. (2004), UTAH Ashley et al. (1975), MUTRON Matsuno et al. (1984), OPERA Agafonova et al. (2010), CMS Khachatryan et al. (2010) and the MINOS Far Detector Adamson et al. (2007); Schreiner et al. (2009). In instances where the data were not already listed as a function of Eμcos* we convolved the published cos acceptances with the given Eμ data, with assistance from the original authors in the case of L3+C Unger (2009).
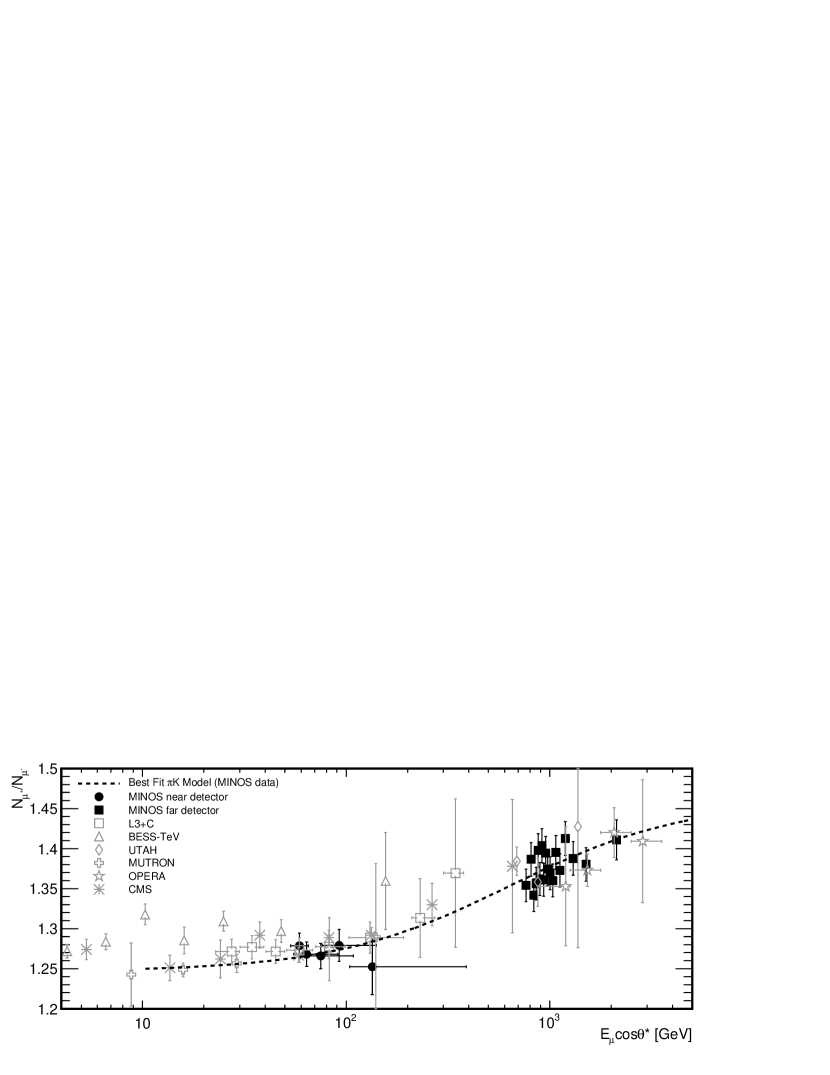
A per degree of freedom fit test to the K model was performed over (,) space using only the charge ratio measurements from the MINOS Near and Far Detectors. The minimum was found at =0.55 and =0.70. These results are consistent with earlier fits by Adamson et al. (2007); Schreiner et al. (2009); Agafonova et al. (2010). The best fit curve to the data is plotted in Fig. 8 and indicates that the kaon contribution to the charge ratio becomes significant at Eμcos* greater than a few hundred GeV. Using two functionally identical detectors, at two different depths, we have demonstrated that the increase in charge ratio observed at the deeper Far Detector is consistent with an increase in the fraction of observed muons arising from kaon decays in the extensive air shower.
VII Summary
A charge ratio measurement has been performed on 301 days of atmospheric muon data collected using the MINOS Near Detector. The atmospheric muon charge ratio measured at 225 mwe underground is
| (8) |
The reconstructed underground energy and zenith angle for each muon used in the analysis were used to extrapolate the muon surface energy. No statistically significant change was observed in the charge ratio as a function of either the surface energy Eμ, from 62 GeV to 960 GeV, or in the vertical muon surface energy Eμcos* from 57 GeV to 134 GeV. This work presents the first demonstration of an increase in the observed muon charge ratio between functionally equivalent shallow and deep underground detectors. The most likely source of this increase is the greater probability that a muon in the deep detector data sample results from kaon production in extensive air showers. A fit has been performed to a simple parametric model of muon production from pion and kaon parents, and the results of the fit support this interpretation of the combined MINOS Near and Far Detector charge ratio measurements.
VIII Acknowledgments
This work was supported by the US DOE, the UK STFC, the US NSF, the State and University of Minnesota, the University of Athens, Greece and Brazil’s FAPESP and CNPq. We are grateful to the Minnesota Department of Natural Resources, the crew of Soudan Underground Laboratory, and the staff of Fermilab for their contributions to this effort.
*
References
- Gaisser (1990) T. K. Gaisser, Cosmic rays and particle physics (Cambridge, UK: Univ. Pr. (1990) 279 p, 1990).
- Lipari (1993) P. Lipari, Astropart. Phys. 1, 195 (1993).
- Zas et al. (1993) E. Zas, F. Halzen, and R. A. Vazquez, Astropart. Phys. 1, 297 (1993).
- Gaisser and Honda (2002) T. K. Gaisser and M. Honda, Ann. Rev. Nucl. Part. Sci. 52, 153 (2002), eprint hep-ph/0203272.
- Aglietta et al. (2004) M. Aglietta et al. (EAS-TOP and MACRO), Astropart. Phys. 21, 223 (2004).
- Derbina et al. (2005) V. A. Derbina et al. (RUNJOB), Astrophys. J. 628, L41 (2005).
- Schreiner et al. (2009) P. Schreiner et al., Astropart. Phys. D09, 00036R2 (2009), eprint hep-ph/0906.3726.
- Adamson et al. (2007) P. Adamson et al. (MINOS), Phys. Rev. D76, 052003 (2007), eprint hep-ex/0705.3815.
- Agafonova et al. (2010) N. Agafonova et al. (OPERA), Eur. Phys. J. C67, 25 (2010), eprint hep-ex/1003.1907.
- Achard et al. (2004) P. Achard et al. (L3), Phys. Lett. B598, 15 (2004), eprint hep-ex/0408114.
- Haino et al. (2004) S. Haino et al., Phys. Lett. B594, 35 (2004), eprint astro-ph/0403704.
- Khachatryan et al. (2010) V. Khachatryan et al. (CMS), Phys. Lett. B692, 83 (2010), eprint hep-ex/1005.5332.
- Hebbeker and Timmermans (2002) T. Hebbeker and C. Timmermans, Astropart. Phys. 18, 107 (2002), eprint hep-ph/0102042.
- Michael et al. (2008) D. G. Michael et al. (MINOS), Nucl. Instrum. Meth. A596, 190 (2008), eprint physics.ins-det/0805.3170.
- Crane et al. (1995) D. A. Crane et al. (NuMI Beam Group), Nucl. Instrum. Meth.0 (1995), FERMILAB-TM-1946.
- Tagg et al. (2005) N. Tagg et al., Nucl. Instrum. Meth. A539, 668 (2005), eprint physics/0408055.
- Belias et al. (2004) A. Belias et al., IEEE Trans. Nucl. Sci. 51, 451 (2004).
- Cundiff et al. (2006) T. Cundiff et al., IEEE Trans. Nucl. Sci. 53, 1347 (2006).
- Scapparone (1998) E. Scapparone, Nucl. Instrum. Meth.0 (1998), eprint physics/9902043.
- Agostinelli et al. (2003) S. Agostinelli et al. (GEANT4), Nucl. Instrum. Meth. A506 (2003).
- Fruhwirth (1987) R. Fruhwirth, Nucl. Instrum. Meth. A262, 444 (1987).
- Matsuno et al. (1984) S. Matsuno et al., Phys. Rev. D29, 1 (1984).
- Yao et al. (2006) W. M. Yao et al. (Particle Data Group), J. Phys. G33, 1 (2006), see T.K. Gaisser and T.Stanev, 24. Cosmic Rays.
- Reichenbacher and de Jong (2008) J. Reichenbacher and J. de Jong (MINOS), in Caballero et al. (2008), pp. 1241–1245.
- Smith et al. (1953) F. M. Smith, W. Birnbaum, and W. H. Barkas, Phys. Rev. 91, 765 (1953).
- Barkas et al. (1956) W. H. Barkas, W. Birnbaum, and F. M. Smith, Phys. Rev. 101, 778 (1956).
- Jackson and McCarthy (1972) J. D. Jackson and R. L. McCarthy, Phys. Rev. B6, 4131 (1972).
- Clark et al. (1972) A. R. Clark et al., Phys. Lett. B41, 229 (1972).
- Jackson (1998) J. D. Jackson, Phys. Rev. D59, 017301 (1998).
- Lee et al. (2005) R. N. Lee, A. I. Milstein, I. S. Terekhov, and S. G. Karshenboim, Phys. Rev. A71, 052501 (2005), eprint hep-ph/0412026.
- of the Interior Geological Survery (2010) U. S. D. of the Interior Geological Survery (2010), map ID numbers 13040 and 13615, URL libremap.org/data/state/illinois/drg/.
- Goodman (2008) M. Goodman (MINOS), in Caballero et al. (2008), pp. 1225–1229.
- Ashley et al. (1975) I. Ashley, G. K., J. W. Keuffel, and M. O. Larson, Phys. Rev. D12, 20 (1975).
- Mau (2010) (2010), independent re-evaluation of the L3+C uncertainties Schreiner et al. (2009) suggest that they may have been too conservative in their systematic uncertainty assignment, thus hindering their ability to observe (in their own data set) a rise in the atmospheric muon charge ratio as a function of Eμcos*.
- Unger (2009) M. Unger, personal communication (2009).
- Caballero et al. (2008) R. Caballero, J. C. D’Olivo, G. Medina-Tanco, L. Nellen, F. A. Sánchez, and J. F. Valdés-Galicia, eds., Proceedings of the 30th International Cosmic ray Conference (Universidad Nacional Autónoma de México, Mexico City, Mexico, 2008).