Qatar-1b: a hot Jupiter orbiting a metal-rich K dwarf star
Abstract
We report the discovery and initial characterisation of Qatar-1b, a hot Jupiter orbiting a metal-rich K dwarf star, the first planet discovered by the Alsubai Project exoplanet transit survey. We describe the strategy used to select candidate transiting planets from photometry generated by the Alsubai Project instrument. We examine the rate of astrophysical and other false positives found during the spectroscopic reconnaissance of the initial batch of candidates. A simultaneous fit to the follow-up radial velocities and photometry of Qatar-1b yield a planetary mass of and a radius of . The orbital period and separation are 1.420033 days and 0.0234 AU for an orbit assumed to be circular. The stellar density, effective temperature and rotation rate indicate an age greater than 4 Gyr for the system.
keywords:
Planetary systems – stars: individual: Qatar-1 – techniques: photometry – techniques: spectroscopy – techniques: radial velocities1 Introduction
Transiting extrasolar planets are important because measurements of the planetary transits as well as the stellar reflex velocity provide both the mass and radius, and hence the density of the planet. In contrast to the relatively tight mass-radius relationship of main-sequence stars, the hot Jupiters found in transit surveys exhibit a wide range of radii at each mass, thus additional parameters affect the radii of close-in gas giants. With over 100 transiting extrasolar planets now securely characterised111see http://exoplanet.eu statistics are beginning to support comparative studies to unravel the factors that determine their radii and orbit parameters (Mordasini et al., 2009). Toward this goal it is important to extend the statistics of hot Jupiters to smaller planets.
The Kepler satellite has delivered over 700 transiting objects, providing good statistics on the orbital periods and radii of transiting bodies (Borucki et al., 2010). At typical distances 300-1000 pc, follow-up spectroscopic studies for high-precision radial velocities to measure the stellar wobble and hence the masses of the smaller transiting bodies presents a considerable challenge for present-generation instruments. The wide-angle ground-based exoplanet transit surveys, in contrast to Kepler, survey brighter stars typically within 100 pc. For these relatively nearby stars, follow-up observations are considerably easier.
The Alsubai Project222http://www.alsubaiproject.org/default.aspx (Alsubai et al., 2011) has initiated a wide-field transit search programme deploying initially a 5-camera CCD imaging system designed to go deeper than most current wide-angle survey systems such as SuperWASP333see http://www.superwasp.org/, HATNet444http://www.hatnet.hu/, TrES555http://dl.dropbox.com/u/502281/Sites/solas/tres/tres.html and XO666http://www-int.stsci.edu/pmcc/xo/. The Alsubai Project’s first site in New Mexico was chosen to complement the SuperWASP sites in the Canary Islands and South Africa, where suites of eight 200mm f/2.0 Canon lenses image degree fields at 15 arcsec pix-1. Combining Alsubai and SuperWASP data should increase the exoplanet discovery rate by enabling multiple transits of candidate systems to be obtained more quickly. The Alsubai camera’s higher angular resolution and larger aperture should also extend the search for transiting planets to fainter stars with smaller radii, and hence to the discovery of smaller transiting planets.
This paper reports the discovery and initial characterisation of the first confirmed transiting exoplanet to emerge from the Alsubai Project exoplanet transit survey, orbiting the star 3UC311-087990 (Qatar-1, , ). The survey observations and candidate selection procedures that led to the discovery of Qatar-1b are presented in Section 2, together with our analysis of the stellar spectrum and follow-up photometry. We discuss in Section 3 our determination of the stellar and planetary system parameters, leading to the summary and conclusions in Section 4.
2 Observations
The Alsubai camera system images an field of view simultaneously at two pixel scales. A single 200mm f/2.0 Canon lens covers the full degree field at 9.26 arcsec pix-1. Four 400mm f/2.8 Canon lenses each cover fields arranged in a mosaic to cover the same field. All cameras use FL1 ProLine PL6801 KAF-1680E 4K4K CCD detectors. The robotic mount cycles through four pointings, taking 100s exposures with the 400mm cameras and 60s exposures with the 200mm camera, thereby covering a square degree field with a cadence of 8 minutes. The 400mm lenses target stars between and 15 mag with 100-s exposures, while the 200mm lens covers the magnitude range from to 12 mag with 60-s exposures. We thus obtain photometry of all stars in the field in the range from to 15 mag.
The data are reduced at the University of St Andrews using pipeline software based on the image-subtraction algorithm of Bramich (2008). A detailed description of the pipeline is given by Alsubai et al. (2011). The pipeline data products are ingested into a data archive at the University of Leicester, which uses the same architecture as the WASP archive (Pollacco et al., 2006).
2.1 Discovery photometry
An automated transit search was conducted on the archive data using the box least-squares (BLS) algorithm of Kovács, Zucker, & Mazeh (2002) as modified for the SuperWASP project by Collier Cameron et al. (2006). Systematic patterns of correlated noise were modelled and removed from the archive light curves using a combination of the SysRem algorithm of Tamuz, Mazeh, & Zucker (2005) and the Trend Filtering Algorithm (TFA) of Kovács, Bakos, & Noyes (2005). The light curves of all candidates were subjected to the candidate screening tests described by Collier Cameron et al. (2007) to ensure that the depths and durations of the transits were consistent with expectation for objects of planetary dimensions transiting main-sequence stars. In cases where the same star had been observed by the SuperWASP survey, we ran periodogram tests to seek evidence of a transit signal in the SuperWASP data at the same period.
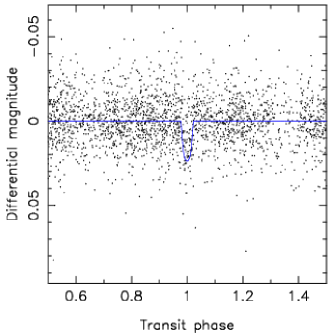
The star 3UC311-087990 was found to exhibit transit-like events at 1.42-day intervals in three fields of the Alsubai Project instrument. Field 073723+532023 was observed 2239 times from 2010 Jun 16 to Sep 7, while fields 074307+520936 and 074440+552202 were both observed on 2916 occasions between 2010 Jun 16 and Sep 24. These fields are to the north of the declination limit of the SuperWASP survey, so no SuperWASP light curve was available. In all three fields, 3UC311-087990 exhibited a clear transit signal with signal detection efficiencies (as defined by Kovács, Zucker, & Mazeh 2002) , 22 and 16 respectively for the three fields. The corresponding signal-to-red noise ratios were , 12 and 13 using the definition of Collier Cameron et al. (2006).
The transit duration and colour of 3UC311-087990 were found to be consistent with the radius and mass of a main-sequence K dwarf host. For such a star, the 0.02-mag transit depth suggests a companion radius close to that of Jupiter.
column 1: UCAC3 identification for the target,
columns 2 and 3: J2000 Right Ascension and Declination measured by this project,
column 4: V magnitude from Alsubai pipeline calibration against UCAC3 magnitude,
columns 5 and 6: Photometric period and epoch,
columns 7 to 9: Effective temperature, log surface gravity, and rotational line broadening of the synthetic template spectrum that gave the best match to the observed spectra, assuming solar metallicity,
columns 10 and 11: Absolute radial velocity on the IAU system and rms variation when two or more measurements were obtained,
columns 12 and 13: Number of TRES observations and total exposure time,
column 14: Detection summary: A means the transits were detected by of the Alsubai cameras, W1 means the transits were also detected with the same period by SuperWASP, W0 means that SuperWASP did not confirm the detection, and no W means the target field was not observed by SuperWASP,
column 15: Disposition of the candidate:
D = the spectrum shows two sets of lines; FA? = a likely photometric false alarm; FR = a rapidly rotating star for which precise radial velocities are not feasible; G = a giant, presumably in a blended system with an eclipsing binary; G? = a likely giant; H = a hot star; P? = the velocity variations are small and not inconsistent with a planetary companion; P! = a confirmed planetary companion; S = the spectrum is single-lined and shows a large velocity variation due to a stellar companion; T? = a likely triple system.
| Candidate | Period | Epoch | ExpT | Field | Type | |||||||||
|---|---|---|---|---|---|---|---|---|---|---|---|---|---|---|
| mag | days | HJD | K | min | ||||||||||
| 215-018836 | 04:20:29.30 | 17:03:29.0 | 11.7 | 2.6539 | 2455182.03187 | 5000 | 3.00 | 6 | … | 1 | 30 | A1 | G | |
| 210-017759 | 04:23:18.22 | 14:58:19.2 | 14.2 | 1.6343 | 2455170.02498 | 7750 | 5.00 | 6 | 0.860 | 2 | 105 | A1W0 | H | |
| 214-019086 | 04:25:10.26 | 16:49:59.9 | 14.8 | 2.1799 | 2455186.89730 | 6250 | 4.50 | 60 | … | 1 | 80 | A1W1 | FR | |
| 214-019418 | 04:27:58.86 | 16:55:21.8 | 13.3 | 1.2068 | 2455510.83400 | 6125 | 3.75 | 7 | 0.075 | 2 | 70 | A1W0 | FA? | |
| 214-019710 | 04:30:22.44 | 16:54:27.1 | 14.0 | 2.3042 | 2455180.03781 | 6250 | 5.00 | 25 | … | 1 | 45 | A1W0 | … | |
| 216-021225 | 04:35:04.30 | 17:35:27.9 | 13.3 | 1.2131 | 2455154.58890 | 5875 | 3.75 | 7 | 0.078 | 2 | 54 | A1W0 | FA? | |
| 212-019540 | 04:35:15.20 | 15:30:57.9 | 12.6 | 5.2482 | 2455155.24280 | 6125 | 3.50 | 45 | 1.281 | 2 | 80 | A1 | FR | |
| 197-017651 | 04:38:58.36 | 08:13:15.0 | 13.3 | 1.3681 | 2455511.60200 | 6750 | 4.00 | 9 | 0.061 | 3 | 76 | A1W0 | FA? | |
| 183-015913 | 04:41:57.49 | 01:24:48.7 | 12.5 | 1.5418 | 2455178.86996 | 6250 | 3.50 | 20 | … | 1 | 24 | A1 | D | |
| 210-019969 | 04:45:41.07 | 14:43:21.6 | 13.1 | 1.9023 | 2455154.86690 | 5250 | 4.50 | 25 | … | 1 | 24 | A1W0 | D | |
| 217-022884 | 04:47:31.64 | 18:29:08.8 | 13.1 | 2.1060 | 2455155.62150 | 6875 | 4.00 | 28 | 0.434 | 2 | 47 | A1W0 | H | |
| 184-018774 | 05:03:22.93 | 01:45:07.2 | 13.4 | 1.8672 | 2455154.95550 | 6750 | 3.50 | 20 | … | 1 | 30 | A2W1 | D | |
| 194-020871 | 05:03:59.84 | 06:48:36.8 | 13.2 | 2.3520 | 2455184.59328 | 6000 | 5.00 | 16 | … | 1 | 30 | A1W1 | D | |
| 197-023150 | 05:09:14.35 | 08:16:52.8 | 12.2 | 4.2357 | 2455156.63930 | 6000 | 4.00 | 8 | 0.169 | 2 | 60 | A1W0 | FA? | |
| 199-022618 | 05:09:35.29 | 09:17:43.2 | 14.1 | 1.7068 | 2455182.41670 | 6500 | 4.00 | 30 | 54.218 | 2 | 84 | A1W1 | S | |
| 196-023727 | 05:16:02.99 | 07:37:03.4 | 13.7 | 1.8731 | 2455154.93060 | 4750 | 4.50 | 1 | 0.118 | 3 | 150 | A1W0 | FA? | |
| 205-023986 | 05:25:06.47 | 12:04:33.7 | 11.3 | 5.2372 | 2455175.61072 | 5000 | 3.00 | 4 | … | 1 | 15 | A1 | G | |
| 190-024393 | 05:28:13.25 | 04:42:24.4 | 13.3 | 1.3150 | 2455180.88287 | 5417 | 4.33 | 3 | 0.267 | 6 | 289 | A1W0 | FA? | |
| 210-028815 | 05:30:41.80 | 14:54:49.0 | 12.9 | 2.8459 | 2455155.23150 | 6000 | 3.75 | 9 | 0.121 | 2 | 87 | A1 | P? | |
| 308-105347 | 18:51:21.19 | 63:59:02.5 | 12.8 | 1.5758 | 2455365.00960 | 6500 | 3.50 | 45 | … | 1 | 30 | A2W1 | D | |
| 284-137549 | 18:59:30.39 | 51:34:50.0 | 12.4 | 2.4046 | 2455365.53430 | 6000 | 3.00 | 45 | … | 1 | 24 | A1W1 | T? | |
| 304-111233 | 19:22:52.65 | 61:53:48.6 | 13.3 | 2.0262 | 2455510.61000 | 5250 | 4.50 | 110 | … | 1 | 30 | A2W0 | FR | |
| 309-100007 | 19:25:15.34 | 64:00:17.9 | 13.2 | 2.1804 | 2455407.44653 | 5625 | 4.38 | 3 | 0.161 | 4 | 175 | A1W0 | FA? | |
| 301-128216 | 19:32:07.33 | 60:27:07.0 | 13.7 | 1.8227 | 2455364.68300 | 5250 | 4.00 | 2 | 0.104 | 2 | 74 | A2W0 | P? | |
| 301-128743 | 19:35:42.56 | 60:27:05.4 | 12.5 | 1.0851 | 2455413.40090 | 6083 | 4.00 | 6 | 13.803 | 3 | 72 | A2W1 | T? | |
| 294-143877 | 19:45:11.25 | 56:35:16.3 | 12.2 | 1.3284 | 2455424.53773 | 6250 | 4.50 | 4 | … | 1 | 30 | A2W1 | D | |
| 311-087990 | 20:13:31.61 | 65:09:43.4 | 12.6 | 1.4201 | 2455407.64900 | 4861 | 4.44 | 2 | 0.189 | 9 | 472 | A3 | P! | |
| 294-152358 | 20:20:22.74 | 56:32:25.0 | 13.0 | 2.3267 | 2455365.32740 | 5000 | 3.50 | 3 | 0.126 | 2 | 60 | A1W0 | G? |
2.2 Spectroscopic reconnaissance
A list of 28 candidates was provided by the Alsubai Project to the CfA team in November 2010. The usual first step at the Harvard-Smithsonian Center for Astrophysics (CfA) for vetting transiting-planet candidates from wide-angle ground-based photometric surveys is to obtain reconnaissance spectra with the Tillinghast Reflector Echelle Spectrograph (TRES) on the 1.5-m Tillinghast Reflector at the Fred L. Whipple Observatory operated by the Smithsonian Astrophysical Observatory (SAO) on Mount Hopkins in Southern Arizona. These spectra are used to look for evidence of stellar systems that are the source of the transit-like light curves (e.g. see Latham et al. 2009) and also to provide refined stellar parameters for the targets. An initial spectroscopic reconnaissance was carried out for all 28 candidates, based on 60 spectroscopic observations with TRES over a span of 17 nights, using the medium fiber at a spectral resolution . A summary of the candidates and the results of the reconnaissance are reported in Table 1.
For the initial analysis, the observed spectra are correlated against a grid of synthetic spectra drawn from a library calculated by John Laird using Kurucz models (Kurucz, 1992) and a line list prepared by Jon Morse. The synthetic spectra cover a window of 300Å centered near the gravity-sensitive Mg b features. The template that gives the best match to the observed spectrum is then used to derive the rotational and radial velocities. To establish the zero point of the radial velocities on the IAU system, a small correction is derived using nightly observations of standard stars.
The initial analysis of the TRES spectra against the library of synthetic spectra provides useful information about the characteristics of the target star, such as effective temperature, surface gravity, and rotational and absolute radial velocity, but it only uses a small fraction of the full 390 to 900 nm spectral range of TRES. To look for evidence of low-amplitude orbital motion, we take advantage of the wide wavelength coverage by correlating the individual observations of a star against a template derived from observations of the same star, either a single observation that has especially strong signal-to-noise, or a master observed template constructed by shifting and co-adding all the observations of the star.
The radial velocities reported in Table 1 are calibrated using an absolute velocity zero point based on observations of the IAU radial-velocity standard star HD 182488. The Kepler team has agreed to use this as the standard for the reconnaissance spectroscopy of Kepler Objects of Interest. We have adopted the velocity of km s-1 as the value on the IAU system for HD 182488. During the November run we accumulated 15 strong observations of HD 182488, giving an observed mean velocity on the TRES native system of km s-1, where the error is the rms residuals from the mean. This is an offset of km s-1 from the adopted IAU velocity for HD 182488. The radial velocities reported in Table 1 have had this offset applied, to bring them as closely as possible into line with the radial velocity of HD 182488 on the IAU system.
| BJD | Phase | Radial velocity | Bisector span |
|---|---|---|---|
| (d) | (km s-1 ) | (km s-1) | |
| 2455518.69628 | 0.2014 | ||
| 2455519.59174 | 0.8320 | ||
| 2455520.63231 | 0.5648 | ||
| 2455521.58409 | 0.2350 | ||
| 2455523.60908 | 0.6610 | ||
| 2455525.59298 | 0.0581 | ||
| 2455526.58711 | 0.7582 | ||
| 2455527.59121 | 0.4653 | ||
| 2455528.58427 | 0.1646 |
When many candidates are being vetted, it is efficient to schedule the initial observations near times of quadrature, as predicted from the photometric ephemerides. In the case of double-lined binaries that are undergoing grazing eclipses, this guarantees that the velocities of the two stars will be near their maximum separation, and thus a single spectrum will be sufficient for rejecting the target if it shows a composite spectrum. If the first observation reveals the spectrum of just one star, a second observation near the opposite quadrature is optimum for disclosing orbital motion due to unseen stellar companions. Of course, this assumes that the photometric ephemeris has the correct period and is up to date.
Nine of the candidates showed clear evidence of stellar companions. In eight cases the initial reconnaissance observation revealed a composite spectrum with at least two sets of lines, with evidence that three stars were likely to be involved for two of the targets. For the ninth case the spectrum was single-lined, but with a very large change in velocity between the two observations. Three of the candidates showed broad lines corresponding to equatorial rotational velocities of tens of km s-1, which would render impractical the measurement of very precise radial velocities, and two of the candidates proved to have temperatures corresponding to late A stars. In three cases the classification of the TRES spectra indicated that the targets are giants, presumably bright stars diluting the light of eclipsing binaries, either in hierarchical triple systems or accidental alignments. Seven of the candidates showed no significant velocity variations, but careful inspection of the available light curves supported the interpretation that the transit detections were false alarms. Two of the candidates with secure transit detections showed very small velocity variations that could be consistent with orbital motion due to planetary companions, and one candidate that was observed only once showed a spectrum suitable for very precise velocity measurements. These three targets deserve additional follow up. Finally, one of the candidates (3UC311-087990, hereinafter referred to as Qatar-1) was confirmed as a system with a transiting planet, as described in the following sections.
2.3 Radial-velocity follow-up
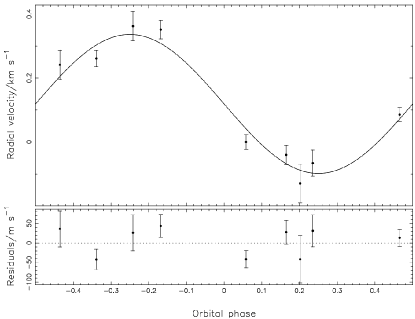
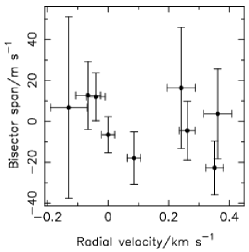
The first two radial velocities of Qatar-1, obtained near opposite quadratures, showed a small but significant difference consistent with the photometric ephemeris and with the interpretation of a planetary mass for the companion. Subsequently this star was observed every clear night with a longer exposure time of 54 minutes, with the goal of deriving an orbital solution. The multi-order relative radial velocities from all nine observations of Qatar-1 are reported in Table 2 and are plotted in Fig. 2 together with a circular orbit, phased to the period and epoch of the photometric ephemeris. No significant correlation was found between the variation in the line bisectors and the relative radial velocities, as shown in Fig. 3. Thus there is no evidence in the TRES spectra that the radial-velocity variations are due to phenomena other than orbital motion, such as an unresolved blend with a faint eclipsing binary or spots coupled with stellar rotation (Queloz et al., 2001).
2.4 Spectroscopic parameters of Qatar-1
As mentioned in the Introduction, a transiting planet allows us to determine both the radius and the mass of the planet, if a spectroscopic orbit for the host star is available to complement the transit light curve. This in turn provides key information about the bulk properties of the planet, such as density. However, the planetary mass and radius values are relative to the mass and radius of the host star, and the accuracy with which the planetary properties can be determined is often limited by the uncertainties in the characteristics of the host star. Nearby stars with accurate parallaxes have the advantage that the observed luminosity of the star helps pin down key stellar parameters such as radius and effective temperature. For more distant stars, such as Qatar-1, the alternative is to use stellar models together with values for the effective temperature and metallicity derived from the spectra.
We have used our library of synthetic spectra and a correlation analysis of our TRES spectra similar to that described by Torres, Neuhäuser, & Guenther (2002), to derive the following results for Qatar-1: effective temperature , surface gravity (log cgs), projected rotational velocity777The symbol represents the inclination of the stellar rotation axis to the line of sight, whereas is used elsewhere in this paper to denote the orbital inclination. km s-1 and metallicity dex. Spectroscopic determinations of stellar surface gravity are notoriously difficult, so it is fortunate that can be determined independently from a joint analysis of the transit light curve and spectroscopic orbit. For Qatar-1 that analysis yielded , as described in the next section.
The stellar parameters adopted for the host star are listed in Table 3 together with catalogue magnitudes and additional stellar dimensions obtained by fitting a model to the transit profiles and spectroscopic orbit.
| Spectroscopic parameter | Value | Source |
| (K) | K | TRES |
| [Fe/H] | TRES | |
| (km s-1) | TRES | |
| (km s-1) | TRES | |
| Photometric parameter | Value | Source |
| (mag) | TASS4 | |
| (mag) | 2MASS | |
| (mag) | 2MASS | |
| (mag) | 2MASS | |
| Model parameter | Value | Source |
| () | MCMC | |
| () | MCMC | |
| () | MCMC | |
| (cgs) | MCMC | |
| Age (Gyr) | MCMC+YY |
2.5 Follow-up photometry
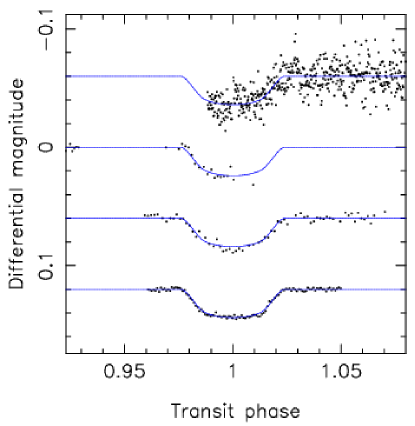
A full transit of the planet Qatar-1b was observable from high northern latitudes on the night of 2010 Nov 27. -band photometry was obtained of the ingress with the CCD camera on the 0.95m James Gregory Telescope (JGT) located at St Andrews, Scotland, during the transit of 2010 Nov 27. A total of 25 180-s exposures was obtained in clear conditions, but the sequence was terminated early by snow clouds. The egress of the same Nov 27 transit was observed in clear conditions with the 60-cm telescope and CCD camera of the University of Keele. A sequence of 535 20-s -band measurements was obtained.
Using the refined ephemeris from these observations we identified an opportunity to observe a complete transit using the KeplerCam CCD on the FLWO 1.2m telescope on the evening of 2010 Dec 2. The transit was observed using 90-s exposures in the Sloan filter; the resulting high-quality photometry was decorrelated against external parameters as described by Bakos et al. (2010). A third transit was observed in its entirety on 2010 Dec 7, again using the JGT with an -band filter.
The four follow-up light curves are shown, together with the best-fitting model, in Fig. 4. The transit is seen to be slightly more than 0.02 magnitudes deep in both wavelength bands. The -band light curve in particular shows four well-defined contacts but rather lengthy ingress and egress phases, suggesting a moderately high impact parameter.
3 Stellar and planetary dimensions
The dimensions of the planet and its host star were determined from a simultaneous model fit to the radial velocities and the combined photometry from the Alsubai Project cameras and follow-up transit observations. The transit light curve was modelled using the formulation of Mandel & Agol (2002) in the small-planet approximation. A 4-coefficient nonlinear limb darkening model was used, employing fixed coefficients appropriate to the band for the Alsubai, JGT and Keele photometry, and to the Sloan band for the KeplerCam photometry. These were interpolated to the appropriate effective temperature and metallicity from the tabulation of Claret (2004).
The parameter optimization was performed using the current version of the Markov-Chain Monte Carlo (MCMC) code described by Collier Cameron et al. (2007) and Pollacco et al. (2008). The transit light curve is modelled in terms of the epoch of mid-transit, the orbital period , the ratio of radii , the approximate duration of the transit from initial to final contact and the impact parameter . The radial-velocity orbit is defined by the stellar orbital velocity semi-amplitude and the offset of the centre-of-mass velocity from the zero-point of the relative velocities listed in Table 2. Where the eccentricity is allowed to float, the two additional fitting parameters and are introduced, as recommended by Ford (2006).
| Parameter | Symbol | Circular | Eccentric | Units |
|---|---|---|---|---|
| Transit epoch | days | |||
| Orbital period | days | |||
| Planet/star area ratio | ||||
| Transit duration | days | |||
| Impact parameter | ||||
| Stellar reflex velocity | km s-1 | |||
| Centre-of-mass velocity offset | km s-1 | |||
| Orbital eccentricity | 0.0 (fixed) | |||
| Longitude of periastron | … | degrees | ||
| Orbital inclination | degrees | |||
| Orbital semi-major axis | AU | |||
| Planet radius | ||||
| Planet mass | ||||
| Planet surface gravity | [cgs] | |||
| Planet density | ||||
| Planet temperature | K |
The linear scale of the system depends on the orbital separation , which through Kepler’s third law depends on the stellar mass . The stellar mass was estimated at each step in the Markov chain as a function of the effective temperature, metallicity and density of the star (Enoch et al., 2010). The effective temperature and metallicity were treated as additional MCMC model parameters, constrained by Gaussian priors with mean values and variances derived directly from the stellar spectra, as listed in Table 3.
A model fit for an eccentric orbit yields an orbital eccentricity . The uncertainty in the eccentricity and the orientation of the orbit yields a more highly inflated and uncertain value for the stellar radius, . The planet’s radius and density are similarly affected. The stellar mass increases to . A star of this mass would have to be among the oldest in the galactic disk population to have evolved to such a large radius. A more likely explanation is that the best-fit value of the eccentricity is spurious, and that the orbit is close to circular. The improvement in the fit resulting from the addition of and as fitting parameters is insufficient to justify adoption of anything other than a circular orbit. The -test approach of Lucy & Sweeney (1971) indicates that there is a 16.8% probability that the improvement in the fit could have arisen by chance if the underlying orbit were circular. In the absence of conclusive evidence to the contrary, we adopted the circular orbit model.
The orbital and planetary parameters derived from the MCMC model fit are summarized in Table 4.
4 Discussion and Conclusions
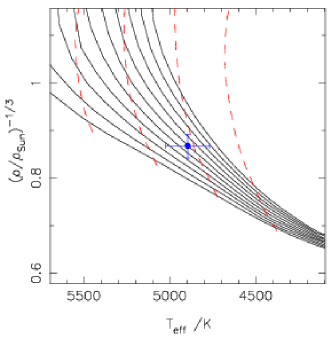
The spectroscopic analysis of the host star Qatar-1 indicates that it is a slowly-rotating, slightly metal-rich dwarf star of spectral type K3V. The MCMC analysis of the transit duration and impact parameter yields a direct estimate of the stellar density. When compared with evolutionary tracks and isochrones for [Fe/H]=0.2 in the versus plane (Fig. 5), the spectroscopically-measured effective temperature indicates a mass between 0.76 and 0.87 , in good agreement with the MCMC estimate using the calibration of Enoch et al. (2010). The stellar density derived from the MCMC analysis is substantially lower than would be expected for a star of this age on the zero-age main sequence, giving a lower limit on the stellar age of 4 Gyr. The slow stellar rotation rate derived from the spectra is also consistent with a spin-down age Gyr.
The planet Qatar-1b is 10% more massive than Jupiter, and has a radius 16% greater than Jupiter’s. It orbits its primary every 34 hours, making it one of the shortest-period planets yet found orbiting a star less massive than the Sun. The blackbody equilibrium temperature given in Table 4 is calculated assuming a planetary albedo of zero and isotropic re-radiation of the power received from the host star. A more general estimate of the dayside temperature is , where is the planet’s Bond albedo and is the fraction of the stellar surface that re-radiates at . Measurements of starlight reflected at optical wavelengths from the dayside hemispheres of the hot Jupiters HD 209458b (Rowe et al., 2008) and CoRoT-2b (Alonso et al., 2009) indicate that their albedos are typically of order a few percent. The blackbody value of 1399 K thus constitutes a reasonable lower limit on the planet’s dayside temperature.
Qatar-1b was one of the very first batch of transit candidates from the Alsubai Project to be subjected to spectroscopic reconnaissance and radial-velocity follow-up. The rapidity of the discovery, and the fact that the planet orbits a mid-K dwarf, confirm that the instrument is well-suited to the efficient discovery of planets around lower main-sequence stars.
References
- Alonso et al. (2009) Alonso R., Guillot T., Mazeh T., Aigrain S., Alapini A., Barge P., Hatzes A., Pont F., 2009, A&A, 501, L23
- Alsubai et al. (2011) Alsubai K., et al., 2011, PASP, submitted.
- Bakos et al. (2010) Bakos G. Á., et al., 2010, ApJ, 710, 1724
- Borucki et al. (2010) Borucki W. J., for the Kepler Team, 2010, arXiv, arXiv:1006.2799
- Bramich (2008) Bramich D. M., 2008, MNRAS, 386, L77
- Claret (2004) Claret A., 2004, A&A, 428, 1001
- Collier Cameron et al. (2006) Collier Cameron A., et al., 2006, MNRAS, 373, 799
- Collier Cameron et al. (2007) Collier Cameron A., et al., 2007, MNRAS, 380, 1230
- Enoch et al. (2010) Enoch B., Collier Cameron A., Parley N. R., Hebb L., 2010, A&A, 516, A33
- Ford (2006) Ford E. B., 2006, ApJ, 642, 505
- Kovács, Zucker, & Mazeh (2002) Kovács G., Zucker S., Mazeh T., 2002, A&A, 391, 369
- Kovács, Bakos, & Noyes (2005) Kovács G., Bakos G., Noyes R. W., 2005, MNRAS, 356, 557
- Kurucz (1992) Kurucz, R. L. 1992, in The Stellar Populations of Galaxies, IAU Symp. No. 149, ed. B. Barbuy and A. Renzini (Kluwer Acad. Publ.: Dordrecht), 225
- Latham et al. (2009) Latham D. W., et al., 2009, ApJ, 704, 1107
- Lucy & Sweeney (1971) Lucy L. B., Sweeney M. A., 1971, AJ, 76, 544
- Mandel & Agol (2002) Mandel K., Agol E., 2002, ApJ, 580, L171
- Mordasini et al. (2009) Mordasini C., Alibert Y., Benz W., Naef D., 2009, A&A, 501, 1161
- Pollacco et al. (2006) Pollacco D. L., et al., 2006, PASP, 118, 1407
- Pollacco et al. (2008) Pollacco D., et al., 2008, MNRAS, 385, 1576
- Queloz et al. (2001) Queloz D., et al., 2001, A&A, 379, 279
- Rowe et al. (2008) Rowe J. F., et al., 2008, ApJ, 689, 1345
- Tamuz, Mazeh, & Zucker (2005) Tamuz O., Mazeh T., Zucker S., 2005, MNRAS, 356, 1466
- Torres, Neuhäuser, & Guenther (2002) Torres G., Neuhäuser R., Guenther E. W., 2002, AJ, 123, 1701
- Yi, Kim, & Demarque (2003) Yi S. K., Kim Y.-C., Demarque P., 2003, ApJS, 144, 259