Zeeman Broadening in Optical Stokes I of Solar-like Stars
Abstract
We present our analysis aimed at inferring average magnetic fields in slowly-rotating solar-like stars. Using the spectral line inversion code SPINOR, we perform high-accuracy line profile fitting and investigate whether Zeeman broadening can be reliably detected in optical data of unprecedented quality. We argue that our usage of both high- and low- lines does provide a certain sensitivity to magnetic fields that may, indeed, be detected. However, the measurement is subject to a model dependence and prone to ambiguities, e.g. due to spectral blends. Hence, while a field may be successfully recovered, the quantification of this field is subject to large uncertainties, even for the highest-quality optical data.
1 Introduction
Direct detections of magnetic fields in slowly-rotating () solar-like stars (SRSLS) are somewhat rare. Since the first application of the Zeeman broadening technique to cool stars by Robinson (1980), much effort was made to infer their field strengths, e.g. in order to constrain stellar dynamo theory. The more recent advances, however, come from different directions, such as direct detections for very late-type stars, e.g. Reiners & Basri (2007), and detections of magnetic field geometry reversals for faster rotators (Fares et al. 2009). The rotation-activity relationship and the absence of accurate and recent measurements of SRSLS magnetic fields thus suggest that the corresponding field strengths may be too low to enable clear and robust detections.
We aim to shed some light on the question of Zeeman broadening detectability in optical Stokes I of SRSLS, and quantify the fields found. To this end, we apply the state-of-the-art line inversion code SPINOR (Frutiger et al. 2005) to data of unprecedented quality and search for signs of Zeeman broadening, see Anderson et al. (2010)[from hereon PaperI].
2 Observations and Analysis
The spectra used in this work were taken with the Coudé-Échelle Spectrometer, formerly fiber-fed from the ESO 3.6m at La Silla, Chile. The resolving power and S/N between and render these the best data considered in this kind of analysis as of yet. This high resolution, however, comes at the expense of a very short wavelength coverage of only Å, severely limiting the number of spectral lines suitable for analysis. The main criterion for suitability is the absence of blends (or at least that the blends present can be well enough reproduced), a utopia as becomes clear with increasing data quality.
Zeeman splitting is a second-order line broadening effect (the splitting of the circularly polarized components is not resolved) in the optical range and is easily outweighed by thermal, rotational, or turbulent broadening. However, contrary to the latter, Zeeman splitting depends on . Additionally, there exists a linear dependence on the Landé factor of the transition, usually expressed in terms of the effective Landé factor, . These dependences have two important consequences:
-
1.
Zeeman splitting can become stronger than e.g. rotational line broadening in slowly rotating stars in the infrared
-
2.
the extent of magnetic broadening varies between lines of different and thereby provides a way of distinguishing between Zeeman broadening and other broadening agents.
As we use optical spectra, we do not benefit from point 1. However, due to the very high precision of CES, we can attempt to exploit point 2 by using both high- and low- lines (cf. Tab. 1) in simultaneous inversions. Thereby, we have a strong magnetic field discriminant at our disposal whose detectability limit we can explore.
| Data set A: | Data set B: | ||||||||
|---|---|---|---|---|---|---|---|---|---|
| Ion | [eV] | Ion | [eV] | ||||||
| 5778.46 | Fe I | 1.21 | 2.59 | 6151.62 | Fe I | 1.83 | 2.18 | ||
| 5783.06 | Cr I | 2.00 | 3.32 | 6165.36 | Fe I | 1.00 | 4.14 | ||
| 5806.73 | Fe I | 0.92 | 4.61 | 6173.34 | Fe I | 2.50 | 2.22 | ||
We investigate two kinds of models, one-component (OC) and two-component (TC) models. The two differ in surface field coverage; OC models assume a surface covered entirely by an average magnetic field, while TC models distinguish between the magnetic and non-magnetic surface fractions. The filling factor represents the magnetic surface fraction. In TC models, we investigate the impact of different assumptions on the temperatures of both components.
A grid of fixed values for and (in OC models, is effectively ) is provided. Best-fit values for the merit function and the free parameters (temperature, , and turbulent velocities) are computed using a non-linear minimization algorithm (Frutiger 2000). To claim detection of Zeeman broadening, we require that the confidence level ( CL, defined by , see Press et al. 1999) be inconsistent with . More detail on the analysis and the inversion code SPINOR, can be found in PaperI and references therein.
3 Results
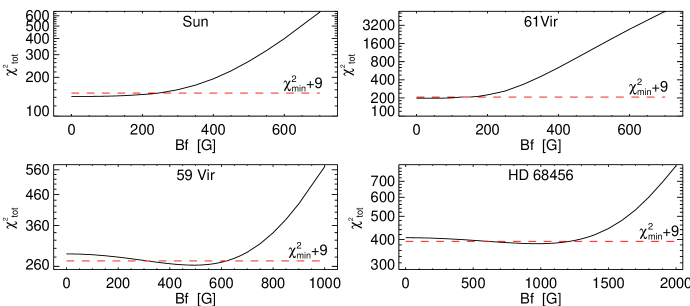
Figure 1 shows the behavior of as a function of fixed values in OC inversions of (top left to bottom right) an integrated solar spectrum (sunlight reflected by Ganymede, close to maximum activity in October 2000), the inactive G6 dwarf 61 Vir, the active G0 dwarf 59 Vir, and the active F6 dwarf HD 68456; spectral types taken from SIMBAD, active denotes high X-ray luminosity as found in the NEXXUS2 database (Schmitt & Liefke 2004, www.hs.uni-hamburg.de/DE/For/Gal/Xgroup/nexxus/nexxus.html) .
In Tab. 2, we list the results for the stars from Fig. 1 together with their logarithmic X-ray luminosities, projected rotational velocities, and the results obtained for our OC inversions of data set A for the Sun and data set B for 61 Vir, 59 Vir, and HD 68456.
| HD Number | alt. ID | Sp.Type | -range | ||
|---|---|---|---|---|---|
| [ergs s-1] | [km s-1] | [] | |||
| Sun (active) | G2V | ||||
| 68456 | GJ 297.1 | F6V | |||
| 115383 | 59 Vir | G0V | |||
| 115617 | 61 Vir | G6V |
OC inversions clearly exclude significant magnetic flux () on the (active) Sun and Vir. Under the OC assumption, we find significant magnetic flux for 59 Vir and HD 68456. For 59 Vir, TC inversions yielded results consistent with both the OC result and G at the CL, since was G (cool magnetic regions case). Comparing the three cases of equal temperature, warm, and cool magnetic regions, we find that the influence on of a second temperature component is considerably larger than that of even a rather strong magnetic field. Hence, the numerical value of the OC detection is challenged. However, the TC results for 59 Vir are inconsistent with at the CL.
4 Conclusion
Our analysis to infer average magnetic fields in optical spectra takes us close to the detectability limit of Zeeman broadening for SRSLS. Overall, we find that even the highest quality data do not yield clear and robust detections. The analysis is subject to a model dependence related to the inital choice of temperature configuration for the stellar surface, and may further be influenced by the approximative treatment of convection by analytical macroturbulence profiles (see PaperI). Also, blends (and their reproducability) gain in importance at the present level of accuracy and therefore constitute a limiting factor. However, there does remain a sensitivity to the Zeeman broadening signature, cf. the case of 59 Vir, thanks to the simultaneous use of both high- and low- lines. It is therefore the numerical amount of magnetic flux detected that is questioned by the OC-TC-related model dependence, not the presence of a magnetic field on the star.
Acknowledgments
RIA and AR acknowledge research funding from the DFG under an Emmy Noether Fellowship (RE 1664/4-1). RIA further acknowledges funding by the Fonds National Suisse de la Recherche Scientifique (FNRS). The work of SKS has been partially supported by the WCU grant No. R31-10016 funded by the Korean Ministry of Education, Science and Technology. This research has made use of NASA’s Astrophysics Data System Bibliographic Services and the SIMBAD database, operated at CDS, Strasbourg, France.
References
- Anderson et al. (2010) Anderson, R. I., Reiners, A., & Solanki, S. K. 2010, A&A, 522, A81. (PaperI)
- Fares et al. (2009) Fares, R., Donati, J., Moutou, C., Bohlender, D., Catala, C., Deleuil, M., Shkolnik, E., Cameron, A. C., Jardine, M. M., & Walker, G. A. H. 2009, MNRAS, 398, 1383
- Frutiger (2000) Frutiger, C. 2000, Ph.D. thesis, Institute of Astronomy, ETH Zürich
- Frutiger et al. (2005) Frutiger, C., Solanki, S. K., & Mathys, G. 2005, A&A, 444, 549
- Judge et al. (2003) Judge, P. G., Solomon, S. C., & Ayres, T. R. 2003, ApJ, 593, 534
- Press et al. (1999) Press, W. H., Teukolsky, S. A., Vetterling, W. T., & Flannery, B. P. 1999, Numerical recipes in C. The art of scientific computing (CUP, —c1999, 2nd ed. reprinted with corrections)
- Reiners & Basri (2007) Reiners, A., & Basri, G. 2007, ApJ, 656, 1121
- Robinson (1980) Robinson, R. D., Jr. 1980, Ap. J., 239, 961
- Schmitt & Liefke (2004) Schmitt, J. H. M. M., & Liefke, C. 2004, A&A, 417, 651