The impact of supernovae driven winds on stream-fed protogalaxies
Abstract
Supernovae (SNe) driven winds are widely thought to be very influential in the high-redshift Universe, shaping the properties of the circum-galactic medium, enriching the intergalactic medium (IGM) with metals and driving the evolution of low-mass galaxies. However, it is not yet fully understood how SNe driven winds interact with their surroundings in a cosmological context, nor is it clear whether they are able to significantly impact the evolution of low-mass galaxies from which they originate by altering the amount of cold material these accrete from the cosmic web. Indeed, due to the strong constraints on resolution imposed by limited computational power, all cosmological hydrodynamics simulations to date resort to implementing more or less physically well motivated and complex subgrid models to trigger galactic winds. To explore this issue, we implement a standard Taylor-Sedov type solution, widely used in the community to depict the combined action of many SN explosions, in a cosmological resimulation of a low mass galaxy at from the ‘nut’ suite. However, in contrast with previous work, we achieve a resolution high enough to capture individual SN remnants in the Taylor-Sedov phase, for which the Taylor-Sedov solution actually provides an accurate description of the expansion. We report the development of a high-velocity, far-reaching galactic wind produced by the combined action of SNe in the main galaxy and its satellites, which are located in the same or a neighbouring dark matter halo. Despite this, we find that (i) this wind carries out very little mass (the measured outflow is of the order of a tenth of the inflow/star formation rate) and (ii) the cold gas inflow rate remains essentially unchanged from the run without SNe feedback. Moreover, there are epochs during which star formation is enhanced in the feedback run relative to its radiative cooling only counterpart. We attribute this ‘positive’ feedback to the metal enrichment that is present only in the former. We conclude that at very high redshift, efficient SNe feedback can drive large-scale galactic winds but does not prevent massive cold gas inflow from fuelling galaxies, resulting in long-lived episodes of intense star formation.
keywords:
methods:numerical–galaxies: high-redshift–galaxies: formation–galaxies: evolution–intergalactic medium–supernovae: general1 Introduction
Significant outflows of gas from star-forming galaxies, known as galactic winds, have been observed both in local galaxies (e.g. Lehnert & Heckman, 1996; Martin, 1999) and high redshift () Lyman break galaxies (LBGs) (e.g. Pettini et al., 2001; Shapley et al., 2003). These winds are usually associated with starbursting galaxies (for example LBGs have star formation rates (SFRs) of ) and in this case are often referred to as ‘superwinds’. These winds can reach large distances from the source galaxy and are typically observed to have temperatures greater than the ‘escape temperature’ of the potential well of their host halo e.g. M82, a classic example of a superwind (Lehnert et al., 1999). This suggests that at least some of their metal enriched gas may be able to escape into the IGM.
The production of these superwinds is attributed to simultaneous SNe explosions whose remnants can overlap producing a bubble of hot, low density gas that can ‘blowout’ of the galaxy and become a wind (McKee & Ostriker, 1977). The main requirement for ‘blowout’ is that the rate of SNe is high enough, such that the remnants overlap before they can cool radiatively (Heckman et al., 1990; David et al., 1990). Observations of outflows from M82 are consistent with multiple SNe supplying energy to drive the wind (Heckman et al., 1990). Alternatively, it has been advocated that multiple coherent SNe, as seen in the superwind scenario, are not the only mechanism able to produce outflows from dwarf galaxies. Dwarf galaxies can lose a significant fraction of their mass on timescales of a Gyr, in a more quiescent manner. Fuelled only by an average SFR, cold gas clouds in the interstellar medium (ISM) are evaporated by SNe remnants and form a wind if the evaporated gas reaches high enough temperatures (Efstathiou, 2000).
Due to their ability to eject material from galaxies, galactic winds are considered a potential solution to several outstanding problems in the field of structure formation. They are proposed to play a role in the pollution of the IGM and intracluster medium with metals, the occurrence of metallicity gradients within individual galaxies (e.g. Heckman et al., 2000), the properties of dwarf galaxies (Dekel & Silk, 1986) and even to provide a reservoir of hot gas for re-accretion by galaxies at lower redshifts (Oppenheimer et al., 2010).
The most influential role of galactic winds, however, is arguably their impact on the IGM. Furlanetto & Loeb (2003) demonstrate analytically that LBGs can propagate kpc into the IGM, which is compatible with the sizes of observed HI-deficient regions around LBGs (Adelberger et al., 2003). Based on cosmological simulations, Aguirre et al. (2001) argue that SNe driven winds from massive galaxies alone () could pollute the entire IGM to its observed level. It has also been proposed, however, that protogalaxies (with masses comparable to present day dwarf galaxies) could be better candidates for polluting the IGM, since the lower velocity winds they would produce at would not perturb the IGM in the way that superwinds at would (Madau et al., 2001). There is also evidence for metals in the IGM by , requiring pollution at an earlier epoch than that probed by observations of LBGs. Simulations of an isolated dwarf by Mac Low & Ferrara (1999) show that almost all metals are ejected from dwarf galaxies (with ), even though the ejection of gas mass is surprisingly inefficient.
It is clear that galactic winds have the potential to impact vast regions of space and influence structure formation on large scales. Therefore, the importance of studying this phenomenon in its full cosmological context cannot be overestimated. However, while there have been many successful numerical simulation studies of galactic winds in individual galaxies (Mac Low & Ferrara, 1999; Mori et al., 2002; Scannapieco & Brüggen, 2010), capturing the production of a galactic wind in cosmological simulations remains a challenge. In such simulations, galactic winds tend to be imposed directly, rather than allowed to develop naturally as a result of overlapping SNe bubbles (Springel & Hernquist, 2003; Scannapieco et al., 2006; Oppenheimer & Davé, 2008). We recall that an important ingredient of analytical studies of SNe driven winds is a multiphase ISM i.e. a hot, rarefied atmosphere, containing cold dense gas clouds (e.g. McKee & Ostriker, 1977; Efstathiou, 2000). If the resolution of a cosmological simulation is not sufficient, the multiphase nature of the ISM is not captured and it is not possible to accurately model SNe remnants. In fact, the inclusion of a multiphase ISM ‘by hand’ is a common feature of galactic wind models (e.g. Springel & Hernquist, 2003; Scannapieco et al., 2006).
Examining galactic winds in a cosmological context, rather than in isolation, introduces further complications. Galaxies are now embedded in the cosmic web and are subject to inflows as well as outflows. The mode of inflow will be dependent on the galaxy halo mass; low-mass galaxy haloes ( ) cannot host a stable shock at the virial radius and so primarily accrete cold () gas whereas high-mass galaxy haloes () primarily accrete shock-heated, hot () gas (Birnboim & Dekel, 2003). It has been suggested that this framework, when coupled with active galactic nuclei (AGN) and SNe feedback, could naturally give rise to some of the bimodality in galaxy properties we observe but usually fail to reproduce with simulations (Dekel & Birnboim, 2006). Indeed, semi-analytic modelling has shown that incorporating such processes results in an improved fit to most galaxy property trends e.g. colour bimodality, luminosity function etc (Cattaneo et al., 2006). Kereš et al. (2009) have shown, however, that AGN radio-mode feedback (which can prevent hot gas from being accreted) has little effect on high-mass galaxies in cosmological simulations because most of these were built hierarchically from lower mass galaxies which gained their baryons via cold accretion. They suggest it is feedback in low mass galaxies, such as SNe driven winds, that is of greatest importance. It seems that studying accretion and feedback in low mass protogalaxies is, therefore, vital for our understanding of galaxy evolution as a whole.
Recent cosmological simulations are in agreement that for low mass galaxies (with ) most inflowing gas is cold (e.g. Kereš et al., 2005; Ocvirk et al., 2008; Brooks et al., 2009). All of these studies also demonstrate qualitatively that much of this cold inflow occurs along filaments (e.g. Fig. 17 of Kereš et al. (2005), Fig. 5 of Ocvirk et al. (2008) and Fig. 5 of Brooks et al. (2009)). What has not been quantified, however, is how much cold accretion occurs in a spherically symmetric way i.e. with the same geometry as assumed for hot accretion. While it is reasonable to assume that this spherical cold accretion can be safely ignored when the galaxy is surrounded by a halo of shock-heated gas (i.e. it has ), this is not the case when the halo is below the shock mass threshold and there is not necessarily anything to impede the spherical accretion of cold material from the IGM. Indeed, most of the visual demonstrations that cold accretion takes place along filaments in these previous studies focus on examples when the galaxy has a hot gas halo and cold accretion is necessarily confined to the filaments anyway. This paper thus complements such studies by measuring how cold gas accretion is divided between the filamentary and diffuse (spherically symmetric) components in low mass () haloes, in simulations both with and without SNe feedback.
Most of the aforementioned studies also incorporate SNe feedback, although it is unclear whether a substantial galactic wind ever develops and they do not address the specific impact of this on the accretion processes. Recent work by van de Voort et al. (2010) attempts to tackle this issue with a suite of cosmological simulations employing different physics. We note, however, that their SNe feedback is implemented by giving gas particles a velocity kick and so the galactic wind is an input rather than a result that arises naturally. They conclude that the relative importance of cold accretion onto the galaxy halo is robust to changes to the feedback recipes, but that the relative importance of cold accretion onto the galaxy itself is decreased in the presence of SNe-driven winds. We revisit this question in this paper, but at much higher resolution and redshift (), where SNe blastwaves are individually resolved and so it is not necessary to put in a galactic wind by hand. We also emphasize that our high spatial and mass resolution allow us to fully resolve the filaments at very high redshift (), contrary to previous studies in which the spatial resolution, in particular, is lacking in this redshift range. These resolution effects potentially enhance the likelihood of the filaments being destroyed by the SNe feedback, changing the balance between inflow and outflow and thus the subsequent evolution of the galaxy.
A few high resolution studies of cosmological accretion in individual galaxies have been performed, but these tend to focus either on more massive galaxies (i.e. with ) at lower redshift () (Agertz et al., 2009; Ceverino et al., 2010) or on the early formation stages of the first galaxies () at where direct accretion of gas from the IGM briefly precedes cold filamentary inflows (Greif et al., 2008). We are primarily interested in studying the epoch bracketed by these studies; that in which filamentary accretion is important for low mass haloes, during which galactic winds may also develop.
In summary, for a low mass protogalaxy (i.e. with ) at high redshift (), there are two main predictions about its interaction with the cosmic web : 1) a galactic wind will develop and extend far into the IGM, polluting it with metals and 2) cold gas will flow rapidly into the host halo via the web’s filaments. What happens when these inflow and outflow mechanisms occur simultaneously? We tackle this question with a suite of cosmological resimulations (incorporating different physics) with pc physical resolution in the densest regions, of a galaxy with at . At such high resolution, we can model individual SNe with a Sedov blastwave allowing a galactic wind to arise naturally. We examine the mechanism via which the wind develops and measure its properties. Furthermore, by measuring the inflow and outflow rates and comparing these with a control run (without SNe) we investigate whether the presence of a hot galactic wind can alter the accretion processes in a protogalaxy in such a way as to significantly impact its evolution.

This paper is structured as follows. In Section 2 we describe the suite of simulations we have performed and outline the gas physics employed (cooling, star formation, SNe feedback), further details of which are provided in the Appendix (Section 8). In Section 3 we distinguish between different gas phases in both runs, relating these to physical structures e.g. the filaments, satellite galaxies, the hot galactic wind (feedback run only). In Section 4, we explore the mechanism responsible for the development of the galactic wind in the feedback run and measure the wind properties. We measure the inflow and outflow in all gas phases in Section 5 and then relate the dominant accretion modes and outflows to the star formation rate in Section 6, comparing the cooling and feedback runs in order to isolate the impact of the SNe feedback on the formation and evolution of this galaxy at high-redshift. Finally, we outline our conclusions in Section 7.
2 The nut simulations
The nut Simulations 111Nut is the Egyptian goddess of the night sky are a suite of ultra-high resolution (maximum physical spatial resolution of pc at all times) cosmological resimulations of a Milky Way like galaxy forming at the intersection of 3 filaments in a CDM cosmology. To date we have performed 3 simulations, with different gas physics, with the AMR code, ramses (Teyssier, 2002): i) adiabatic with a uniform UV background (Haardt & Madau, 1996) turned on instantaneously at z=8.5 ii) cooling, star formation and UV background and iii) as ii) but with the addition of supernova (SN) feedback, including metal enrichment and its subsequent changes to the cooling function. Simulations i) and ii) are presented elsewhere (Powell et al, in prep); for the sake of completeness we summarise the technical details below.
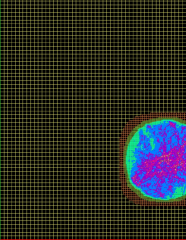
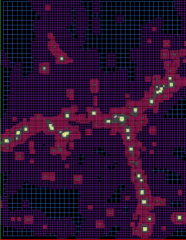
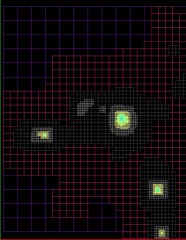
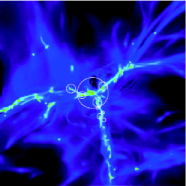
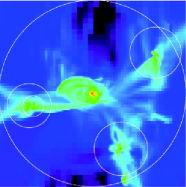
The galaxy resides in a halo with a virial mass of 1.05 at and has been selected such that it lies in an isolated environment (not in the centre of a cluster or group at ). The cosmology employed in the simulation is , and , with comoving box-size Mpc h-1 and the simulations start at (parameters are consistent with WMAP (Dunkley et al., 2009)). There are three nested grids located in the region where the galaxy halo will form which corresponds to a volume of approximately (2.7 comoving Mpc h. This has the equivalent resolution of 10243 dark matter particles which each have a mass of . Further levels of refinement, up to a maximum of , are applied to the grid in this region in order to keep the spatial resolution, in the densest region, below 1 pc physical at all times. We use a quasi-lagrangian refinement strategy (i.e. the gas mass of cells stays roughly constant) in which the next level of AMR is triggered when the baryonic mass in a cell reaches (where ), or the number of dark matter particles in the cell reaches . Fig. 1 illustrates the grid structure (top row) and corresponding gas density with halo and subhaloes indicated with white circles (bottom row), showing the set-up of the nested grids and the locations where additional levels of AMR are triggered (see caption for details). Additional technical details, including descriptions of the star formation and SN feedback prescriptions, are given in the Appendix.
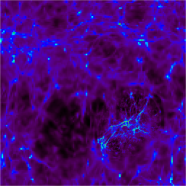
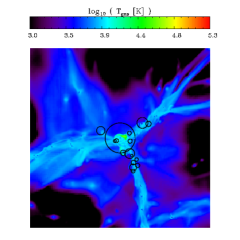
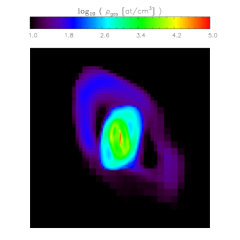
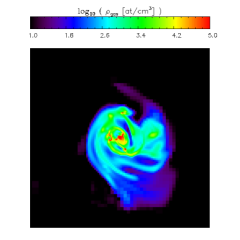
Fig. 2 shows temperature maps of a region of size (top row) and density maps of a region of size (bottom row) centred on the resimulated galaxy at for the cooling (left column) and feedback (right column) runs. Since cooling is present in both simulations, a thin, rapidly rotating disc forms, which is continuously fed by cold gas that streams along the filaments at Mach . The disc is gravitationally unstable and occasionally fragments into star-forming clumps of several parsecs in radius (e.g. bottom right panel of Fig. 2) which our resolution allows us to resolve along with the filaments and the scale-height of the thin disc (this is demonstrated in Powell et al, in prep). In our simulation with SN feedback a far-reaching galactic wind develops at very high-redshift. Star formation in the galaxy, its satellites and haloes embedded in the filaments results in many SNe explosions, which are individually resolved. The numerous bubbles overlap, creating an extended cavity through which the hot gas escapes the galactic potential in the form of a wind. By , when the dark matter halo mass has reached , the wind extends to i.e. kpc, filling the virial sphere with hot, diffuse gas.
3 Identifying the wind and filaments
In order to quantify the relationship between filamentary accretion and galactic winds, we define 5 different gas phases, using temperature and density cuts and measure mass inflow and outflow rates in each of these phases.
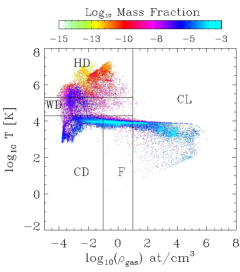
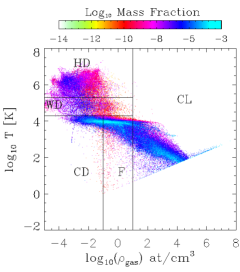
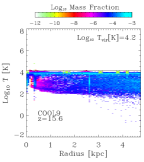
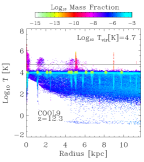
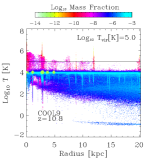
Fig. 3 shows density-temperature histograms for gas inside the virial radius in the cooling (top) and feedback (bottom) runs. The region of cold (K), dense ( atoms/cc) gas in both phase diagrams can be attributed to gas that has condensed into galaxies, either the main galaxy or its subhaloes. The cooling is more efficient in the feedback run due to the increased metallicity following enrichment from SNe. This accounts for the greater mass fraction of gas in this region at the lowest temperatures and highest densities. The edge apparent here is due to the polytrope used to prevent artificial fragmentation below the Jean’s scale (more details in the Appendix). A striking feature, common to both the cooling and feedback runs, is the prevalence of gas with K. We identify this with filaments (see Fig. 4) defined as containing all gas with K, atoms .
Since we are analysing high redshift () outputs, the virial temperature is always below K. While this temperature threshold has been employed in other studies to successfully separate shocked-heated gas from cold gas (e.g. Kereš et al., 2005; Ocvirk et al., 2008), it does not isolate all the gas heated to temperatures of the order of Tvir and higher in our simulations (as is clear from Fig. 3). To account for the gas which has experienced heating (i.e. has K and so is not ‘cold’), but has not reached the ‘standard’ definition of hot used in the aforementioned literature (K), we define an additional category of warm gas which has . In the bottom panel of Fig. 3 (feedback run) we can clearly see a cloud of hot (K), diffuse ( atoms/cc) gas which contains a significant fraction of the total gas mass. Perhaps surprisingly, we see a similar feature in the top panel of Fig. 3 for the cooling run, albeit one that makes a less significant contribution to the total gas mass. It is predicted that infalling gas will shock on impact with the dense ISM if it has not passed through a shock at the virial radius (and so was accreted cold) (e.g. Birnboim & Dekel 2003). The hot phase in the cooling run must be the result of shock-heating of this type, since there are no SNe to heat the gas in that simulation. However, since the mass in the hot phase in the cooling run is tiny compared to that in the filaments (see e.g. colours for the hot diffuse gas component at z=9 in Fig. 3 (top panel)), and since the cooling time of metal poor material at 106 K with a density comparable to that of the cold filaments ( 1 at/cc) is around 1 Myr, i.e. much larger than the time resolution of the simulation on the level of refinement reached at these densities ( 0.1 Myr), we conclude it is primarily the cold diffuse gas that is being shock heated. Indeed, if the filamentary material were being continuously shocked one would expect to see a prominent hot phase with densities equaling or exceeding that of the filaments due to compression of the gas as it passes through the shock. This scenario is clearly excluded by Fig. 3, which shows that only a tiny mass fraction of such high density hot material exists. We undertake a more detailed study of how and where shock-heating occurs in Powell et al, (in prep).
| Category | (K) | (K) | (at/cc) | (at/cc) |
| clumpy | 0 | 10 | ||
| filaments | 0 | 0.1 | 10 | |
| cold diffuse | 0 | 0 | 0.1 | |
| warm diffuse | 0 | 10 | ||
| hot diffuse | 0 | 10 |
The categories we have created are summarised in Table 1 and in Fig. 3 we show how the thresholds divide up the phase diagrams at for the cooling (top) and feedback (bottom) runs. Fig. 4 shows visualisations of these categories created using 3D visualisation software vapor (www.vapor.ucar.edu). The results of a atoms cut on the density appears in the top row; the central galaxy and several satellites are clearly defined by the clumpy category in both the cooling and feedback runs. The gas that meets our definition of the filaments (K, atoms ) is illustrated with a rendering of the density in Fig. 4 (middle row). The filamentary category is successful in isolating the filaments in both the cooling (left) and feedback (right) runs. It appears that the filaments are thinner and less well-defined in the feedback run, so one already wonders whether this impacts the accretion rate. This image also shows an interesting feature of the structure of the filaments; they become twisted and loop around the central galaxy. This is particularly evident in the cooling run (middle row, left) and is linked to the way these filaments dissipate their energy as they find their way to the centre of the halo.
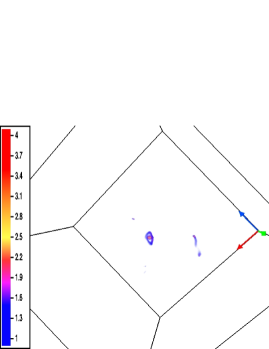
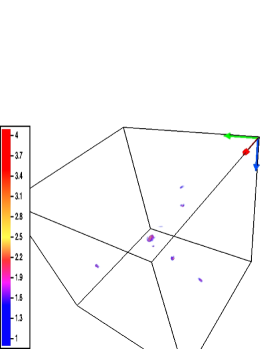
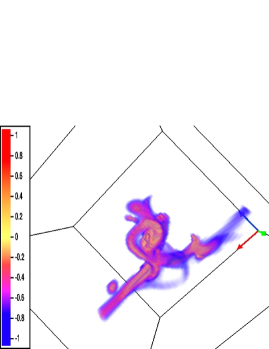
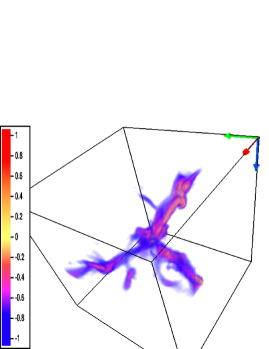

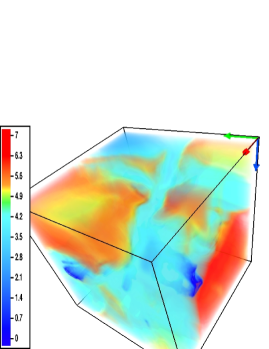
Fig. 4, bottom row shows 3D renderings of the temperature of the diffuse gas ( atoms/cc). It is immediately apparent that the virial sphere contains significantly more hot gas in the feedback run (right) than the cooling run (left). Approximately per cent of the virial sphere is filled with hot gas in the feedback run, yet only per cent in the cooling run. This large covering factor of hot gas even in haloes below the shock mass threshold could explain recent observations of high-redshift galaxies in which outflows, rather than cold inflows (as expected for cold-accretion dominated haloes) are observed (Steidel et al., 2010; Faucher-Giguere & Keres, 2010). The hot gas in the cooling run (bottom row, left) surrounds the wound up filaments and originates from the filaments dissipating their kinetic energy as they stream through the cold, diffuse medium on their approach to the centre. We believe this loss of energy in a shock in combination with gravitational focusing causes the filaments to wrap around the galactic disk. We explore the details of this in Powell et al, in prep.
4 The galactic wind
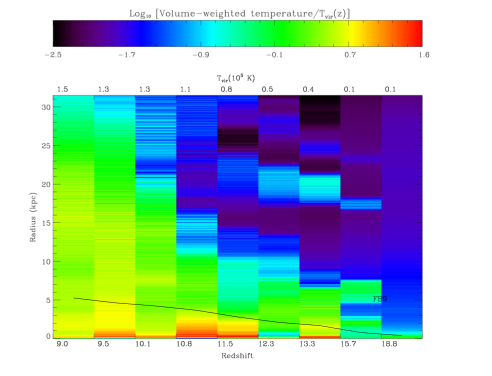
We identify the galactic wind illustrated in Fig. 2 (top, right) with both the warm and hot diffuse phases defined in the previous section. It is clear from the phase diagrams in Fig. 3 that these phases contain significantly more mass in the feedback run than in the cooling run and the only possible culprit is SNe feedback. We quantify the extent of the galactic wind by examining the time evolution of the volume-weighted temperature (represented by the colour-coding) as a function of radius in Fig. 5. The temperature is calculated in 10 pc physical radial bins within a sphere of radius kpc physical ( at ) centred on the main progenitor halo at each redshift. By the hot gas in the feedback run already extends out to . We note that such a wind ‘bubble’ extent is in fair agreement with the estimate derived semi-analytically by Furlanetto & Loeb (2003) (their Fig 1, top right panel) using a spherical thin-shell approximation. This is rather surprising in light of all the simplifying assumptions that go into their modelling. For instance, they assume that star formation and feedback only occur in galaxies when they cross the cooling threshold and are captured by the main progenitor halo. In contrast star formation in our simulated galaxies has started earlier in most cases and winds have had time to develop prior to mergers. The similar sizes of the wind in semi-analytic calculations arise from the fact that Furlanetto and Loeb’s key (incorrect) assumption that all the gas has collapsed in a dense medium before triggering a starburst and that therefore the wind’s spherical thin shell expands into an empty halo, actually has consequences very similar to those in the scenario which unfolds in our feedback simulation. In the latter, most of the halo is also devoid of dense material, but this is because this gas is preferentially channelled along narrow filaments which continuously fuel star formation, regardless of whether galaxy mergers are taking place or not. Winds from our simulated galaxies expand perpendicularly to this filamentary network into the low pressure intrahalo medium and depending on their sizes, galactic wind bubbles can merge before or after their host haloes merge.
4.1 Development of the wind
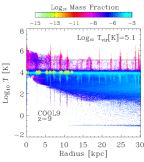
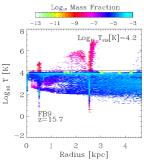
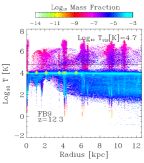
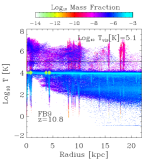
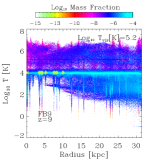
In order to demonstrate how this far-reaching wind develops and to corroborate the picture sketched out in the previous section, we examine how the gas inside is distributed both in temperature and radius in Fig. 6 for the cooling (top row) and feedback (bottom row) runs. For each redshift output, we measure the temperature distribution in spherical shells of radial width 10 pc physical centred on the main progenitor. The colour scale shows the mass fraction within each temperature-radius bin and the virial temperature at each time is indicated with a horizontal line. As we have already seen in Fig. 3, most of the gas mass in both the cooling and feedback runs is concentrated at K at all radii. Gas at this temperature spans a large range of densities (approximately atoms/cc), however the main mass contribution is from the filaments (see Section 3 for more details). The most striking difference between the runs is the prevalence of hot gas () in the feedback run (bottom row) at all radii, in stark contrast with the cooling run (top row); this gas constitutes the galactic wind.
There are many ‘spikes’ in temperature in both the cooling and feedback runs, which correspond to the gas in subhaloes or other haloes beyond the virial radius of the main halo. We demonstrate this explicitly for subhaloes within of the main halo, by overplotting squares at K, to indicate the position of the centres of the subhaloes with respect to the centre of the main halo (which is at , by design). The horizontal error bars indicate for each. The low temperature end of the spike indicates where gas has cooled and condensed within the subhaloes.
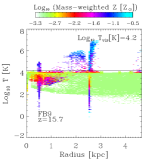
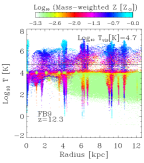
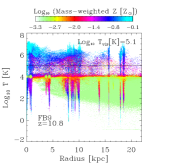
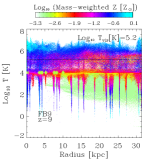
The high temperature ends of these spikes are of particular interest in the context of the galactic wind. In Fig. 7, we show the diagram from Fig. 6, but now the colour scale indicates the mass-weighted metallicity. The high mass-weighted metallicity we measure in the high-temperature spikes corresponding to (sub)haloes shows that this hot gas results from SNe exploding in the galaxies hosted by these haloes. By examining the time sequence of plots for the feedback run (Fig. 6, bottom row and Fig. 7), we can see that these plumes of hot, metal-enriched gas (seen particularly clearly at , second panel of bottom row of Fig. 6 and Fig. 7) gradually build up into a continuous distribution of hot gas at all radii, forming the galactic wind.
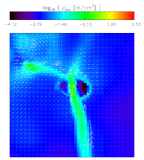
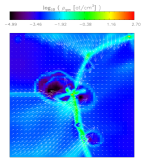
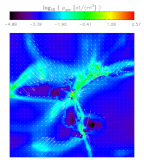
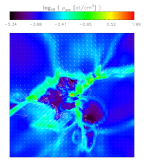
In Fig. 8 we show one cell thick () slices through the gas density in a region of size , centred on the main halo. Here we can clearly see the low density cavities left behind as the blastwaves from the SNe propagate outwards. At higher redshifts (towards the left) these ‘bubbles’ originate only from the main galaxy, yet as we move to lower redshifts (towards the right), cavities can also be seen forming further out in the filaments as galaxies in haloes embedded therein also host SNe explosions. By (the last panel) we can see the bubbles are overlapping merging into one outflow with its epicentre located at the main galaxy.
In previous studies where galactic winds were invoked, often the wind could not escape the galaxy (e.g. Ocvirk et al., 2008), unless it was put in by hand (e.g. Springel & Hernquist, 2003; Oppenheimer & Davé, 2008). We propose it is this mechanism of overlapping bubbles from multiple (sub)haloes which (i) significantly increases the reach of the wind (ii) more efficiently pushes material outside the main halo. Indeed, if one considers that the total amount of kinetic energy imparted to the gas by all SNe (those exploding in the main halo and its subhaloes) is fixed, but that one is allowed to distribute it at different points along the path of the outflow, rather than release it all in the central galaxy, then more energy is available to drive material out of the main halo’s potential well. The reasons are twofold: (i) the SN driven winds of satellite galaxies have to climb out of shallower potential wells (ii) the (smaller) amount of gas swept from the central object (SNe exploding in subhaloes will not contribute to the mass loading) will see its energy replenished on the way outwards by interacting with the subhalo winds. Note that as a result of this effect, galactic winds might carry more energy and less mass out of the halo.
High temperature spikes coincident with a (sub)halo are also occasionally evident in the diagrams for the cooling run, however these are of a similar colour but much thinner than in the feedback run and therefore contain a much smaller fraction of the gas mass. This hot gas is generated in the shocking of the diffuse circum-galactic material of satellite galaxies (see Powell et al, in prep for a detailed discussion of shock-heating in the cooling run).
Another feature of the diagrams (Figs. 6 and 7) is a haze of gas (i.e. gas not associated with one of the spikes) with K which persists at all radii. This is cold, metal poor, diffuse gas that fills the space between the filaments. In the feedback run (bottom row of Fig. 6) this gas only becomes significant beyond about (kpc) at , whereas it is present in significant quantities within in the cooling run (top row). Furthermore if we follow the plots for the feedback run (bottom row of fig. 6) from high to low redshift (left to right) we can see this haze of cold diffuse gas recedes over time. The hot wind from the SNe is sweeping away the cold diffuse gas which surrounds the filaments, reducing the resistance to future outflows from SNe. We substantiate this hypothesis in Section 5 with detailed measurements of the outflow.
4.2 Wind properties
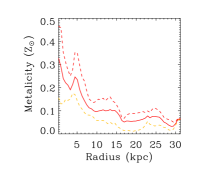
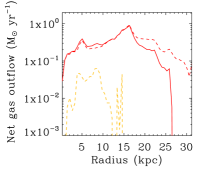
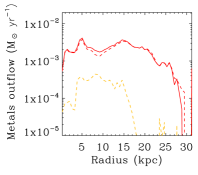
In Fig. 9 we present the properties of the galactic wind as a function of radius (within of the main halo) at . We show the mass-weighted velocity (top left), the metallicity profile (top right), the net mass outflow rate (bottom left) and the net mass outflow rate of metals (bottom right). The solid red line shows these quantities for the warm and hot gas combined, which is then split into warm (orange dashed line) and hot (red dashed line) components (see Table 1 for definitions of ‘hot’ and ‘warm’).
The velocities we measure (top left panel of Fig. 9) compare well to the semi-analytic model of Furlanetto & Loeb (2003), both for launching (their equation (11) for ) and average expansion velocities (equation (12) and Fig. 2 top right panel for ) of the wind. Agreement on is not too surprising because the wind bubble in our simulation is able to avoid zones of high pressure (filaments have a negligible halo volume filling fraction), and therefore it mostly sweeps gas with the average density (and pressure) of the IGM at the redshift of interest. This makes Furlanetto and Loeb’s approximation of a spherically symmetric expansion in a homogeneous background of average density a good one, even though it is not very consistent with the spherically symmetric accretion of dense gas which should naturally occur in their model if they did not wait until all this gas has piled up in the centre of the halo before triggering their wind.
More remarkable is the agreement with , considering that the fraction of the total energy of SNe available to power the wind in their model () is calibrated on the idealized simulations of high redshift starbursts by Mori et al. (2002) who quote a value of about 25%. Indeed, using the same estimator as Mori and collaborators (see Fig. 12 of their paper), i.e. the ratio of kinetic energy flux at the virial radius to the total supernova luminosity, we find that is around %. This remains the case even when we vary the radius at which we measure the kinetic flux (down to 0.1 ) or the time delay ( Myr) between the measurement of the kinetic flux at the virial radius and the supernova luminosity to account for the amount of time it takes the central wind to reach the growing virial radius in our non-idealized feedback simulation. This factor 10 lower for the efficiency to power winds in our simulation compared to that measured by Mori and collaborators can be attributed to (at least) two differences: (i) the central density of the gas in Mori et al. (2002) is severely underestimated (they use 10 at/cc which is at the bottom end of our definition of clumpy gas and more representative of the density of filaments at these redshifts) (ii) the star formation rate (and hence SNe explosions) is spread out in time (and space) in our simulation rather than instantaneous. These two effects, and especially the former, mean that radiative cooling affects our supernova remnants to a much greater level, sapping their energy much more efficiently. Finally, we note that the value of in our simulation does not seem to be a strong function of the mass of the halo, as the progenitor of our halo at reaches a similar mass as that of the halo used by Mori and collaborators () at without changing much. Thus, the agreement with Furlanetto & Loeb (2003) for (the wind launching velocity) is recovered because they assume that the the efficiency of the wind mass loading, , is related to the star formation efficiency on galactic scales, , by . Although the values for the that we measure are close to the the value of % that these authors adopt (see section 6 for details), the value we measure for , is approximately a factor 10 lower than theirs (see section 5 for the exact value). Since we adopt an initial mass function (IMF) very similar to theirs (Salpeter with similar mass cut-offs), the order of magnitude discrepancies in and cancel out in their formula (11) for and we recover a value close to their km/s, as shown in the top left panel of our Fig 9.
The metallicity profile of the wind out to in Fig. 9 (top right panel) shows that the metallicity ranges from to at . In terms of mass, per cent of the gas with K within has , with quite narrow scatter since only per cent of this gas has . Whilst we cannot currently compare measurements of the metallicity of a high-redshift galaxy directly with observations, we can draw parallels with observations of the metallicity of winds in local galaxies. Determining the wind metallicity using X-ray observations of the hot gas is difficult due to various uncertainties and degeneracies (see Veilleux et al., 2005, for a discussion). Bearing these caveats in mind, Martin et al. (2002) find that the metallicity of the wind in NGC 1569, a local dwarf starburst galaxy, must be greater than and that the wind seems to carry most of the metals produced in the current starburst. Our measurements of the metallicity of the hot diffuse gas are broadly consistent with these observations, suggesting that metal enrichment away from the main site of star formation is plausible at such a level.
If we extrapolate our results using Press –Schechter theory to calculate the average number density of M⊙ haloes at , we find a value of 0.15 Mpc-3 comoving for the cosmological model we use. This translates into a mean inter-halo distance of about physical kpc, so that a small but non negligible volume fraction () of the IGM can be filled by metal rich hot gas wind bubbles blown by haloes in this mass range at those redshifts. Assuming that the result of Furlanetto & Loeb (2003) holds in this regime, such that the extent of the wind does not depend sensitively on the virial mass of the galaxy host halo at a given redshift, then the volume fraction filled by hot gas will increase if we start including lower mass haloes. Based on the measurement of the wind metallicity in our simulation (see Fig. 9 top right and bottom right panels), it seems that galactic winds may indeed be very efficient at polluting gas in the the IGM at very high redshifts up to a level comparable to that observed in the Ly- forest at (Bouché et al., 2007).

5 Measuring gas accretion and outflow
In Section 3, we defined gaseous components (clumpy, filaments, cold diffuse, warm diffuse and hot diffuse) which are summarised in Table 1. We now measure the rate of mass inflow and outflow in each component in order to quantify how they contribute to the overall accretion/outflow of material onto/from the central galaxy. In particular, we focus on establishing the impact (if any) of the galactic wind (which we identify with the warm and hot diffuse phases) on these mass fluxes by comparing the feedback and cooling runs.
We measure the flux in spherical shells centred on the centre of the dark matter halo of the main galaxy, which is taken to be the position of the densest dark matter particle. The shells are of width pc physical and extend out to the halo’s virial radius. In order to compute gas velocities relative to the galaxy, we subtract the peculiar velocity of the dark matter halo from all gas velocities. We compute the mass flux, , for each grid cell in a shell using,
| (1) |
where , and are the cell’s gas density, radial gas velocity, and physical size respectively.
By definition, gas with negative (i.e. negative ) is flowing inwards and gas with positive (i.e. positive ) is flowing outwards. We compute the total inflow, , and total outflow, , separately for each shell as follows,
| (2) |
where is the distance between the halo centre and the shell midpoint and the subscript on denotes whether it is positive or negative. This calculation is repeated for each of the gas components listed in Table 1, the only difference being that the terms and only include contributions from cells that meet the temperature and density criteria for the particular component. The flux we compute is, therefore, an instantaneous flux at the time of the output we are analysing.
5.1 Inflow
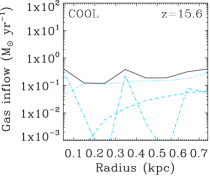
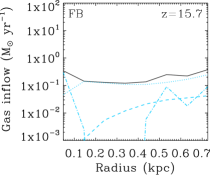
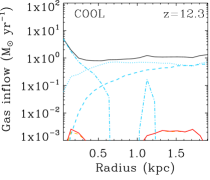
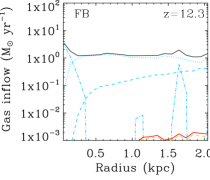
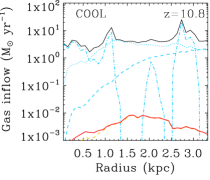
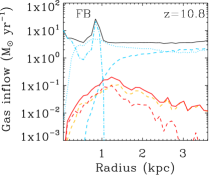
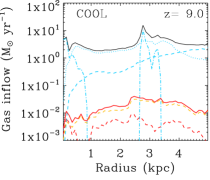
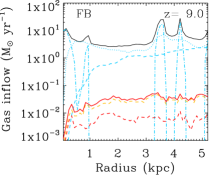
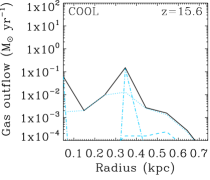

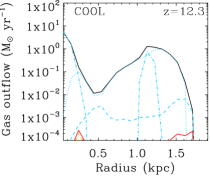
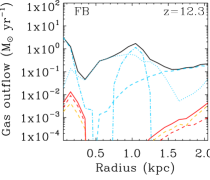
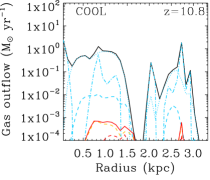
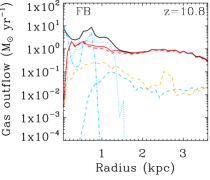
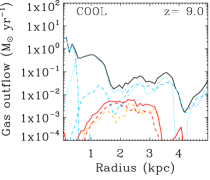
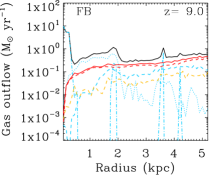
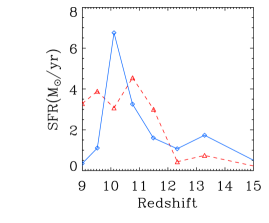

Fig. 10 shows the gas inflow versus radius (up to the virial radius) for the cooling (first column) and feedback (second column) runs. The mass flow is measured for each gas phase in spherical shells of width pc physical, centred on the main progenitor halo, out to its virial radius.
The total mass inflow rate (solid black line) is approximately constant with radius, reaching values above by , in both runs and is dominated by the contribution from the filaments (blue dotted line).This level of inflow compares well with the estimate of the baryonic accretion rate at the virial radius derived by simply painting baryons onto dark matter using extended Press-Schechter theory (Neistein et al., 2006). For CDM, this yields:
| (3) |
(Dekel et al., 2009). In this formula, is the universal baryon fraction which is in our simulation, and , so we get , which is within 50 percent of our measured values in the cooling and feedback runs (cf. top two rows of Fig. 11). At , the virial mass of our dark matter halo has dropped by a factor , to . Using the same formula we therefore predict an accretion rate of at this redshift, which is lower, but of the same order of magnitude to that which we measure () in the simulation. This confirms that our resimulated halo is a fairly ‘typical’ halo and that gas, even in high resolution simulations is being accreted proportionally to dark matter, at least at the virial radius.
While the similarity of the gas accretion rate to the prediction for the dark matter accretion rate at the virial radius is not very surprising, the near constancy of the filamentary gas accretion rate all the way down to the disc is more remarkable. This is caused by the radial velocity of the gas in the filaments remaining constant around km/s, independently of radius. Indeed, whereas the dark matter filaments are dynamically heated when they penetrate the virial radius, the gaseous filaments radiate away the extra gravitational energy (recall their temperature is stable around ) to continue their journey supersonically (at about Mach 5) deep into the centre of the dark matter halo, all the way to the central disc.
On the other hand, the mass inflow rate in the cold diffuse component (blue dashed lines Fig 10) increases with radius, until it becomes comparable with that in the filaments at the virial radius. This trend with radius is a geometrical effect; as the shell surface area decreases with decreasing radius, more and more diffuse gas is compressed and joins the filamentary phase, and thus the inflow of diffuse cold gas per unit time is reduced as the radius shrinks. As the filaments have a roughly constant cross-sectional area (as illustrated in the middle row of Fig. 4), no such effect occurs and thus they rapidly become the dominant supply of gas in the inner regions of the halo. The accretion rate is very similar for the feedback and cooling runs and so it seems that the geometry of the supply of cold gas to the central object means that the SNe feedback is unable to significantly diminish it. The main source of such gas is the dense, collimated filaments, which present more pressure resistance to the galactic wind than the more symmetrically distributed diffuse material.
The impact of SNe feedback on accretion is also considered in van de Voort et al. (2010), in which the authors examine accretion onto a large sample of galaxies and their haloes in a suite of cosmological simulations with different physics. We note that their recipe for SNe feedback involves adding in a galactic wind ‘by hand’ (i.e. by applying a velocity kick to particles near an exploding star particle) and so their technical approach is very different to ours. A direct comparison to our results is challenging, not least because we are considering a very different halo mass and redshift range ( halo at , compared to haloes with at ). In the discussion that follows, we will compare to their results for haloes with at , as this is the closest match to the halo in our study. van de Voort et al. (2010) find that including SNe feedback reduces the total smooth accretion rate by a factor of for haloes in this range and by a factor of for the central galaxies hosted by these haloes. This suggests that accretion from the IGM has been considerably impeded by SNe feedback; this is in stark contrast to our results.
A clue to the possible origin of this difference can be found in their Fig. 7 (last row) where the lowest mass halo illustrated (which has ) is embedded within a filament. This means there is no lower density material for a SNe-driven wind to preferentially flow into. This is very different to our lower mass, but higher redshift halo, which is fed by 3 filaments that are thin compared to its virial radius. It is interesting to note that for their halo, which is fed by 3 filaments (see their Fig. 7, middle row) the total accretion rate onto the halo is not altered by SNe feedback. We would therefore argue that the geometry of the accretion must be considered, not just the halo mass (although the two are interlinked) in order to accurately predict/explain the effects of galactic winds on gas accretion.
The spikes in the inflow in the clumpy component (blue dot-dash lines in Fig 10) correspond to satellite galaxies, or other over-dense clumps of gas. Note that there is always a spike in the clumpy inflow rate at the centre (at ); this is due to the presence of a rotating gas disc, which also gives rise to similar central spikes in the corresponding outflow plots (Fig. 11. Indeed, since gas discs are generally not axisymmetric, as different rotating elements of gas of the same disc pass through a spherical shell they can contribute either negatively or positively to the radial velocity component of the shell, therefore leading the gas in the disc to be detected both as inflowing and outflowing.
There is both warm inflow (orange dashed line) and to a lesser extent, hot (red dashed line) inflow, in the cooling run (Fig. 10, first column). While this is around 3 orders of magnitude less than the contribution from the filaments it indicates the possibility for gas to be heated in low mass haloes even without feedback. Fig. 4 revealed that the origin of this heated material is a shock front, where cold diffuse material is heated as it impacts the denser filamentary material surrounding the disc (this, and the properties of gas inflow in general, is discussed in more detail in Powell et al, in prep). There is a similar rate of mass inflow in the hot and warm components in the feedback run, but it is dwarfed by the rate of outflow.
5.2 Outflow
Fig. 11 shows the gas outflow versus radius (up to the virial radius) for the cooling (first column) and feedback (second column) runs, respectively. The rate of mass outflow in the feedback run is dominated by the contribution from the hot component. Despite velocities reaching several km/s (see Fig. 9, left) for this component, the mass outflow rate is only around percent of the total inflow. This is simply because the hot gas has very low densities; Fig. 3 (bottom panel) shows that the greatest mass fraction of hot gas occurs at densities of atoms/cc.
The cold diffuse outflow in the feedback run is a factor of higher than that in the cooling run (see particularly ), reinforcing our interpretation of Figs 6 and 7 that hot outflows from SNe sweep away some of the cold diffuse gas falling onto the central galaxy. This fraction of swept-up material is about percent of the amount of cold diffuse gas which flows in, suggesting that the material being swept out is the low density ( atoms/cc) cold (K K) tail of the distribution seen in the phase diagram for the cooling run (Fig. 3, top panel). Indeed this gas is clearly missing in the feedback run (compare the sections labelled ‘CD’ in Fig. 3, for the cooling (top) and feedback (bottom) runs). As with the filamentary component, the impact of feedback on the cold diffuse accretion rate is surprisingly small even though a high velocity galactic wind has been successfully launched.
The large spikes in the mass outflow rate of the clumpy component (blue dot dash line) in both runs are due to the presence of rotating gas discs in satellite galaxies. The outflow seen in the filamentary component (blue dotted line) is a result of the ‘looping’ of the filaments (particularly pronounced in the central regions of the halo in the cooling run) and, to a lesser extent, material associated with the outer region of satellites which is not distinguished from the filament in which the satellite is embedded due to the smooth density gradient.
6 Correlating accretion, outflows and star formation
One of the main reasons why the cold-mode of accretion has received so much attention, is because of its implications for the star formation histories of galaxies. In the traditional picture, star formation is delayed as the gas is first shock heated to the virial temperature of the dark matter halo and requires time to cool and condense isotropically onto the central galaxy. If, on the other hand, gas comes in cold and fast along dense filaments, star formation can commence earlier, be much more rapid and localized in space. In order to quench such starburst episodes, the supply of fuel for star formation has to be shut off by e.g. SNe feedback. However, since galactic winds are expected to take the path of lowest pressure to propagate in the halo, the filaments could be resistant to destruction and the starburst prolonged. Therefore, in this section we investigate how star formation rates correlate with net mass inflow rates, comparing the cooling and feedback runs to quantify the impact of SNe.
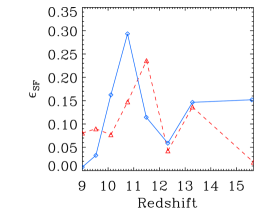
To examine the star formation rate (SFR) of the main progenitor in isolation we analyse the stars within the virial radius at each available output and compute the SFR in a small time interval only (10 Myrs), thereby excluding stars formed outside the main progenitor and accreted during mergers (left panel of Fig 12). The right panel of Fig. 12 shows the ratio of these in-situ star formation histories in the feedback and cooling runs. Whilst the SFR in the cooling run is a factor 2 larger than that in the feedback run for , the situation is reversed at lower redshifts () where the SFR of the feedback run exceeds that in the cooling run by up to a factor 10. This is intriguing as it suggests that SNe are a source of positive feedback, i.e. they enhance star formation rather than inhibit it. Although in order to confirm the origin of this positive feedback effect it would be necessary to perform another nut simulation with supernova feedback turned on but metal enrichment switched off, we attribute most of it to the extra cooling provided by metal lines in the feedback run rather than, for example, compression of the ISM by blast waves. Indeed it is obvious from Fig 3 that such an extra channel for cooling enables a larger mass fraction of cold gas to reach the star forming density threshold in the feedback simulation (bottom panel).
To assess how these differences affect the global efficiency of star formation, we estimate the ‘effective’ star formation efficiency, , in both runs by writing a Kennicutt-Schmidt law for the entire central galaxy which gives,
| (4) |
where is the mass of gas measured inside a sphere centred on the galaxy, with radius and we take as the dynamical time. Here is the usual free-fall time, i.e. the time for the mass enclosed in the sphere to collapse under its own gravity i.e.,
| (5) |
The dynamical time varies by a factor of around , over the redshift range examined (z ), from Myr at high redshift to Myr at low .

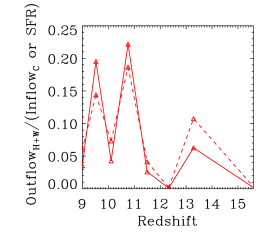
Fig. 13 (top) shows the efficiency, , as defined in equation 4 for the cooling (solid line) and feedback (dashed line) runs. Note that this effective (global) star formation efficiency is, on average, an order of magnitude higher than both the typical star formation efficiency of determined from observations of the local Universe (Krumholz & Tan, 2007) and the local efficiency parameter in ramses, which we set to in both cooling and feedback simulations (for details of the star formation implementation see the Appendix). Such low efficiencies of this order of magnitude are only measured in the cooling run for .
This effect can be understood as follows. Equation 4 represents an averaging of the star formation properties of the whole region we are considering, whereas the efficiency parameter in the simulation can only control the star formation rate in individual cells which have exceeded the required density threshold. If star formation occurs in a clumpy medium where many regions exceed the density threshold for star formation, the overall efficiency of the object will be larger than if the medium is more homogeneous. Higher densities in a clumpy medium also give rise to shorter star formation time-scales on a cell by cell basis. It seems appealing to conclude that, at very high-redshift, star formation on galactic scales is more efficient, not because it is more efficient on local cloud core scales, but because a larger fraction of the ISM gas mass is locked in dense clumps (clumps are evident by eye in the gas disc in the feedback run: see Fig. 2, bottom right), than at low () redshift.
This view receives some support from observations of clumpy galaxies at (e.g. Elmegreen & Elmegreen, 2005). These clump masses are estimated to lie around , which are consistent with the findings of high resolution hydrodynamical simulations. Indeed Agertz et al. (2009) and Ceverino et al. (2010) report massive clumps of order at The clumps we see in our simulated disc at are less massive (), but we believe they are the high redshift counterparts of the observed (and simulated) clumpy galaxies. We defer a detailed study of these stellar clumps to a companion paper (Slyz et al, in prep.), but we note that their typical masses () are consistent with the Jeans mass values one expects from the gravitational fragmentation of the gaseous disc.
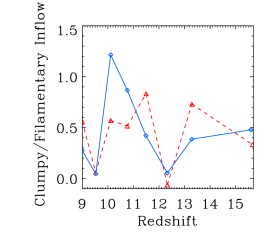
In order to understand how the cold gas components fuel star formation and how they yield the high global star formation efficiencies measured, we evaluate how the SFR correlates with the net mass flow averaged over all radii. In Fig. 14 (left panel), we examine the ratio of the SFR to the cold gas inflow rate versus redshift for the cooling (blue solid line) and feedback (red dashed line) runs. In the interval the cold gas supply far exceeds the SFR in the cooling run. In the feedback run during the same time period, the dashed line oscillates around , showing that a amount of gas comparable to the amount of incoming material is converted into stars. However, the high efficiency of star formation that we measure on the scale of the galaxy (Fig 13) seems uncorrelated with the epoch of high inflow rates, whereas the global star formation rate is, as shown by the lines on the right panel of Fig. 14. Once again, we interpret this as evidence that the global efficiency is more sensitive to the local microphysics than the global properties of mass accretion. Indeed, the epochs of high global efficiency correlate quite well with the times at which the radially averaged clumpy component of cold gas accretion is high (see Fig. 13, bottom), i.e. mergers/strong interactions with neighbouring galaxies take place. These are thought to trigger violent instabilities which will compress the ISM (or increase turbulence and therefore increase fragmentation) and allow a larger fraction of it to reach the threshold for star formation, resulting in higher global star formation efficiencies and a merger induced starburst. Note that when the ratio of clumpy to filamentary inflow reaches its peak, we also see a corresponding peak in the SFR (left panel, Fig. 12). Compared to these violent events the impact of smooth filamentary accretion on the global star formation efficiency is a second order effect, even though it maintains it at a higher level (between %) than the % expected from our choice of efficiency parameter on small scales, which should remain unchanged by diffuse accretion alone.
Finally, Fig. 14 (right panel) shows that the hot outflow rate is on average one order of magnitude below the SFR. This is contrary to observations of lower redshift galaxies in Martin (1999), and Heckman et al. (2000) who estimate the mass-loss rate to be comparable to the SFR. This means that the hot gas outflow rate is also about a factor of lower than the rate of mass entrained by SNe ejecta in our modelling (see the Appendix for details of SNe feedback), suggesting that a significant proportion of this gas mass does reform stars on very short timescales. Whether this is caused by a lack of implementation of physical processes known to occur in the interstellar medium (e.g. radiative transfer, stellar winds) or this is an intrinsic problem of (high-redshift) SNe driven winds remains to be established.
In light of this study, we conclude that SN explosions alone are very inefficient at driving massive galactic winds from typical galaxies at high redshift. We stress that this finding is resolution-dependent; at lower resolutions the Sedov-Taylor solution necessarily represents multiple SN remnants and a more massive wind may be driven. Since such a solution has only been proven to accurately describe an individual SN remnant, we are confident that the low mass wind we produce is a robust result. However, there are additional processes that could affect the mass-loading of the wind which are not included in our simulations, such as stellar winds, ionizing photon heating, cosmic rays and magnetic fields. Furthermore, as in all cosmological simulations, we use a (simple) subgrid model for star formation and have assumed an IMF, both calibrated on local Universe observations. As the rate and energy of SNe are dependent on these assumptions so, in turn, should be the mass outflow rate in the wind.
7 Conclusions
We have undertaken a detailed analysis of a suite of subparsec
resolution simulations (the nut simulations) with the aim of
understanding the mechanism via which a far-reaching galactic wind
can arise in a protogalaxy at high redshift
() and how this impacts the surrounding IGM and the galaxy’s evolution.
In particular we examine the relationship between cold-mode, filamentary
accretion and star formation and explore the impact that the
introduction of SNe feedback and the resulting wind has on these processes.
Our main findings are:
-
1.
A far-reaching SNe driven wind (illustrated in Fig. 2, top right) does develop; this is particularly significant since we do not directly model the wind in our feedback scheme, but instead we resolve the Sedov blastwaves of individual SNe and the wind arises naturally. We find that SNe explosions occur not only in the main progenitor, but also in subhaloes and neighbouring dark matter haloes (demonstrated in the temperature-radius histograms, Fig. 6). These create overlapping bubbles which are critical for creating the far-reaching wind and for facilitating the escape of the gas from the halo potential. Since subhaloes are key, we speculate that similar winds can also be produced by higher mass haloes at lower redshifts, and we will certainly investigate this issue in the very near future. The wind is enriched with metals to the order of (see the metallicity profile in Fig.9, top right). While one must be careful when comparing high-redshift simulations results to local observations, we conclude that it seems feasible for such a wind to enrich the IGM to the level required by observations at . On the other hand, we find the ejection of mass by the wind is very inefficient: the outflow rate in the hot phase is only per cent of the total mass inflow rate. We also find that the mass outflow rate is about an order of magnitude lower than the SFR, in disagreement with local observations (e.g Martin, 1999; Heckman et al., 2000), perhaps indicating an important difference between low and high redshift SNe driven winds or a missing physical process in the simulation which drastically alters the mass loading factor of the wind (stellar winds, radiative transfer). We plan to address this issue in a forthcoming paper.
-
2.
The total gas accretion rate at the virial radius of the main progenitor (see Fig. 11, top two rows) ranges between depending on redshift, and is in fair agreement with analytical predictions based on extended Press-Schechter theory, indicating that the gas accretes like dark matter at the virial radius (note that the accretion is cold). However, in contrast to the accretion of dark matter, this rate persists for the gas filaments right down to the central object and thus these filaments are the dominant supply of cold gas to the central disc (compared to clumpy or diffuse, spherical cold accretion). While the filaments appear more perturbed in the inner halo in our 3D visualisations of the feedback run than in those of the run without SNe feedback (Fig. 4, second row), we measure similar mass accretion rates in both runs, suggesting that the majority of the gas survives its journey to the central object intact and gets replenished by cold gas coming in from larger distances. So, despite the development of a galactic wind, the cold, filamentary accretion is not significantly altered. This suggests that, at least at , SNe driven winds cannot reduce the amount of cold, accretion onto dwarf-mass protogalaxies and therefore cannot significantly reduce star formation at this epoch, as is commonly assumed.
-
3.
At the lower end of the redshift range studied (), the SFR in the feedback run is more often than not greater than that in the cooling run (see Fig. 14, left for the ratio of SFRs versus redshift). An extreme example is at when the SFR in the feedback run is , yet only (the minimum SFR over the redshift range considered) in the cooling run. We attribute this ‘positive’ feedback effect to the metal enrichment active only in the former (we have already demonstrated that the gas accretion rates are very similar in both runs). Increased metallicity means more efficient cooling and this combined with the wind which can spread the metals, means a greater mass of gas will cool and condense enough to form stars. In fact, we find that the mass outflow rate is significantly lower than the rate of input of ejecta and entrained ISM into the SNe blastwaves, suggesting much of this material is recycled for next generation star formation.
-
4.
Star formation is globally very efficient in both the cooling and feedback runs. Even though in the star formation implementation we set the efficiency to when the gas density in a cell goes over atoms/cc, we measure average efficiencies of within . This indicates that star formation at high redshift proceeds in dense clumps that represent a larger fraction of the total gas mass of the galaxy than they do at low redshift. The global efficiency is well correlated with the average inflow rate of clumpy gas (i.e. gas that is condensed in satellites/subhaloes) (see Fig. 13, bottom) i.e. with the occurrence of mergers or strong interactions between neighbouring galaxies. When mergers occur the ISM is compressed and/or turbulence triggers increased fragmentation, allowing a larger fraction of the gas to reach high enough densities for star formation, resulting in higher global star formation efficiencies.
8 Appendix: Gas physics
8.1 Cooling and heating
The cooling and heating of gas is included in ramses by adding an additional source term to the energy equation. Above K the cooling is dominated by bremsstrahlung radiation whereas in the range K, collisional and ionization excitation and recombination processes dominate and can cool the gas to K. To cool below K, molecular cooling and/or fine structure metal cooling need to be implemented; in the simulations presented here, cooling down to 1K is possible via metal line cooling. We note that collisional ionization equilibrium is adopted.
Although it does not matter for the current paper, we turn on a Haardt & Madau (1996) like UV radiation field (which varies with , but is uniform in space) instantaneously at to model the reionization of the Universe.
8.2 Tracking the metals
The metallicity of the gas is followed as a passive scalar and is advected with the flow of gas. For both simulations with and without SNe feedback, we force the pristine gas to have a constant floor metallicity . This value provides a fairly good approximation to the real cooling rates at work when the Universe is still devoid of heavy elements (Yohan Dubois, priv. comm.). For the simulation with SNe feedback, this floor is soon superseded by higher values because of the injection of heavy elements produced in the explosions of massive stars. When a SN explosion occurs, a fixed percentage of newly synthesized metals in the star particle (the ‘yield’, which we set to ) is returned to the gas when creating the Sedov blastwave (see the section on supernova feedback).
8.3 Star formation
The implementation of star formation in ramses is outlined in Rasera & Teyssier (2006) and Dubois & Teyssier (2008) and we recall the main details here. Given observational evidence for a universal relation between the gas surface density and the star formation rate over many orders of magnitude at low redshift (Kennicutt, 1998), we assume star formation proceeds according to a Schmidt law (a volumetric representation of the Kennicutt law). Gas is therefore converted into stars in cells in which the gas density, , exceeds a threshold value, , at a rate given by,
| (6) |
where is the star formation scale, given by,
| (7) |
and is proportional to the free-fall time.
To set the star formation parameters, we refer to modern observations which have shown that star formation occurs at a constant efficiency of of gas per free-fall time over orders of magnitude in density, up to (Krumholz & Tan, 2007). While it is not possible to achieve stellar densities in our simulations, we set the density threshold as high as our spatial resolution allows us, i.e. , the density at which the Jeans length associated with gas at 100 K becomes equal to pc. This allows us to identify potential sites of star formation as realistically as possible. In the simulations described in this paper this corresponds to a density threshold at the top of the range currently probed by observations, , and a compatible star formation efficiency of 0.01. Note that such a high density threshold for star formation allows us to bypass the issue of having to decide which fraction of the gas is molecular and thus eligible for star formation as virtually all the gas is in molecular form at such densities. Since the free-fall time for gas at is 0.2 Myr, we then set Myr to obtain our chosen efficiency. Finally, in order to completely avoid artificial gas fragmentation on scales of the order of the Jeans length the following polytropic equation of state is also enforced:
| (8) |
where is set to K to prevent the Jeans length from becoming shorter than and to 4/3 to stabilize the gas against gravity.
When the conditions for star formation are met in a cell, the number of star particles to be created, , is drawn from a Poisson distribution,
| (9) |
where
| (10) |
where is the cell volume and is the timestep evaluated at the current refinement level. The minimum star mass, , is related to the resolution of the simulation by,
| (11) |
where is the volume of a cell on the finest refinement level of the simulation, and and are dimensionless parameters that account for the mass loss of stars through SNe explosions and the entrained gas mass respectively. Details of and are given in section 8.4 below. In our simulations, , but note that this is reduced to in the feedback run, since and are non-zero.
In order to limit the number of star particles spawned in a simulation, the particles which the Poisson law tells us should be created in a given cell are then fused together into one, so that each star particle mass is . To preserve numerical stability, no more than 90 % of the gas in any given cell is turned into stars in one timestep (this is the same threshold as used by Dubois & Teyssier (2008)).
8.4 Supernova feedback
The scheme for SNe feedback employed in our feedback run is presented in Dubois & Teyssier (2008). When a star particle is formed the amount of gas depletion can be broken down into the mass locked up in stars permanently, , and the mass which will be ejected by the supernova, , where
| (12) |
is the fraction of the total mass of stars formed which is recycled and becomes supernova ejecta. We set , i.e. the standard value for a Salpeter IMF truncated between 0.1 and 100 . is a free parameter, the mass loading factor which quantifies the mass of gas surrounding the star that will be swept away by the shock wave which propagates outwards after the explosion, on scales that we cannot resolve; this additional mass is added to the star particle when it forms. Setting , as we do, ensures that angular momentum is conserved when we enforce the Sedov blast wave solution described below for the gas (see Dubois & Teyssier (2008), Appendix A for details). Note that this means that the same amount of gas is entrained in the explosion as that which is locked into stars. Observations of galactic outflows by Martin (1999) show that the removal of gas from the galactic disc occurs at a rate that is comparable to the rate of star formation, which somewhat supports our choice of parameter, even though these measurements are performed on a much larger scale than that at which we enforce our Sedov solution ( 1 pc).
Star particles undergo SNe explosions Myr after their formation, corresponding to the typical lifetime of a 10 Type II supernova progenitor. The total energy released, , is set using the typical energy, ergs, and mass, , of a Type II supernova,
| (13) |
Half of this energy is kinetic and produces a Sedov blast wave with an initial radius of cells on the highest level of refinement ( pc). The other half of the energy is thermal and heats the surrounding gas. Note that at these very high resolutions, the results are not very sensitive to the exact form (kinetic or thermal) in which the energy is deposited (Y. Dubois priv. comm).
Acknowledgments
The authors thank R. Teyssier, A. Kravtsov and A. Pontzen for valuable discussions at various stages of this work and acknowledge the hospitality of the Aspen Centre for Physics where part of this paper was written. Thanks also to F. Bournaud for comments on an earlier version of the manuscript. The simulations were performed on Jade at the Centre Informatique National de l’Enseignement Supérieur (GENCI grant SAP2191) and on the STFC/DBIS facility DiRAC facility jointly funded by STFC, the large facilities capital fund of BIS and the University of Oxford. LCP was supported by an STFC studentship at Oxford Astrophysics at the time when the majority of this work was undertaken. JD and AS’ research is supported by Adrian Beecroft, the Oxford Martin School and STFC.
References
- Adelberger et al. (2003) Adelberger K. L., Steidel C. C., Shapley A. E., Pettini M., 2003, ApJ, 584, 45
- Agertz et al. (2009) Agertz O., Teyssier R., Moore B., 2009, MNRAS, 397, L64
- Aguirre et al. (2001) Aguirre A., Hernquist L., Schaye J., Katz N., Weinberg D. H., Gardner J., 2001, ApJ, 561, 521
- Birnboim & Dekel (2003) Birnboim Y., Dekel A., 2003, MNRAS, 345, 349
- Bouché et al. (2007) Bouché N., Lehnert M. D., Aguirre A., Péroux C., Bergeron J., 2007, MNRAS, 378, 525
- Brooks et al. (2009) Brooks A. M., Governato F., Quinn T., Brook C. B., Wadsley J., 2009, ApJ, 694, 396
- Cattaneo et al. (2006) Cattaneo A., Dekel A., Devriendt J., Guiderdoni B., Blaizot J., 2006, MNRAS, 370, 1651
- Ceverino et al. (2010) Ceverino D., Dekel A., Bournaud F., 2010, MNRAS, 404, 2151
- David et al. (1990) David L. P., Forman W., Jones C., 1990, ApJ, 359, 29
- Dekel & Birnboim (2006) Dekel A., Birnboim Y., 2006, MNRAS, 368, 2
- Dekel et al. (2009) Dekel A., Birnboim Y., Engel G., Freundlich J., Goerdt T., Mumcuoglu M., Neistein E., Pichon C., Teyssier R., Zinger E., 2009, Nature, 457, 451
- Dekel & Silk (1986) Dekel A., Silk J., 1986, ApJ, 303, 39
- Dubois & Teyssier (2008) Dubois Y., Teyssier R., 2008, A&A, 477, 79
- Dunkley et al. (2009) Dunkley J., Komatsu E., Nolta M. R., Spergel D. N., Larson D., Hinshaw G., Page L., Bennett C. L., Gold B., Jarosik N., Weiland J. L., Halpern M., Hill R. S., Kogut A., Limon M., Meyer S. S., Tucker G. S., Wollack E., Wright E. L., 2009, ApJS, 180, 306
- Efstathiou (2000) Efstathiou G., 2000, MNRAS, 317, 697
- Elmegreen & Elmegreen (2005) Elmegreen B. G., Elmegreen D. M., 2005, ApJ, 627, 632
- Faucher-Giguere & Keres (2010) Faucher-Giguere C., Keres D., 2010, ArXiv e-prints
- Furlanetto & Loeb (2003) Furlanetto S. R., Loeb A., 2003, ApJ, 588, 18
- Greif et al. (2008) Greif T. H., Johnson J. L., Klessen R. S., Bromm V., 2008, MNRAS, 387, 1021
- Haardt & Madau (1996) Haardt F., Madau P., 1996, ApJ, 461, 20
- Heckman et al. (1990) Heckman T. M., Armus L., Miley G. K., 1990, ApJS, 74, 833
- Heckman et al. (2000) Heckman T. M., Lehnert M. D., Strickland D. K., Armus L., 2000, ApJS, 129, 493
- Kennicutt (1998) Kennicutt Jr. R. C., 1998, ApJ, 498, 541
- Kereš et al. (2009) Kereš D., Katz N., Davé R., Fardal M., Weinberg D. H., 2009, MNRAS, 396, 2332
- Kereš et al. (2005) Kereš D., Katz N., Weinberg D. H., Davé R., 2005, MNRAS, 363, 2
- Krumholz & Tan (2007) Krumholz M. R., Tan J. C., 2007, ApJ, 654, 304
- Lehnert & Heckman (1996) Lehnert M. D., Heckman T. M., 1996, ApJ, 462, 651
- Lehnert et al. (1999) Lehnert M. D., Heckman T. M., Weaver K. A., 1999, ApJ, 523, 575
- Mac Low & Ferrara (1999) Mac Low M., Ferrara A., 1999, ApJ, 513, 142
- Madau et al. (2001) Madau P., Ferrara A., Rees M. J., 2001, ApJ, 555, 92
- Martin (1999) Martin C. L., 1999, ApJ, 513, 156
- Martin et al. (2002) Martin C. L., Kobulnicky H. A., Heckman T. M., 2002, ApJ, 574, 663
- McKee & Ostriker (1977) McKee C. F., Ostriker J. P., 1977, ApJ, 218, 148
- Mori et al. (2002) Mori M., Ferrara A., Madau P., 2002, ApJ, 571, 40
- Neistein et al. (2006) Neistein E., van den Bosch F. C., Dekel A., 2006, MNRAS, 372, 933
- Ocvirk et al. (2008) Ocvirk P., Pichon C., Teyssier R., 2008, MNRAS, 390, 1326
- Oppenheimer & Davé (2008) Oppenheimer B. D., Davé R., 2008, MNRAS, 387, 577
- Oppenheimer et al. (2010) Oppenheimer B. D., Davé R., Kereš D., Fardal M., Katz N., Kollmeier J. A., Weinberg D. H., 2010, MNRAS, 406, 2325
- Pettini et al. (2001) Pettini M., Shapley A. E., Steidel C. C., Cuby J., Dickinson M., Moorwood A. F. M., Adelberger K. L., Giavalisco M., 2001, ApJ, 554, 981
- Rasera & Teyssier (2006) Rasera Y., Teyssier R., 2006, A&A, 445, 1
- Scannapieco et al. (2006) Scannapieco C., Tissera P. B., White S. D. M., Springel V., 2006, MNRAS, 371, 1125
- Scannapieco & Brüggen (2010) Scannapieco E., Brüggen M., 2010, MNRAS, 405, 1634
- Shapley et al. (2003) Shapley A. E., Steidel C. C., Pettini M., Adelberger K. L., 2003, ApJ, 588, 65
- Springel & Hernquist (2003) Springel V., Hernquist L., 2003, MNRAS, 339, 289
- Steidel et al. (2010) Steidel C. C., Erb D. K., Shapley A. E., Pettini M., Reddy N., Bogosavljević M., Rudie G. C., Rakic O., 2010, ApJ, 717, 289
- Teyssier (2002) Teyssier R., 2002, A&A, 385, 337
- van de Voort et al. (2010) van de Voort F., Schaye J., Booth C. M., Haas M. R., Dalla Vecchia C., 2010, ArXiv e-prints
- Veilleux et al. (2005) Veilleux S., Cecil G., Bland-Hawthorn J., 2005, ARA&A, 43, 769