Confirmation of IGR J01363+6610 as a Be X-ray binary with very low quiescent X-ray luminosity
Abstract
The field containing the candidate High Mass X-ray Binary IGR J01363+6610 was observed by XMM-Newton on 2009 July 31 for 28 ks. A Be star was previously suggested as the possible counterpart of the INTEGRAL source, and although Chandra, during a 2007 observation, did not detect an X-ray source at the position of the Be star, we find a variable source (XMMU J013549.5+661243) with an average X-ray flux of ergs cm-2 s-1 (0.2–12 keV, unabsorbed) at this position with XMM-Newton. The spectrum of this source is consistent with a hard power-law with a photon index of and a column density of cm-2 (90% confidence errors). These results, along with our optical investigation of other X-ray sources in the field, makes the association with the Be star very likely, and the 2 kpc distance estimate for the Be star indicates an X-ray luminosity of ergs s-1. This is lower than typical for a Be X-ray binary, and the upper limit on the luminosity was even lower ( ergs s-1 assuming the same spectral model) during the Chandra observation. We discuss possible implications of the very low quiescent luminosity for the physical properties of IGR J01363+6610.
Subject headings:
stars: neutron — X-rays: stars — stars: emission-line, Be — black hole physics — stars: individual (IGR J01363+6610)1. Introduction
The hard X-ray imaging of the Galactic plane by the International Gamma-Ray Astrophysics Laboratory (INTEGRAL) satellite (Winkler et al., 2003) has uncovered a large number of new or previously poorly studied “IGR” sources (Bodaghee et al., 2007; Bird et al., 2010). While INTEGRAL excels at detecting sources in the 20–50 keV band, it only localizes the sources to –, requiring follow-up observations with other X-ray satellites to obtain secure optical or IR counterparts, allowing for a determination of the nature of the sources (Walter et al., 2006; Tomsick et al., 2008; Rodriguez, Tomsick & Chaty, 2009).
As more and more of these sources have been identified, possibly the biggest surprise is the large number of High Mass X-ray Binaries (HMXBs) as well as the properties of these systems. Many of the dozens of INTEGRAL HMXBs (Bodaghee et al., 2007) have large levels of intrinsic absorption with – cm-2 (e.g., Walter et al., 2006), and these are commonly called obscured HMXBs. In many cases, it appears that this is due to the compact object being embedded in a strong stellar wind (Filliatre & Chaty, 2004; Moon et al., 2007; Chaty et al., 2008). Some members of the group of INTEGRAL HMXBs exhibit other extreme properties, including the high amplitude X-ray flaring of the Supergiant Fast X-ray Transients (SFXTs, in’t Zand, 2005; Smith et al., 2006) or long-period pulsations from very slowly rotating neutron stars (Patel et al., 2007).
INTEGRAL observations have also led to the addition of more HMXBs in the Be X-ray binary class (Rappaport & van den Heuvel, 1982). The optical flux from these systems is dominated by an early-type star with emission lines from a circumstellar disk. In most cases, transient X-ray emission demonstrates the binary nature of the system as eccentric orbits lead to periodic X-ray outbursts when the compact object approaches periastron. Of the 64 known Be X-ray binary systems, X-ray pulsations indicate the presence of a neutron star in 42 cases, and the compact object type is unknown for the remaining systems (Belczynski & Ziolkowski, 2009). One of the interesting properties of this class is the observed correlation between the orbital period and the spin period of the neutron star (Corbet, 1986).
IGR J01363+6610 has been tentatively classified as a Be X-ray binary. The source was discovered during INTEGRAL observations on 2004 April 19 but was not detected 2 weeks later, indicating that the source is transient (Grebenev et al., 2004). The peak flux observed from the source was 17 mcrab ( ergs cm-2 s-1) in the 17–45 keV band and 9 mcrab ( ergs cm-2 s-1) in the 8–15 keV band (Grebenev et al., 2004). The 3- upper limit in the 17–45 keV band 2 weeks later was 11 mcrab (Grebenev et al., 2004), and the source has not been detected in other INTEGRAL observations even though 2.3 Ms of INTEGRAL time have been accumulated at the position of this source (Bird et al., 2010). Reports of non-detection include both detailed studies of the Cassiopeia region (den Hartog et al., 2006) and catalogs indicating that the source was only detected during the discovery outburst in 2004 (Krivonos et al., 2007; Bird et al., 2007, 2010).
Although the INTEGRAL position uncertainty of leaves a large error region, a Be star was found within the error circle using narrow-band H imaging and follow-up optical spectroscopy, and it has been suggested to be the likely counterpart (Reig et al., 2004, 2005). However, a sensitive X-ray observation taken with the Chandra X-ray Observatory in 2007 failed to detect the Be star (Tomsick et al., 2008). At the 2 kpc distance estimated for the Be star (Reig et al., 2005), the non-detection implies an upper limit on the X-ray luminosity of ergs cm-2 s-1 (Tomsick et al., 2008), which is lower than quiescent luminosities for other Be X-ray binaries (Campana et al., 2002). This luminosity approaches the level that has been seen during quiescent periods from transient Low Mass X-ray Binaries (LMXBs) due to thermal emission from the neutron star surface (Brown, Bildsten & Rutledge, 1998; Campana et al., 1998). Although neutron stars in HMXBs might not be heated to the high levels seen for LMXBs, it is interesting that these observations probe this luminosity regime.
Currently, there are significant uncertainties about the nature of IGR J01363+6610. While we know that it is an X-ray transient, and the hard X-ray emission makes it likely that it is a binary (although its orbital period is unknown), the Chandra non-detection makes it unclear whether it is really a Be X-ray binary. Finding a Be star in the relatively large INTEGRAL error circle is not convincing because Be stars are more commonly found as single stars rather than being part of a binary system (Porter & Rivinius, 2003). Furthermore, we cannot be certain that the compact object in the system is a neutron star since pulsations have not been detected.
In this paper, we report on a second sensitive X-ray observation of the IGR J01363+6610 field with XMM-Newton along with optical spectroscopy of the Be star as well as other X-ray sources with optical counterparts in the field. With XMM-Newton, we confirm that the Be star is an X-ray source. We also re-analyze the Chandra observation and discuss the 2007 results in the context of the new information from XMM-Newton.
2. Observations
2.1. XMM-Newton
We observed the IGR J01363+6610 field with XMM-Newton on 2009 July 31 from 14.4 h to 22.3 h UT. The observation (ObsID 0603850101) occurred during XMM-Newton revolution 1766. The EPIC pn, MOS1, and MOS2 instruments (Strüder et al., 2001; Turner et al., 2001) were all operated in Full Frame mode with a medium filter. We used the XMM-Newton Science Analysis Software (SAS-10.0.0) package to process the raw data files. We used the SAS tool cifbuild to obtain the necessary “current calibration files” for the observation. Then, we reprocessed the pn, MOS1, and MOS2 data using epproc and emproc, yielding photon event lists for the three instruments. Although proton flares sometimes cause portions of XMM-Newton observations to have very high backgrounds, we did not find evidence for proton flares, and we were able to use the full exposure time.
2.2. Chandra X-ray Observatory
We also used an observation of the IGR J01363+6610 field made by the Chandra X-ray Observatory. The observation (ObsID 7533), which had an exposure time of 4,976 s, was made on 2007 June 8. We used the Advanced CCD Imaging Spectrometer (ACIS; Garmire et al., 2003), and the aimpoint was placed on the ACIS-S3 chip. The 90% confidence INTEGRAL error circle for IGR J01363+6610 (Bird et al., 2010) is contained on the ACIS-S3 and ACIS-S4 chips. Results of the observation were previously reported in Tomsick et al. (2008), and the procedures used for data reduction are described in that work.
2.3. MDM Optical Observations
Optical spectroscopic observations were made with the Boller & Chivens CCD spectrograph on the 2.4 m Hiltner Telescope of the MDM Observatory on 2009 August 23 UT. Conditions were clear, but with high humidity. The 150 g/mm grating, blazed at 4700 Å, was used with a 1′′ wide slit, which gave a wavelength coverage of 37007360 Å at 7.6 Å resolution. Spectra of six stars coinciding with X-ray sources in the field of IGR J01363+6610 were obtained, each with an exposure time of 120 s. Of these, three are inside the refined INTEGRAL error circle and are presented here. Spectral reduction was performed using standard IRAF procedures. Flux calibration used Oke & Gunn (1983) standard stars, although the spectrophotometry is not expected to be accurate because of the narrow slit.
3. Results
3.1. X-ray Sources in the INTEGRAL Error Circle
For the XMM-Newton analysis, we used the SAS tool edetect_chain to search for sources in the 30′ diameter field-of-view (FOV) of the MOS1 and MOS2 instruments, and included photons in the 0.1–10 keV energy band. All seven of the MOS2 CCDs were operational, but, for MOS1, CCD#6 was not active because it was switched off after an anomaly that occurred in 2005. While this means that some of the MOS2 FOV is not covered by MOS1, the central CCD, which includes the entire INTEGRAL error circle, is covered by both MOS units.
We found a total of 21 sources, including 14 detected by both MOS units and seven detected by MOS2 in the part of the FOV that MOS1 did not cover. We determined the number of counts for each source using radius apertures and subtracted the background using circular apertures of the same size in 16 source-free regions of the detector. The mean number of background counts per aperture is for MOS1 and for MOS2 (in 28,180 s of exposure time). The sources range in brightness from to counts (both of these sources are in the region covered only by MOS2). Five of the sources are in the INTEGRAL 90% confidence error circle for IGR J01363+6610 given in Bird et al. (2010). These five sources include the second brightest source in the field ( counts) as well as sources with , , , and counts, where these numbers of counts are averages of the two MOS detectors.
The XMM-Newton source names and positions are given in Table 1. In addition to MOS1 and MOS2, we also determined the position measured by the pn instrument for each source, and we report the average position measured by the three instruments (except for XMMU J013632.4+660924, which fell between two pn CCD chips). In averaging the positions, we weighted each measurement by its statistical uncertainty. In Table 1, we also report the overall 90% confidence position uncertainties, and, in each case, the error is dominated by the systematic pointing uncertainty of 111In the document entitled “EPIC status of calibration and data analysis” (XMM-SOC-CAL-TN-0018), Guainazzi et al. report an rms value for the systematic pointing uncertainty of , and we have multiplied this by 1.7 to obtain the 90% confidence value.
| Name | R.A. (J2000)222The position is the weighted average of the positions measured by the three XMM-Newton instruments. | Decl. (J2000)a | Position | MOS |
|---|---|---|---|---|
| Uncertainty333The 90% confidence uncertainty in the XMM-Newton position. This includes a systematic contribution of due to the absolute pointing uncertainty and a statistical contribution. We have added the two contributions in quadrature. | counts444The average of the 0.1–10 keV count rates measured by MOS1 and MOS2. | |||
| XMMU J013549.5+661243 | + | |||
| XMMU J013606.5+661304 | + | |||
| XMMU J013620.8+660851 | + | |||
| XMMU J013632.4+660924555This source is detected by MOS1 and MOS2, but not by the pn instrument. It falls on a gap between pn CCD chips. | + | |||
| XMMU J013644.2+661302 | + |
Using the 2007 observation of the field by Chandra, we previously reported three sources in the INTEGRAL error circle (Tomsick et al., 2008). However, in the most recent INTEGRAL source catalog (Bird et al., 2010), the best estimate of the IGR J01363+6610 position has shifted by relative to the value used in Tomsick et al. (2008), and a fourth Chandra source, CXOU J013644.5+661301, is now also consistent with the INTEGRAL position for IGR J01363+6610, and its Chandra position is R.A. (J2000) = , Decl. (J2000) = + with a 90% confidence uncertainty of . Of the four Chandra sources, two are coincident with XMM-Newton sources. Thus, merging the 2007 Chandra source list with the list of 2009 XMM-Newton leaves a list of seven X-ray sources in the INTEGRAL error circle, and these sources are listed in Table 2.
| Catalog/Source666The catalogs are the 2 Micron All-Sky Survey (2MASS) and the United States Naval Observatory (USNO-B1.0). | Separation777The uncertainty on the separation is the addition (in quadrature) of the X-ray source position error and the 2MASS or USNO-B1.0 error. | Magnitudes | ||
| (1) XMMU J013549.5+661243 | ||||
| USNO-B1.0 1562-0030282 | ||||
| 2MASS J01354986+6612433 | ||||
| (2) XMMU J013606.5+661304 | ||||
| USNO-B1.0 1562-0030364 | ||||
| 2MASS J01360684+6613021 | ||||
| (3) CXOU J013609.9+661157 | ||||
| The closest USNO-B1.0 source is away. | ||||
| The closest 2MASS source is away. | ||||
| (4) XMMU J013620.8+660851 | ||||
| The closest USNO-B1.0 source is away. | ||||
| The closest 2MASS source is away. | ||||
| (5) CXOU J013621.2+660928 | ||||
| USNO-B1.0 1561-0031113 | ||||
| 2MASS J01362115+6609286 | ||||
| (6) XMMU J013632.4+660924/CXOU J013632.8+660924 | ||||
| The closest USNO-B1.0 source is away. | ||||
| The closest 2MASS source is away. | ||||
| (7) XMMU J013644.2+661302/CXOU J013644.5+661301 | ||||
| USNO-B1.0 1562-0030589 | ||||
| 2MASS J01364458+6613014 | ||||
3.2. Optical and IR Counterparts and Optical Spectroscopy
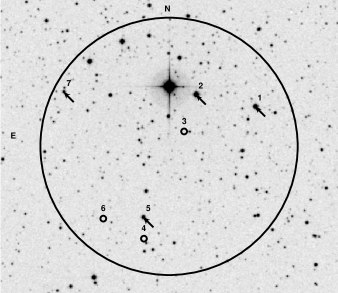
For the seven X-ray sources listed in order of R.A. in Table 2, we searched for optical and infrared (IR) counterparts in the United States Naval Observatory (USNO-B1.0) and 2 Micron All-Sky Survey (2MASS) catalogs. Four of the sources (designated as #1, #2, #5, and #7) have optical and IR counterparts, and the names of these counterparts and their magnitudes are given in Table 2. For the other three X-ray sources (#3, #4, and #6), the nearest USNO and 2MASS sources are 7′′ away, which indicates that these X-ray sources are not associated with any sources in the USNO or 2MASS catalogs. Figure 1 shows a red (close to -band) optical image from the Digitized Sky Survey with the revised INTEGRAL error circle and the seven X-ray sources labeled.
X-ray source #1 is the Be star that was previously identified using optical imaging and spectroscopy taken in 2004 (Reig et al., 2004, 2005). The optical spectrum of this star (USNO-B1.0 1562-0030282) is shown in Figure 2 and has the blue continuum and the H and H emission lines indicative of a Be star. The equivalent width (EW) of H is – Å, which is consistent with the value measured by Reig et al. (2004), suggesting that the Be star’s circumstellar disk is stable. Interstellar absorption features in the spectrum can be used to estimate the extinction following the correlations in Herbig (1975). Most commonly, the Å diffuse interstellar band is used for this purpose, but it falls in a poorly exposed region of our spectrum. Instead we use the 5780 Å feature. With an EW of 1.0 Å, it corresponds to in the range 1.52.0, which is consistent with the estimate of Reig et al. (2005) based on the spectral classification and photometry, .
X-ray source #2 is coincident with USNO-B1.0 1562-0030364, which is also known as the bright () optical source TYC 4043-860-1. There is some confusion about whether this is an emission line star based on a catalog of stars with H in emission (González & González, 1956). However, H images and optical spectra taken, respectively, 2 months and 5 months after the X-ray outburst from IGR J01363+6610 do not show evidence for H emission and the spectrum shows H in absorption (Reig et al., 2004). The XMM-Newton observation provides the first evidence that this is also an X-ray source, but the lack of an H emission line in 2004 makes it very unlikely to be the correct IGR J01363+6610 counterpart.
We also obtained optical spectra for the only other two X-ray sources in the INTEGRAL error circle with optical/IR counterparts. The spectra for sources #5 and #7 are shown in Figure 3, and we identify them as G-type and early M-type stars, respectively. Like Be X-ray binaries, LMXBs usually show H in emission during outbursts (Fender et al., 2009) and during quiescence (Orosz et al., 2002; Charles & Coe, 2006). Also, symbiotic systems often show strong H in emission (Chakrabarty & Roche, 1997). However, there are counter-examples for both LMXBs and symbiotics. In any case, as sources #5 and #7 do not have emission lines, there is no reason to consider that they might be the IGR J01363+6610 counterpart.


Thus, these observations show that the Be star that was previously considered to be the likely counterpart of IGR J01363+6610 is coincident with XMMU J013549.5+661243, which was the brightest X-ray source in the INTEGRAL error circle during the 2009 XMM-Newton observation. The fact that we have now conclusively shown that the Be star is a transient X-ray source and that none of the other fainter X-ray sources in the INTEGRAL error circle have optical properties that would be expected of a hard X-ray source strengthens the association between the Be star and IGR J01363+6610, and we focus exclusively on the X-ray properties of the Be star XMMU J013549.5+661243 in the remainder of this paper.
3.3. XMMU J013549.5+661243
3.3.1 Energy Spectrum
We used the SAS tool xmmselect to produce MOS1, MOS2, and pn energy spectra for XMMU J013549.5+661243 and considered the recommendations given in a recent EPIC (MOS and pn) calibration document888The document entitled “EPIC status of calibration and data analysis” by Guainazzi et al. (XMM-SOC-CAL-TN-0018) is based on results obtained using SAS-10.0.0. It was released on 2010 July 16 and can be found at http://xmm2.esac.esa.int/external/xmm_sw_cal/calib/index.shtml. for event filtering and energy ranges. For MOS, we used event filtering with the expression “#XMMEA_EM && PATTERN=12” and included events within an aperture with a radius. A background spectrum was extracted from an annulus centered on the source, and the source and background regions are shown in Figure 4a. For the pn instrument, we used event filtering with the expression “FLAG=0 && PATTERN=4” and extracted spectra from source and background regions. For all three instruments, we used the SAS tools rmfgen and arfgen to make response matrices. For the MOS detectors, we used the 0.1–10 keV bandpass, and for the pn detector, we used the 0.2–12 keV bandpass. We rebinned each spectrum, and we fitted the spectra using statistics.
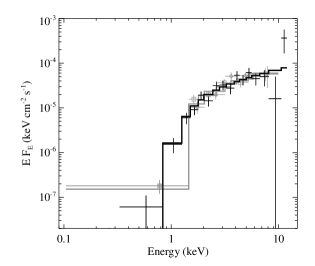
We used the XSPEC version 12 software for spectral fitting, and we tried several models. The results of using an absorbed power-law are shown in Table 3 and Figure 5. For absorption, we used the photoelectric absorption cross sections from Balucinska-Church & McCammon (1992) and elemental abundances from Wilms, Allen & McCray (2000), which correspond to the estimated abundances for the interstellar medium. This model gives a good fit (), and requires a relatively hard power-law photon index of . The power-law fit gives a 0.2–12 keV unabsorbed flux of ergs cm-2 s-1 and a column density of cm-2, which is somewhat higher than the value through the Galaxy along the line of sight, cm-2 (Kalberla et al., 2005). Although this could indicate a small amount of absorption local to the source, it is much lower than the values near cm-2 seen for the sources usually considered to be obscured HMXBs. Another argument against local absorption of the X-ray source is that the value of –2.0 corresponds to an in the range (1.0–1.4) cm-2 (Ryter, 1996), which is consistent with the column density determined from the X-ray spectrum.
We also fitted the energy spectrum with blackbody and thermal Bremsstrahlung models, and the parameters are given in Table 3. A fit with a 1.3 keV blackbody is similar in quality to the power-law (), but the spectrum does not allow us to distinguish between thermal and non-thermal models. However, at 2 kpc, the blackbody model implies an emitting region with a radius of only cm, which is too small to be physical. The Bremsstrahlung model requires a relatively high temperature (11 keV), which makes it very similar to a power-law over the XMM-Newton bandpass. Although we are not able to distinguish between models, it is important to note that the power-law fit above shows that the spectrum is hard, as expected for an IGR source and especially for an HMXB.
| Parameter | Value999The errors on the parameters are for , corresponding to 90% confidence for one parameter of interest. |
|---|---|
| Power-law model | |
| cm-2 | |
| (unabsorbed, 0.2–12 keV) | ergs cm-2 s-1 |
| 23.1/26 | |
| Blackbody model | |
| cm-2 | |
| keV | |
| 101010The normalization for this model is parameterized in terms of the radius of a spherical emitting region in units of km () and the distance in units of 10 kpc (). | |
| 21.5/26 | |
| Bremsstrahlung model | |
| cm-2 | |
| 12 keV | |
| 111111The normalization for this model is cm-5 where is the source distance, and and are, respectively, the electron and ion number densities within the volume . | cm-5 |
| 22.6/26 | |
3.3.2 Long- and Short-Term X-ray Variability
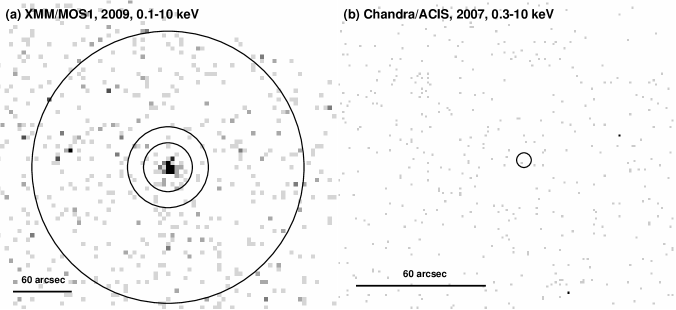
Comparing the two panels of Figure 4 shows the difference between fluxes in 2009 (the XMM-Newton observation) and 2007 (the Chandra observation). We did not detect the Be star during a 5 ks Chandra/ACIS observation (Tomsick et al., 2008), and 1 count is detected by ACIS within the XMM-Newton error circle. Thus, using Poisson statistics, this corresponds to a 90% confidence upper limit of 3.9 counts (Gehrels, 1986). For the power-law spectral model measured by XMM-Newton ( and cm-2), this corresponds to an absorbed 0.3–10 keV flux of ergs cm-2 s-1 and an unabsorbed flux of ergs cm-2 s-1, which is 6.6 times lower than the flux seen during the XMM-Newton observation. During the original outburst detected by INTEGRAL in 2004, an 8–15 keV flux of 9 mcrab ( ergs cm-2 s-1) was measured using the JEM-X instrument. In the 8–15 keV band, the flux measured with XMM-Newton in 2009 was ergs cm-2 s-1, which is a factor of 1,150 lower than the outburst level. Thus, the quiescent upper limit obtained with Chandra represents a flux 7,600 times lower than the level seen during outburst.
We also find evidence for shorter term variability during the XMM-Newton observation. Figure 6 shows the source and background rates combined for all three XMM-Newton detectors in the 0.2–12 keV band with 250 s time bins. The light curve shows that the 0.2–12 keV rates can change from values as low as – to . We used a test to determine the significance of the variability. The best fit that can be obtained with a constant rate has a for 106 degrees of freedom, which indicates that the variability is significant at the 99% confidence level.

4. Discussion
4.1. The Nature of IGR J01363+6610
Our results show that XMMU J013549.5+661243 is a hard X-ray source coincident with a Be star at a distance of 2 kpc. At this distance, the inferred X-ray luminosity measured by XMM-Newton is ergs s-1. While this would be a relatively high X-ray luminosity for an isolated B1 star, it is not too far above the values reported by Cohen, Cassinelli & Macfarlane (1997) for such stars. However, in nearly all cases of isolated B-type stars, the X-ray emission is thermal with temperatures that are typically not above a few K (Cohen, Cassinelli & Macfarlane, 1997; Cohen, 2000), and their spectra fall very steeply above 0.25 keV. The very hard X-ray spectrum that we measure for XMMU J013549.5+661243 is inconsistent with a thermal spectrum with such a low temperature, indicating that the Be star must have a compact binary companion that is emitting most of the X-ray emission.
While the X-ray luminosity and spectrum are not consistent with an isolated star, the XMM-Newton data alone are not sufficient to determine the nature of the compact binary companion. There are known Be systems with both white dwarf and neutron star companions that can produce hard spectra. For example, there are several Cas-like systems that may harbor white dwarfs and have power-law spectral components with photon indices of 1.4–1.7 (Motch et al., 2007). However, based on our study of the X-ray sources in the IGR J01363+6610 field, we argue that it is very likely that XMMU J013549.5+661243 is the quiescent counterpart to IGR J01363+6610. In this case, the outburst detected by INTEGRAL indicates that the source can produce an X-ray luminosity as high as ergs s-1 along with variations in X-ray luminosity by a factor of 7,600 (when the Chandra observation is considered as well). In contrast, the Cas-like systems have luminosities typically near ergs s-1, and while they show variability in flux by factors of a few, they do not have large outbursts (Motch et al., 2007). Thus, the most likely interpretation of the available information is that IGR J01363+6610 is a Be X-ray binary with a neutron star (or perhaps a black hole as discussed below) accretor. In the following, we discuss IGR J01363+6610 in this context.
4.2. Accretion Regimes and the X-ray Luminosity
Models for X-ray emission from Be X-ray binaries are based on the picture of a neutron star with a relatively strong magnetic field ( G) and a relatively slow rotation speed (–1,000 s) periodically accreting from the circumstellar disk around the Be star (Rappaport & van den Heuvel, 1982; Corbet, 1986). In most systems, the orbits have non-zero eccentricity, and “Type 1” X-ray outbursts occur when the neutron star makes its closest approach to the star so that the outburst periodicity is equal to the orbital period, .
Within this physical picture, there are two accretion regimes that are usually considered. One regime is at higher mass accretion rates when the accretion pressure overcomes the centrifugal magnetic field barrier, and matter is accreted directly onto the poles of the neutron star (Corbet, 1996). The second regime is during times when the accretion is inhibited by the magnetic field. This is often called the propeller regime (Illarionov & Sunyaev, 1975), and the X-ray emission is much lower in this regime because the matter being accreted only reaches the neutron star magnetosphere rather than falling onto the neutron star surface. A gap is predicted between the minimum luminosity in which the system can be in the direct accretion regime and the maximum luminosity in which the system can be in the propeller regime (Corbet, 1996), and we define to be equal to this luminosity ratio. For typical neutron star properties (1.4 mass, 10 km radius, G magnetic field), (Campana et al., 2002), and values of range from 100 for fast rotators to 10,000 for slow rotators (Corbet, 1996).
Assuming a distance of 2 kpc and a spectral shape consistent with the power-law model measured using XMM-Newton, IGR J01363+6610 has been observed by INTEGRAL at ergs s-1 in 2004, by Chandra at ergs s-1 in 2007, and by XMM-Newton at ergs s-1 in 2009. These luminosities are unabsorbed values measured in or extrapolated into the 0.2–12 keV band. The 2004 outburst luminosity is at the lower end of typical values for normal (“type I”) Be X-ray binary outbursts, which are in the to ergs s-1 range (Stella, White & Rosner, 1986; Wilson et al., 2005). Still, it is likely (but perhaps not certain if the neutron star spin or magnetic field strength have extreme values) that the source reached a high enough accretion rate to enter the direct accretion regime. Following Corbet (1996) and Campana et al. (2002), we derive an upper limit on the luminosity produced by magnetospheric emission of . Thus, under the assumptions that the neutron star properties (mass, radius, and magnetic field strength) are typical and the system reached the direct accretion regime during the 2004 outburst, the luminosity measured by XMM-Newton in 2009 implies a neutron star spin period less than 17 s for IGR J01363+6610.
While the propeller regime may extend to very low luminosities, a third regime to consider is when the mass accretion rate onto the neutron star drops to zero. In this case, any X-ray emission produced could have contributions from the Be star and from the neutron star. Emission from the neutron star would be thermal in origin and would be extremely soft. Such components are seen at temperatures near 50–150 eV in LMXBs (Brown, Bildsten & Rutledge, 1998; Campana et al., 1998; Degenaar et al., 2009) and although it is unclear whether this regime occurs for Be X-ray binaries, it has probably been seen for the HMXB Supergiant Fast X-ray Transient (SFXT) IGR J17544–2619 (in’t Zand, 2005). During the XMM-Newton observation of IGR J01363+6610, we are not seeing this regime since we measure a hard spectrum, which is either non-thermal or has a much higher temperature ( keV) than would be expected from a non-accreting neutron star. Since we did not detect the source during the Chandra observation, the spectrum is not constrained. Assuming the same as seen during outburst ( cm-2), we can put limits on the flux and the temperature of the neutron star by requiring an ACIS count rate below the upper limit given above. We use the magnetic neutron star model nsa (Pavlov et al., 1995), assuming emission from the entire neutron star, a mass of 1.4, a radius of 10 km, a distance of 2 kpc, and a magnetic field of G. The upper limit on the (unredshifted) surface temperature is then 80 eV, and the unabsorbed 0.2–12 keV luminosity upper limit is ergs s-1. Changes in the assumptions will affect this, particularly changes in the assumed or distance. For instance, a choice of cm-2 gives eV and ergs s-1, or a distance of 3 kpc gives eV and ergs s-1. If the X-ray emission in this quiescent state is dominated by hot spots at the polar caps, their temperature may be higher, but the temperature of the rest of the neutron star surface must be even lower.
4.3. The Quiescent Luminosity and Possible Implications
The above analysis suggests that the IGR J01363+6610 luminosities can be explained within the standard picture for Be-neutron star X-ray binaries, but the luminosity upper limit that we infer from the Chandra observation is lower than has been previously reported from these systems. Campana et al. (2002) present a study that focuses on quiescent X-ray observations of 3 Be X-ray binaries, and their luminosities are (1–3) ergs s-1 (0.1–10 keV) for A 0538–66, (0.8–2) ergs s-1 (0.5–10 keV) for 4U 0115+63, and ergs s-1 (0.5–10 keV) for V 0332+53. In addition, quiescent luminosities of (3–9) ergs s-1 and (2–4.5) ergs s-1 have been reported for GRO J2058+42 and A 0535+26, respectively (Wilson et al., 2005; Negueruela et al., 2000). The candidate Be X-ray binary XTE J1829–098 has been observed at a luminosity of ( kpc)2 ergs s-1 (Halpern & Gotthelf, 2007), which is low for a Be X-ray binary, but still not as low as we find for IGR J01363+6610. It should, however, be noted that, for A 0535+26, Negueruela et al. (2000) found the source at this luminosity after it had previously been reported to have a quiescent luminosity two orders of magnitude higher (Motch et al., 1991). Thus, it is clear that even when they are not in outburst, these sources exhibit a large amount of variability, and many observations may be required for each source to define a quiescent luminosity.
While the Chandra upper limit of ( kpc)2 ergs s-1 obtained with a hard spectrum as seen in outburst is significantly lower than has been found for other Be X-ray binaries, this conclusion does depend on the validity of the distance determination. The 2 kpc distance from Reig et al. (2005) depends on the measurement of the -band magnitude, which is given in Reig et al. (2005) to high precision (, based on three measurements), the extinction, and the spectral type. Reig et al. (2005) give a value of , and our determination is consistent with this suggesting that the uncertainty in the distance due to the measurement of extinction is not large. Probably the largest uncertainty is related to the spectral type. Reig et al. (2005) use a spectral type of B1V and an absolute magnitude of = –3.2 for the 2 kpc estimate, but they indicate that the star could be a more luminous sub-giant (i.e., B1IV). The difference in the absolute magnitude of a main sequence B-type star compared to a B-type sub-giant is 0.6–0.7 magnitudes (Cox, 2000), so it is unlikely that the star is more luminous than –4.0, which corresponds to a distance upper limit near 3 kpc. This, in turn, indicates an upper limit on the quiescent X-ray luminosity of ergs s-1, which is still significantly lower than the X-ray luminosities given above for comparison.
Although it is not clear why the quiescent luminosity is so much lower for IGR J01363+6610, there are several potentially interesting possibilities. Among the more trivial is the possibility that the short (5 ks) Chandra observation occurred during an X-ray eclipse. Although eclipses are not common for Be X-ray binaries due to their typically wide orbits, we currently cannot rule out this possibility since the orbit and binary inclination for IGR J01363+6610 are unconstrained. It is also possible that Chandra did not detect the source either because the compact object was highly obscured during the Chandra observation or that Chandra happened to catch the source during a low point in its normal short-term variability. Finally, there is also the possibility that the circumstellar disk, which was strongly present in 2004 and 2009 based on the detection of the H emission line with an EW of –50Å, had dissipated during the 2007 Chandra observation. Although dissipation and re-formation of a circumstellar disk on this time scale did occur in the case of GRO J1008–57 (Coe et al., 2007), and significant disk loss was observed for IGR J06074+2205 on a time scale of 3 years (Reig, Zezas & Gkouvelis, 2010), in both of these cases, the H lines were significantly weaker than measured for IGR J01363+6610. There is no precedent that we are aware of for dissipation and re-formation of a circumstellar disk in a system with an H EW as large as the one measured for IGR J01363+6610. While there are possible explanations for the luminosity upper limit measured over a short period of time by Chandra, these explanations do not apply to the XMM-Newton observation. The luminosity measured by XMM-Newton would also make it one of, if not the, lowest luminosity Be X-ray binaries. Thus, it is likely that the low luminosities measured for IGR J01363+6610 require that this system has some unusual physical properties.
The Be X-ray binaries with known compact object type have neutron stars, but binary evolution models predict that between zero and two of the 64 known Be X-ray binary systems harbor a black hole instead of a neutron star (Belczynski & Ziolkowski, 2009). The observational signatures for Be X-ray binaries with black holes are not as clear as neutron star signatures, such as pulsations. At high mass accretion rates, one would expect the X-ray emission from black holes to be softer and brighter due to the presence of an inner accretion disk that cannot form in systems with highly magnetized neutron stars due to the magnetosphere. At moderate to low mass accretion rates, accreting black holes typically have hard spectra (Remillard & McClintock, 2006). At very low mass accretion rates, black hole systems would likely be fainter than neutron star systems because the latter exhibit magnetospheric and surface emission, which are both absent from black holes. The expected hard spectrum and the faint quiescent luminosity are both consistent with the observed properties of IGR J01363+6610.
There may, however, be a less exotic explanation if the binary orbit of IGR J01363+6610 causes a neutron star to sample an unusually low density part of the circumstellar disk. This could occur if the system has a long orbital period with relatively low eccentricity. As pointed out by Reig et al. (2005), the EW of the H line for IGR J01363+6610 is one of the strongest of any Be X-ray binary, suggesting the presence of a large circumstellar disk, which might favor a large and nearly circular orbit over a highly eccentric orbit. While the system may have a large circumstellar disk, Negueruela & Okazaki (2001) have shown that tidal interations of the neutron star can lead to truncation of the circumstellar disk in low eccentricity systems. In addition to providing a possible explanation for the low quiescent luminosity of IGR J01363+6610, the fact that the disk can be truncated to a size smaller than the Be star’s Roche lobe means that the system will not show luminous outbursts (Okazaki & Negueruela, 2001), which is consistent with what has been seen so far for IGR J01363+6610.
Like IGR J01363+6610, the orbital parameters for the other Be X-ray binaries with the strongest H emission lines, A 1118–616 (Coe et al., 1994) and IGR J01583+6713 (Kaur et al., 2008), are not known. It has been suggested that A 1118–616 has a nearly circular orbit based on its having a small number of outbursts with no clear periodicity (Coe et al., 1994). It has been argued that both of these systems have relatively long orbital periods (0.6–2.2 years) based on measured neutron star spin periods of 405.6 s and 469.2 s and the – relationship for Be X-ray binaries (Corbet, 1986; Coe et al., 1994; Kaur et al., 2008; Doroshenko et al., 2010). However, for IGR J01583+6713, the detection of X-ray pulsations was noted as being marginal in Kaur et al. (2008). Although there is no direct indication of the orbital or spin period for IGR J01363+6610, it should be noted that the limit of s mentioned above could be taken as evidence for a smaller ; however, we view the evidence for a limit on the spin period as being relatively weak.
5. Summary and Conclusions
In summary, the detection of the variable hard X-ray source XMMU J013549.5+661243 at the location of a Be star provides confirmation that IGR J01363+6610 is a Be X-ray binary. Although some of its properties suggest that it is a fairly typical HMXB, its 2007 non-detection by Chandra indicate a quiescent X-ray luminosity that is significantly lower than has been measured previously for other Be X-ray binaries. While some possible explanations for the low luminosity (an eclipse, a large change in the column density or spectrum, an extended drop in mass accretion rate, or dissipation of the Be star’s circumstellar disk) may be consistent with relatively normal Be X-ray binary properties, other possibilities would require that IGR J01363+6610 has unusual properties. One possibility is that the system has a large and relatively circular orbit, which could explain the low duty cycle for outbursts and, perhaps, the low quiescent luminosity. Another very interesting possibility is that this could be a Be-black hole system. The former suggestion could be confirmed by a measurement of the orbital period (although this will be challenging since the source does not seem to produce regular outbursts), and the latter suggestion could be refuted with the detection of pulsations during another outburst from the source.
References
- Balucinska-Church & McCammon (1992) Balucinska-Church, M., & McCammon, D., 1992, ApJ, 400, 699
- Belczynski & Ziolkowski (2009) Belczynski, K., & Ziolkowski, J., 2009, ApJ, 707, 870
- Bird et al. (2010) Bird, A. J., et al., 2010, ApJS, 186, 1
- Bird et al. (2007) Bird, A. J., et al., 2007, ApJS, 170, 175
- Bodaghee et al. (2007) Bodaghee, A., et al., 2007, A&A, 467, 585
- Brown, Bildsten & Rutledge (1998) Brown, E. F., Bildsten, L., & Rutledge, R. E., 1998, ApJ, 504, L95
- Campana et al. (1998) Campana, S., Colpi, M., Mereghetti, S., Stella, L., & Tavani, M., 1998, A&A Rev., 8, 279
- Campana et al. (2002) Campana, S., Stella, L., Israel, G. L., Moretti, A., Parmar, A. N., & Orlandini, M., 2002, ApJ, 580, 389
- Chakrabarty & Roche (1997) Chakrabarty, D., & Roche, P., 1997, ApJ, 489, 254
- Charles & Coe (2006) Charles, P. A. & Coe, M. J., 2006, Optical, ultraviolet and infrared observations of X-ray binaries, in Compact stellar X-ray sources. Edited by Walter Lewin & Michiel van der Klis: Cambridge University Press, 215
- Chaty et al. (2008) Chaty, S., Rahoui, F., Foellmi, C., Tomsick, J. A., Rodriguez, J., & Walter, R., 2008, A&A, 484, 783
- Coe et al. (2007) Coe, M. J., et al., 2007, MNRAS, 378, 1427
- Coe et al. (1994) Coe, M. J., et al., 1994, A&A, 289, 784
- Cohen (2000) Cohen, D. H., 2000, in IAU Colloq. 175: The Be Phenomenon in Early-Type Stars, ed. M. A. Smith, H. F. Henrichs, & J. Fabregat, Vol. 214, 156
- Cohen, Cassinelli & Macfarlane (1997) Cohen, D. H., Cassinelli, J. P., & Macfarlane, J. J., 1997, ApJ, 487, 867
- Corbet (1986) Corbet, R. H. D., 1986, MNRAS, 220, 1047
- Corbet (1996) Corbet, R. H. D., 1996, ApJ, 457, L31
- Cox (2000) Cox, A. N., 2000, Allen’s astrophysical quantities, 4th ed. Publisher: New York: AIP Press; Springer, Edited by Arthur N. Cox.
- Degenaar et al. (2009) Degenaar, N., et al., 2009, MNRAS, 396, L26
- den Hartog et al. (2006) den Hartog, P. R., Hermsen, W., Kuiper, L., Vink, J., in’t Zand, J. J. M., & Collmar, W., 2006, A&A, 451, 587
- Doroshenko et al. (2010) Doroshenko, V., Suchy, S., Santangelo, A., Staubert, R., Kreykenbohm, I., Rothschild, R., Pottschmidt, K., & Wilms, J., 2010, A&A, 515, L1
- Fender et al. (2009) Fender, R. P., Russell, D. M., Knigge, C., Soria, R., Hynes, R. I., & Goad, M., 2009, MNRAS, 393, 1608
- Filliatre & Chaty (2004) Filliatre, P., & Chaty, S., 2004, ApJ, 616, 469
- Garmire et al. (2003) Garmire, G. P., Bautz, M. W., Ford, P. G., Nousek, J. A., & Ricker, G. R., 2003, in X-Ray and Gamma-Ray Telescopes and Instruments for Astronomy. Edited by Joachim E. Truemper, Harvey D. Tananbaum. Proceedings of the SPIE, 4851, 28
- Gehrels (1986) Gehrels, N., 1986, ApJ, 303, 336
- González & González (1956) González, G., & González, G., 1956, Boletin de los Observatorios Tonantzintla y Tacubaya, 2, 16
- Grebenev et al. (2004) Grebenev, S. A., Ubertini, P., Chenevez, J., Orr, A., & Sunyaev, R. A., 2004, The Astronomer’s Telegram, 275
- Halpern & Gotthelf (2007) Halpern, J. P., & Gotthelf, E. V., 2007, ApJ, 669, 579
- Herbig (1975) Herbig, G. H., 1975, ApJ, 196, 129
- Illarionov & Sunyaev (1975) Illarionov, A. F., & Sunyaev, R. A., 1975, A&A, 39, 185
- in’t Zand (2005) in’t Zand, J. J. M., 2005, A&A, 441, L1
- Kalberla et al. (2005) Kalberla, P. M. W., Burton, W. B., Hartmann, D., Arnal, E. M., Bajaja, E., Morras, R., & Pöppel, W. G. L., 2005, A&A, 440, 775
- Kaur et al. (2008) Kaur, R., Paul, B., Kumar, B., & Sagar, R., 2008, MNRAS, 386, 2253
- Krivonos et al. (2007) Krivonos, R., Revnivtsev, M., Lutovinov, A., Sazonov, S., Churazov, E., & Sunyaev, R., 2007, A&A, 475, 775
- Moon et al. (2007) Moon, D.-S., Kaplan, D. L., Reach, W. T., Harrison, F. A., Lee, J.-E., & Martin, P. G., 2007, ApJ, 671, L53
- Motch et al. (2007) Motch, C., Lopes de Oliveira, R., Negueruela, I., Haberl, F., & Janot-Pacheco, E., 2007, in Active OB-Stars: Laboratories for Stellare and Circumstellar Physics, ed. A. T. Okazaki, S. P. Owocki, & S. Stefl, Vol. 361, 117
- Motch et al. (1991) Motch, C., Stella, L., Janot-Pacheco, E., & Mouchet, M., 1991, ApJ, 369, 490
- Negueruela & Okazaki (2001) Negueruela, I., & Okazaki, A. T., 2001, A&A, 369, 108
- Negueruela et al. (2000) Negueruela, I., Reig, P., Finger, M. H., & Roche, P., 2000, A&A, 356, 1003
- Okazaki & Negueruela (2001) Okazaki, A. T., & Negueruela, I., 2001, A&A, 377, 161
- Oke & Gunn (1983) Oke, J. B., & Gunn, J. E., 1983, ApJ, 266, 713
- Orosz et al. (2002) Orosz, J. A., et al., 2002, ApJ, 568, 845
- Patel et al. (2007) Patel, S. K., et al., 2007, ApJ, 657, 994
- Pavlov et al. (1995) Pavlov, G. G., Shibanov, Y. A., Zavlin, V. E., & Meyer, R. D., 1995, in The Lives of the Neutron Stars, ed. M. A. Alpar, U. Kiziloglu, & J. van Paradijs, 71
- Porter & Rivinius (2003) Porter, J. M., & Rivinius, T., 2003, PASP, 115, 1153
- Rappaport & van den Heuvel (1982) Rappaport, S., & van den Heuvel, E. P. J., 1982, in Be Stars, ed. M. Jaschek & H.-G. Groth, Vol. 98, 327
- Reig et al. (2004) Reig, P., Negueruela, I., Manousakis, A., Marco, A., & Papamastorakis, G., 2004, The Astronomer’s Telegram, 343
- Reig et al. (2005) Reig, P., Negueruela, I., Papamastorakis, G., Manousakis, A., & Kougentakis, T., 2005, A&A, 440, 637
- Reig, Zezas & Gkouvelis (2010) Reig, P., Zezas, A., & Gkouvelis, L., 2010, arXiv:1006.4935
- Remillard & McClintock (2006) Remillard, R. A., & McClintock, J. E., 2006, ARA&A, 44, 49
- Rodriguez, Tomsick & Chaty (2009) Rodriguez, J., Tomsick, J. A., & Chaty, S., 2009, A&A, 494, 417
- Ryter (1996) Ryter, C. E., 1996, Ap&SS, 236, 285
- Smith et al. (2006) Smith, D. M., Heindl, W. A., Markwardt, C. B., Swank, J. H., Negueruela, I., Harrison, T. E., & Huss, L., 2006, ApJ, 638, 974
- Stella, White & Rosner (1986) Stella, L., White, N. E., & Rosner, R., 1986, ApJ, 308, 669
- Strüder et al. (2001) Strüder, L., et al., 2001, A&A, 365, L18
- Tomsick et al. (2008) Tomsick, J. A., Chaty, S., Rodriguez, J., Walter, R., & Kaaret, P., 2008, ApJ, 685, 1143
- Turner et al. (2001) Turner, M. J. L., et al., 2001, A&A, 365, L27
- Walter et al. (2006) Walter, R., et al., 2006, A&A, 453, 133
- Wilms, Allen & McCray (2000) Wilms, J., Allen, A., & McCray, R., 2000, ApJ, 542, 914
- Wilson et al. (2005) Wilson, C. A., Weisskopf, M. C., Finger, M. H., Coe, M. J., Greiner, J., Reig, P., & Papamastorakis, G., 2005, ApJ, 622, 1024
- Winkler et al. (2003) Winkler, C., et al., 2003, A&A, 411, L1