Fluorine and Sodium in C-rich low-metallicity stars 11affiliation: Based on observations made with ESO Telescopes at Paranal Observatories under programme ID 080.D-0606A 22affiliation: This publication makes use of data products from the Two Micron All Sky Survey, which is a joint project of the University of Massachusetts and the Infrared Processing and Analysis Center, funded by the National Aeronautics and Space Administration and the National Science Foundation
Abstract
We present the N, O, F and Na abundance and 12C/13C isotopic ratio measurements or upper limits for a sample of 10 C-rich, metal-poor giant stars, eight enhanced in s-process (CEMP-s) elements and two poor in n-capture elements (CEMP-no). The abundances are derived from IR, K-band, high-resolution CRIRES@VLT spectra obtained. The metallicity of our sample ranges from [Fe/H]=3.4 to 1.3. F abundance could be measured only in two CEMP-s stars. With [F/Fe]0.64, one is mildly F-overabundant, while the other is F-rich, at [F/Fe]1.44. For the remaining eight objects, including both CEMP-no in our sample, only upper limits on F abundance could be placed. Our measurements and upper limits show that there is a spread in [F/C+N] ratio in CEMP-s stars as predicted by theory. Predictions from nucleosynthetic models for low-mass, low-metallicity Asymptotic Giant Branch stars, account for the derived F abundances, while the upper limits on F content derived for most of the stars are lower than the predicted values. The measured Na content is accounted for by AGB models in the 1.25 to 1.75 M⊙ range, confirming that the stars responsible for the peculiar abundance pattern observed in CEMP-s stars are low-mass, low-metallicity AGB stars, in agreement with the most accepted astrophysical scenario. We conclude that the mechanism of F production in current state-of-the-art low-metallicity low-mass AGB models needs further scrutiny and that F measurements in a larger number of metal-poor stars are needed to better constraint the models.
Subject headings:
stars: abundances — stars:atmospheres — stars: AGB and post-AGB — stars: chemically peculiar1. Introduction
The understanding of the stellar nuclear production sites and evolution scenarios is of great current interest. A large number of high-resolution spectral studies targeting metal-poor objects selected by mining the HK survey (Beers et al., 1992) and the HES (Christlieb et al., 2001) have measured a wide set of chemical elements ranging from Li (e.g. Spite et al., 2005) to the n-capture species (e.g. Sneden et al., 2003), providing constraints on how the stars formed as well as on the nucleosynthetic processes that took place in the early Galaxy.
In contrast, only one single measurement of F in extremely metal-poor (EMP) stars has been published to date (Schuler et al., 2007). The most accessible lines suited for F measurements, the vibration-rotation transition of the HF molecule, are located in the K band, requiring the use of high-resolution, IR spectrographs mounted on 8 m class telescope to target halo stars, a configuration not available until recently.
Fluorine is an element of particular interest, extremely sensitive to the physical conditions within stars. Although the single stable F isotope, 19F, is not involved in the main reactions taking place in the cores of stars, it can be created and destroyed in several different ways, and its dominant source is not yet clear. Theoretical modeling has indicated (at least) three possible sites for F production.
Woosley & Haxton (1988) proposed first that F is produced by neutrino spallation on 20Ne; 20Ne(,)19F. Second, modeling shows that low- metallicity, low-mass (M3-4 M⊙) AGB stars synthesize very large quantities of F (see e.g. Cristallo et al., 2009) via the reactions 14N(n,p)14C(,)18O()15N()19F and 14N(,)18F()18O(p,)15N(,)19F, where the neutrons are provided by 13C()16O and the protons mainly by 14N()14C (see Jorissen et al., 1992). On the other hand, massive AGB stars are expected to destroy F via Hot Bottom Burning (HBB) (see e.g. Smith et al., 2005; Karakas & Lattanzio, 2007). Finally, (Meynet & Arnould, 2000) proposed that Wolf-Rayet stars are a possible source for F, through the 14N()18 F()18O()15N()19F chain. While the physical conditions for F production exist in several phases of stellar evolution, the precise contribution of each of these three sites to the Galactic F evolution is not known,
The measurements of F content in any object have been few and give conflicting evidence about the origin of F in the Universe. Renda et al. (2004) showed that the inclusion of all of sites in Galactic chemical evolution models is necessary to reproduce the F abundances measured in Milky Way field stars. In their model, AGB stars are responsible for significant amounts of F production in the early Universe, because of the metallicity dependence of their yields, while WR stars are significant contributors at solar and super-solar metallicities. Jorissen et al. (1992) derived F abundances in giants that recorded the chemical evolution (K and M giants), in AGB giants that were dredging up freshly minted F from their interiors (MS, S, SC, N and J giants), and in giants that had been polluted by one of the former (Ba giants). They suggested that the overproduction of F in the AGB stars (factors of 3 to 30 with respect to the solar system in the most extreme S and N stars) showed that AGB stars are likely to major contributors to the Galactic F abundance, at least at metallicities close to solar. In addition, the largest F overabundances measured could not be explained with standard AGB models and required additional mixing to achieve the desired amounts. However, recent results by Abia et al. (2009) and Abia et al. (2010) suggest that because of a possible lack of proper accounting for C-bearing molecules (i.e. CH, CN, CO and C2) contribution, the F abundances reported in Jorissen et al. (1992) for solar metallicity giants, which relied on the same HF line used in the present analysis, had been overestimated. Therefore, the long standing problem of the discrepancy between the high [F/Fe]111 Hereafter:(A) = log N(A)+12. [X/Y] = log(X/X⊙) log(Y/Y⊙). and [F/O] ratios measured in solar metallicity giants and the low ones resulting from the models, is likely solved by the adoption of a more complete molecular line list for the synthetic spectra. In fact, the Cristallo et al. (2009) models account fully for the F abundances measured in several C-stars ranging from solar metallicity to slightly metal-poor ([Fe/H]0.0 to -0.5) (Abia et al., 2009, 2010).
While the above results make it clear that solar metallicity AGB stars make at least some F, there is not yet a consensus on the overall contribution of AGB stars throughout the chemical evolution of stellar systems. Cunha et al. (2003) measured F in red giants in the LMC and Cen. They found that F/O declines as the O abundance decreases and the two Cen giants have particularly low F/O values. They argue that their results are qualitatively consistent with most F production coming from either neutrino nucleosynthesis or WR stars rather than AGB stars in these systems, which certainly have a different chemical evolution than the Milky Way. In particular, the low F abundances in metal-poor ([Fe/H]) Cen stars that are enriched in s-process elements is difficult to reconcile with the idea that metal-poor AGB stars are major contributors to F production. F has also been measured in stars in the Galactic bulge (Cunha et al., 2008). The F/O results there can be explained by contributions by both AGB and WR stars, although the lack of an s-process enhancement in the most F-rich bulge stars suggests that AGB stars may play a less prominent role in the bulge than has been inferred for the disk.
Measurements of fluorine in the interstellar medium (Federman et al., 2005) show no evidence of F over-abundances due to the neutrino process in SNII. The F production in rotating WR stars has been reconsidered by Palacios et al. (2005), who found that F yields are significantly lower than the Meynet & Arnould (2000) predictions, indicating that their contribution to the Galactic F budget would be negligible. These results suggest that at low-metallicity AGB stars play a major role in F production, although this idea would leave the Cen results unexplained. The idea of AGB stars as producers of F is supported by the large F enhancements found in post-AGB stars (Werner et al., 2005) and planetary nebulae (see e.g. Otsuka et al., 2008, and references therein), the progeny of AGB stars as well as the results for abundances in Milky Way AGB stars cited above. However, these observations are focused on [Fe/H]0 metallicity stars and do not address directly the question of the production of F production in metal-poor AGB stars.
While Na measurements have been obtained for a much larger number of metal-poor stars, no quantitative study has been performed so far on the role of AGB stars in its production, in particular at low metallicity. In thermally pulsing AGB stars, Na is mostly synthesized by proton captures on 22Ne. Models indicate that the main source of Na in low-mass AGB stars, at least at solar metallicity, is the creation of a Na pocket, located at the top (or near the top) of the 14N pocket. At lower metallicities, other mechanisms, such as the neutron capture on 22Ne, which can occur both during the radiative 13C burning and during the convective 22Ne burning, may become important (Cristallo et al 2006b and references therein). In general, according to e.g., Cristallo et al. and Bisterzo et al. (2010), the production of Na increase by about 1 dex or more going from solar to [Fe/H] -2.3, a similar metallicity to that of the stars in our sample. This is due to a higher efficiency of all the Na nucleosynthesis channels described above. The testing of such predictions is important to constraint details of the key reactions involved.
Carbon-enhanced metal-poor (CEMP) stars provide an opportunity to directly measure the F and Na production in low-mass, metal-poor AGB stars. These stars are chemically peculiar objects, characterized by an overabundance of C ([C/Fe]1222 Some authors use different cutoffs values depending on the evolutionary state of the star, with cutoff enhancement for giants as low as [C/Fe]0.5 (see Aoki et al., 2007)) accounting for 10-20% of stars below [Fe/H]2.5 (Marsteller et al., 2005; Cohen et al., 2005; Lucatello et al., 2006). Less than a third of CEMP stars exhibit no enhancement in heavy elements (CEMP-no), while most of these objects (over 70% Aoki et al., 2007) are characterized, by an overabundance of n-capture, s-process, elements (CEMP-s).
Lucatello et al. (2005) showed that likely all C-rich, extremely metal-poor stars with s-process enhancement (the CEMP-s stars) belong to a binary system. CEMP-s are then the metal-poor analog to the classical CH and Ba stars: low-mass stars (M0.8 M⊙) whose slightly more massive (between 1.2 and 2.5 M⊙, the exact range depending on metallicity) companion, now a faint white dwarf, dumped material processed during its AGB phase on their surfaces, leaving its chemical fingerprints in the composition of their envelopes. Therefore, the nucleosynthetic processes taking place in extremely metal-poor, low-mass (1.5 M⊙) stars, now long extinct, can be investigated through the study of CEMP-s stars characteristics 333Because of its high Eu abundance, not fully accountable with standard s-process nucleosynthesis, one of the stars in our sample, HD187861, has been included in the CEMP-rs category. However, since all the likely formation scenarios invoked to explain the abundance patterns of these objects include mass transfer from an AGB companion (see e.g. Jonsell et al., 2006; Lucatello et al., 2009), as far as the present discussion is concerned HD187861 can be considered as an CEMP-s.
The origin of CEMP-no objects is, on the other hand, still a mystery. Fujimoto et al. (2000) suggested that they may have formed as chemically “normal” low-mass stars and became C-enhanced through a path of self-enrichment due to anomalous mixing processes specific to low-metallicity stars. Alternatively, as Ryan et al. (2005) suggested, they could have been born from C-rich gas, possibly polluted by a previous generation of supernovae whose fall-back avoids the ejection of heavier elements during the explosion (e.g.,from high-mass, rapidly rotating stars see Meynet et al., 2006, and references therein). Objects like the recently discovered extremely-metal poor, C-rich Damped Lyman- system (Cooke et al., 2010) might turn out to be the connection between the yields of the Pop III stars and their later incorporation into CEMP-no stars.
On the other hand, their abundance patterns could arise from early AGB transfers from low-mass stars before any considerable s-process element production took place (Ryan et al., 2005; Masseron et al., 2010a), or alternatively from an AGB stars whose evolution was truncated by binary interaction (see, e.g., Izzard & Tout 2003) with its companion, the presently observed object.
The measurement of a value or a strong upper limit on F abundance is of crucial importance to probe the origin of the chemical pattern observed in CEMP-no stars given that F can be synthesized before the bulk of the s-process-element production. In Cristallo et al. (2009), for instance, as early as the third-dredge-up episode for a 2 M⊙ at [Fe/H]=2.3, [F/C]=-0.4 and [F/Fe]=1.65, [Ba/C]=-1.5 and [Ba/Fe]=0.5 (and [C/Fe]=2.05). Therefore, a measurement in CEMP-no stars of an amount of F comparable to C would strongly argue in favor of AGB enrichment.
Schuler et al. (2007) measured the F abundance in a extremely metal-poor star for the first time, deriving an abundance of (F)= corresponding to an abundance ratio [F/Fe] = 2.9 for the CEMP-s star HE 1305+0132. Lugaro et al. (2008) compared this value to existing nucleosynthesis and mass transfer models. Conclusion that an object with such an extreme F content should be exceedingly rare, while most CEMP-s stars are expected to exhibit a noticeable but smaller F overabundance.
We here present F abundance measurements for two CEMP-s and upper limits for eight more CEMP stars (six CEMP-s and two CEMP-no) and discuss the implications of our result on our current understanding of AGB nucleosynthesis.
2. Observations
Data were collected using CRIRES444www.eso.org/instruments/crires/ (CRyogenic high-resolution InfraRed Echelle Spectrograph, Kaeufl et al. 2004) at VLT UT1 (Antu) in a series of service runs between October 21th 2007 and February 28th 2008. The slit-width was set to 04 yielding a resolution of , where refers to the width of the resolution elements, with a binning of 11. We used the 24/-i/i setup, which leads a wavelength coverage from 2299.3 to 2311.8 nm, 2315.2 to 2327.3 nm, 2330.4 to 2342.0 nm, and 2345.0 to 2356.0 nm for chips 1 to 4 respectively. Our sample also included a well-studied C-normal metal-poor star (HD 122563) to be used as a comparison star. The typical signal-to-noise ratio for the program stars at 2335 nm is about 120 per pixel. An early-type, fast-rotating star was observed right before or right after each one of the program star observations. To improve the accuracy of the telluric line subtraction procedure, those objects were chosen so that the science and calibration stars were observed at similar air-masses. The typical signal-to-noise ratio for the telluric standard stars at 2335 nm is about 250 per pixel.
The raw frames were processed with the CRIRES GASGANO pipeline (version 1.6.0). The 1D science and standard star spectra were wavelength-calibrated separately using the numerous telluric absorption lines present on all of the four detector arrays. Such process was performed separately for the science and telluric standard star spectrum because of the limited reproducibility of the Echelle grating position. The science spectra were then divided by the appropriate standard star spectra to correct for the telluric lines and the illumination pattern in the best possible way. It is worth noting that while the telluric lines are strong enough to be used for wavelength calibration, they are weak enough to be accounted for by standard star division; hence their effect on the abundance measurements presented in this paper is negligible.
More details about the observations can be found in Table 1.
3. Atmospheric parameters and atmospheric models
The determination of the adopted atmospheric parameters can be obtained photometrically, via the derivation of the effective temperature Teff from accurate Teff-color relations and that of surface gravity, from a suitable isochrone. Alternatively, Teff and can be derived spectroscopically, through the requirement of, respectively, of excitation and ionization equilibrium. In both cases, the micro turbulent velocity is determined from minimizing the trend of derived abundance and equivalent widths of the Fe lines.
The spectral range covered by the program spectra do not include any Fe lines and in general not enough features to allow the derivation of the atmospheric parameters. Therefore, we have relied on the atmospheric parameters published in the recent literature or derived on the basis of photometry and our own proprietary optical spectra (for details see Masseron et al. 2010a). The adopted atmospheric parameters and C and Ba abundances (which cannot be derived from our spectra as no suitable features are present in the band), along with their uncertainties and sources are listed in Table 1. Note that in some cases the uncertainties are not listed as the source paper did not report them.
The chemical composition of the stellar atmosphere can affect its structure: the higher the content of metals the larger the number of free electrons, available for the formation of the H- ion, the main source of continuum opacity among stars with spectral types later than A. Solar-scaled model atmospheres, which are generally (appropriately) adopted for the analysis of stars, likely provide different temperature profiles from those that are expected to be found in CEMP stars, due to their large C and N enhancements. In our abundance analysis, we adopt C and N enhanced model atmospheres belonging to the OSMARCS family (Gustafsson et al., 2008) calculated using the appropriate atmospheric parameters and C and N enhancements for each star. Such models have a steeper temperature profile than their solar-scaled counterparts, affecting especially the computation of the strong lines, which form in the outer layers. The discussion of the calculation of the C and N-enhanced models, their features and their impact on the abundance determinations is beyond the aim of the present paper. For more details the reader is referred to Masseron et al. (2010b).
4. Abundance analysis and comparison with the literature.
Elemental abundances for N, O, F, Na and C isotopic ratios were obtained by synthetic spectra fits to the 1D extracted spectra for the sample stars. We used the TURBOSPEC synthesis code (Alvarez & Plez, 1998), which shares routines and input data with OSMARCS. The code is characterized by chemical equilibrium including 92 atomic and over 500 molecular species, and Van der Waals collisional broadening by H, He, and H2 following Barklem & Aspelund-Johansson (2005). Smoothing for the spectra was determining by simultaneous fitting of a number of weak unblended CO lines.
A partial analysis of this dataset has been presented in Lucatello et al. (2009). The present paper presents a reanalysis of the data, providing measurements for a wider set of elements. It is based on improved reduction of the spectra (using a different pipeline version) and makes use of more accurate atmospheric parameters determinations. Hence the present results supersede those presented in Lucatello et al. (2009).
O was measured from the fit of several 12C16O lines belonging to the = 2-0 and 3-1 overtone bands, as well as the = 4-2 and 13CO = 2-0 band-head regions. Given the high C content of the stars under consideration, the CO lines are very sensitive to O content, hence allowing for a very accurate O abundance measurement. 12C/13C isotopic ratios were measured from the simultaneous fitting of several 12C16O and 13C16O lines. O abundance was then re-measured with the appropriate C isotopic ratio and the procedure was repeated to convergence. N abundance measurements are obtained from a number of CN lines scattered throughout our spectral range.
Three Na lines are included within the available spectral region: 2334.842 nm, 2337.895 nm and 2337.914 nm. The latter is the strongest and, unlike the other two, is not severely blended with CO features, making it the best candidate for Na abundance measurements. It falls in a range of strong telluric contamination, therefore, in spite of careful and accurate modeling and subtraction of telluric features, in four out of eleven (10 CEMP and one EMP) stars only upper limits (1) to the Na abundances could be placed.
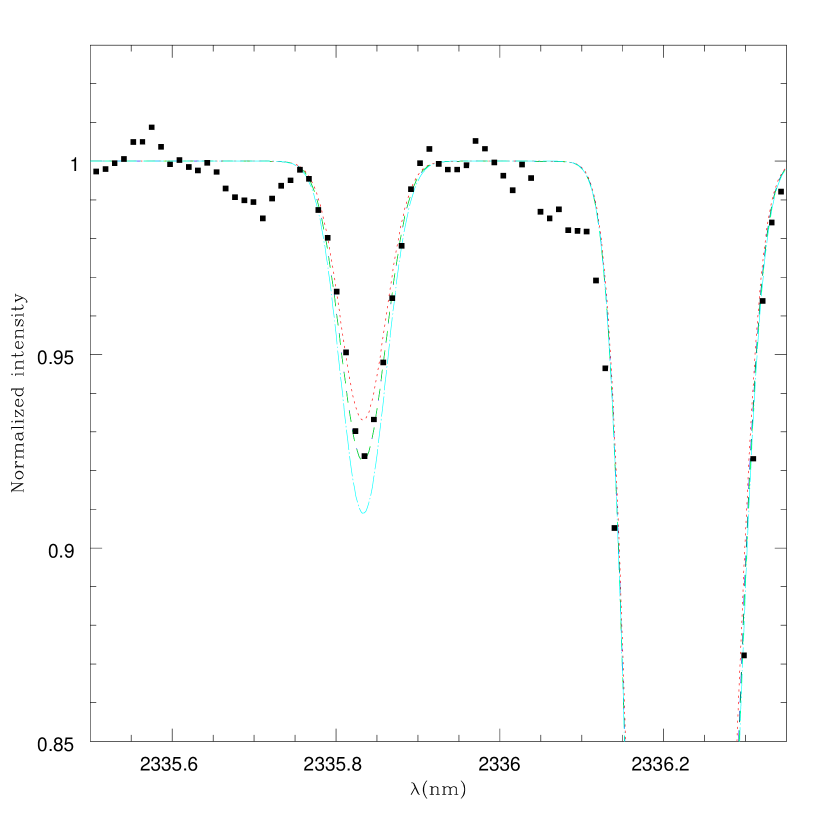
Finally, F abundances (and 1 upper limits) were measured from the fitting of the unblended HF line at 2335.833 nm. Two more HF lines are present in our spectral range, 2324.062 and 2348.805 nm; however both of them are blended with CO features, hampering the accuracy of F abundance determinations obtained from their fitting. Figure 1 shows the fit of synthetic spectra to the HF feature at 2335.833 nm.
The line list adopted are from Goorvitch (1994) for CO, Kurucz (1995) for CN and Na, and Decin (2000) for HF. They were checked for consistency by fitting the Arcturus spectrum and that for our comparison star HD 122563.
In a few cases (CS 29502-92, CS 30314-67 and HD 122563) no O abundance in conjunction with the literature C abundance could yield satisfactory fits of the CO features. Hence we sligthly adjusted the C abundance to improve the fit of such features. This discrepancy could be due to the adoption of different model atmospheres in the present analysis and in the literature studies in which the adopted C-abundances are reported. In particular the inclusion of the appropriate opacities for the C and N enhanced atmospheres can result into the derivation of slightly different abundances from those obtained with solar-scaled models, which are generally adopted in the literature.
The uncertainties in our measurements come from two sources (excluding systematic NLTE and 3D atmosphere effects, and atomic and molecular parameters uncertainties): error in the fitting of the spectral features, and due to the atmospheric parameters.
In the case of the fitting uncertainty, we estimate this component of the error by how well fitted we can match the synthesis to the actual spectrum (we adopt 0.1 dex) To estimate the errors due to the uncertainty in the atmospheric parameters for each element, we determined individually the sensitivities of the derived abundances to the adopted Teff, surface gravity , C enhancement, and [Fe/H], and then summing in quadrature the resulting uncertainties associated with each parameter555Strictly speaking this is only appropriate in case of independent errors, and in general one needs to take into account the covariances. Given that the atmospheric parameters for most of the objects in our sample are taken from literature sources, the determination of the covariance terms is essentially impossible. On the basis of the data for the three stars for which atmospheric parameters were derived from our proprietary high-resolution spectra, we obtained estimate the variations in and [Fe/H] for an increase of 200 K in Teff, finding an average of 0.5 dex and 0.15 dex respectively. Hence, Teff is clearly the dominant source of uncertainty (see Table 3), and the covariance terms can be neglected.. Note that for the stars for which no estimates for the atmospheric parameter uncertainties were provided in the source paper, we adopted 100 K for Teff, 0.3 in , 0.15 in [Fe/H] and 0.2 in [C/Fe]. The sensitivities to the adopted atmospheric parameters are provided in Table 3 for HE 1152-0355 and HD 5223, which beside being the only two stars for which F is measured, are representative of the present sample for atmospheric parameters. The estimates of the errors reported are for abundances (e.g. (F) or [F/H]), however the abundance ratios between two species (e.g. [F/Fe]) have typically smaller errors since the effects due to uncertainties on the atmospheric parameters partially cancel out. As above mentioned, we cannot obtain the information about Fe sensitivity to atmospheric parameters in our sample stars, therefore we cannot actually calculate the errors on the abundance ratios. In the following plots and discussion we adopt for the ratios of F, C, N, O and Na to Fe the same errors, keeping in mind that they are overestimates of the actual ones.
The resulting N, O, F and Na abundances, along with the observational errors, are listed in Table 4.
The HF lines in the spectrum of the comparison, C-normal star HD 122563 were undetectable as expected, thus only an upper limit could be placed to the F abundance. This upper limit is consistent with the galactic chemical evolution model for such element, which predicts a value of [F/O]0.6 dex at (O)=7.0 (the minimum metallicity taken into account, see Renda et al., 2004), while we find [F/O]0.1 dex at (O)=6.8.
For the program stars, as shown in Table 3, F measurements could be derived only for two out of ten program stars; with metallicities of [Fe/H]=1.2 and 2.0 they are the object with the highest Fe content of the sample. For the other eight, more metal-poor objects, only upper limits could be placed. Because of the high sensitivity of the HF molecule to temperature, as shown in Fig. 2, the level of upper limits on the F abundance is essentially set by the Teff in the atmosphere of the observed stars.
As F has been measured only in one (not part of our sample) extremely metal-poor star before (see Schuler et al., 2007), our results for F abundances cannot be compared to literature ones. However measurements for N, O and Na have been previously reported for a subset of our sample. Fig. 3 shows the excellent agreement with literature results for these species, which are all measured from transitions in the visible spectra.
5. Discussion
With measurements or upper limits for eight stars, we find a range in [F/Fe] and [F/C+N] ratios in CEMP stars (see e.g. Fig. 2), with CEMP-s [F/Fe] values ranging from 1.44 dex to less than 0.6 dex. This confirms both that AGB stars are characterized by range of efficiency in its production (likely due to different metallicity and and mass), as predicted by theoretical low-mass, low-metallicity nucleosynthetic AGB stars models. The two stars with measured F, HD 5223 and HE 1152-0355, are both CEMP-s stars, and the presence of both F and s-process elements in their atmospheres is consistent with a picture where they were polluted by a low-mass AGB star.
There is no object in our sample with a F content as high (or close) to that presented in Schuler et al. (2007) for HE 13050132. In fact, even the highest value for an upper limit in the present sample, [F/Fe]2.5 is almost a factor of three lower than those measured in HE 13050132. Possible sources of systematic offsets include difference in the model atmospheres (we use spherical C-enhanced models, whereas Schuler et al. adopt C-enhanced, plane parallel models) and in the molecular transition data.
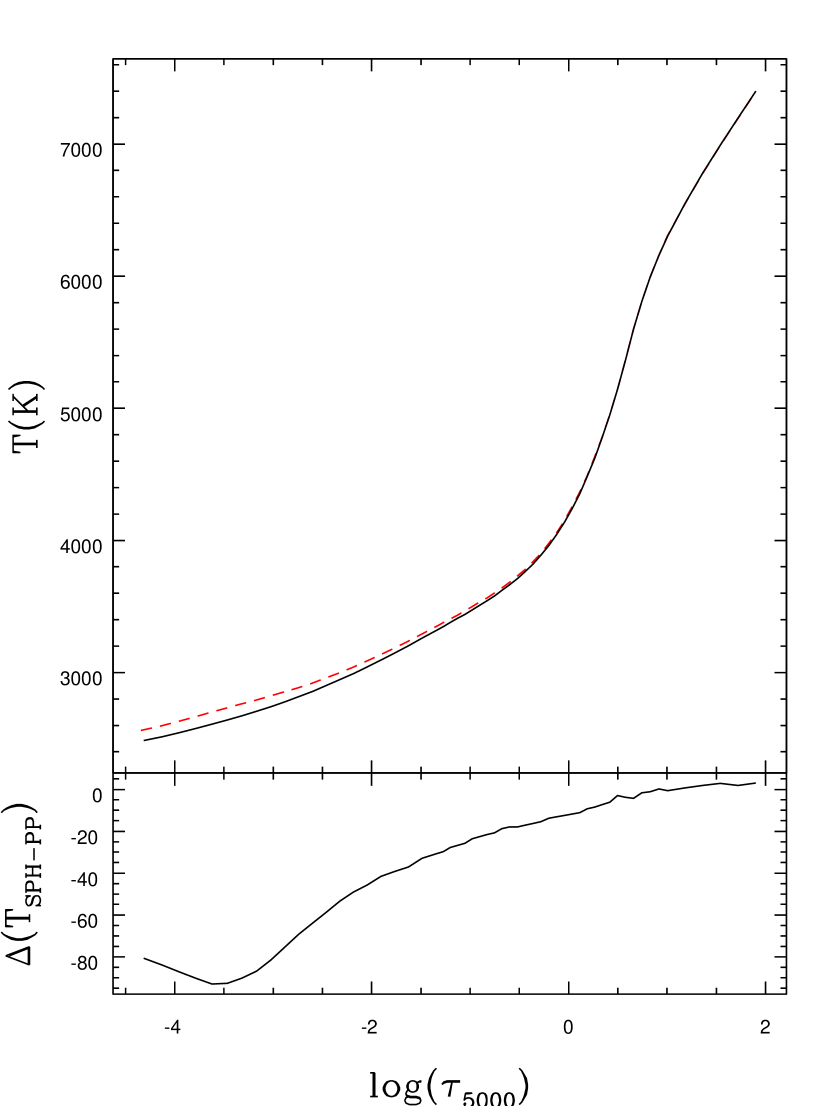
In our analysis we used spherical C-enhanced models. These are cooler at the surface than the C-enhanced plane parallel models adopted by Schuler et al, as can be seen in Figure 4, which shows the difference of the thermal structure of the two models for one of our star in our sample (HE1152-0355). The discrepancy in T reaches 100K. Abundances derived from lines originating in the outer layers of the stellar atmosphere are thus lower in the spherical model case than in the plane parallel one. However, such affect is expected to affect strong lines (in our case mostly CO lines), while its effect on weak lines such as HF is expected to be very small.
As discussed in Section 3, for the HF molecular transitions we use the data in Decin (2000), while Schuler et al. use those in Jorissen et al. (1992). While the ‘s for the HF(1-0) R9 line (the only present in the Schuler et al. spectral range) and dissociation potential adopted are virtually identical, the excitation potential for the transition in Decin (2000) is 0.227 eV, well below the 0.48 adopted by Schuler et al. Such difference leads to an offset in the F abundances measured from the HF(1-0) R9 line. To asses such difference, we derived the F abundances adopting the same molecular transition parameters as Schuler et al., and found that the values obtained are at most 0.3 dex larger using the Jorissen et al. (1992) excitation potential than with the Decin (2000) one. Hence, even taking into account the offset due to the difference in adopted excitation potential, the F abundance and [F/Fe] ratio measured in HE 1305+0132 are higher than any of the measurements or upper limits derived in our sample.
It is noteworthy that the Fe abundance in HE 1305+0132 adopted in Schuler et al. (2007) was quite uncertain. In fact, given the limited spectral coverage in the Phoenix data and the lack of Fe features in that range, the authors relied on [Fe/H] measured from intermediate resolution spectra analysis (Beers et al., 2007), which reported an [Fe/H]=2.50.5 dex. More recent, high-resolution optical data suggest that HE 1305+0132 is in fact more metal rich, with [Fe/H]1.92 dex (Schuler et al., 2008). When taking into account this Fe abundance the [F/Fe] ratio lowers by 0.6 dex, to a similar level to those measured in our sample. Moreover, the F abundance itself, (F) can also be affected as the adoption of an appropriate, more metal-rich model atmosphere, whose outer layers are cooler than those of the metal-poor model atmosphere adopted previously, is expected to result in a lower F abundance.
Although the present sample shows that there is a range in [F/Fe] abundances in CEMP stars, it is not yet clear what the maximum F production is, and larger number of F abundance measurements in CEMP (and EMP) stars is crucial to probe the matter.
5.1. Theoretical AGB predictions for F production
Since Jorissen et al. (1992), considerable effort has been expended to model its production and explore the effect of uncertainties in the adopted parameters. The main issue to address was that the nucleosynthetic AGB models failed to account for the high [F/Fe] and [F/O] rations observed in Jorissen et al. (1992) in metal-rich intrinsic and extrinsic C-stars. While the recent results of Abia et al. (2009) and Abia et al. (2010) seem to have reconciled observations and model predictions at solar and slightly subsolar metallicity, large uncertainties in the 19F production in AGB stars, especially in the low-metallicity regime, still exist.
Jorissen et al. (1992) proposed as a main mechanism to produce F in AGB stars the nucleosynthesis chain 14N(,)18F()18O(p,)15N(,)19F during the thermal-pulse (TP) in the He intershell. In this case, protons for the 18O(p,)15N reaction are provided by 14N(n,p)14C, and neutrons are provided by 13C(,n)16O, where 13C is present in the H-burning shell ashes at the TP activation. Goriely & Mowlavi (2000) proposed that additional F could be made during the interpulse phase, where the reaction 14N(n,p)14C()18O(p,)15N occurs, the neutrons being provided by the 13C pocket and the protons recycled from the 14N(n,p)14C. The production of 19F is then completed in the next pulse by -capture on 15N. Lugaro et al. (2004) described the consequence of the reaction rates uncertainties and of the inclusion on a 13C pocket on the 19F yield, showing that their combined effect can affect it by as much as 40% in low-mass stars (M M⊙). Karakas et al. (2008) instead focused on the uncertainties on 19F production stemming from the 18F(, p)21Ne reaction, whose rate was determined experimentally only in 2006 (see Lee et al., 2006). Such a reaction was neglected in the previous work (Lugaro et al., 2004). The effect of the reaction uncertainties on F production is found to increase with decreasing metallicity, reaching a factor of two for a 2 M⊙ star at [Fe/H]2.3 dex. Another important source of uncertainty is mass loss. Stancliffe & Jeffery (2007) explored the effects of different prescriptions for mass loss at the beginning of the thermally pulsing-asymptotic AGB phase on F production, showing that it could change it by as much as a factor of 5 (see also Stancliffe & Glebbeek, 2008). In particular, Stancliffe (2009), without any 13C pocket, using a given mass loss prescription, a different third dredge-up efficiency from the Lugaro et al. (2004) and Karakas et al. (2008) models, at M=2 M⊙ and [Fe/H]=2.3 predicts an F abundance which is 10 times lower than than the Lugaro et al. (2004).
All these three family of models mentioned, however, do not take into account the effects induced by carbon enhancement on the opacities of the cool external layers of AGB stars. When the star becomes C-rich and the number or C ions exceed that of O ions, the opacity of the external layers is affected (increased) by the massive presence of C-bearing molecules (mostly CH, C2, CN and CO). This is expected to causing the envelope to expand and the star to become larger and cooler (see Marigo, 2002). Cristallo et al. (2009) (see also http://www.ugr.es/ cristallo/data_online.html) calculated models of low metallicity, low-mass AGB stars including the effects of C- and N-enhancements on stellar opacities. This has the effect of decreasing the 19F production, by roughly a factor of 5 with respect to the standard models (i.e. obtained using the recommended reaction rates) from Karakas et al. (2008); it is noteworthy that using a solar-scaled composition Cristallo finds the same results as the standard Karakas model. It should be noted that while the in the Lugaro et al. (2004), Karakas et al. (2008) and Cristallo et al. (2009) models 19F production peaks at around 2.2 M⊙, in the Stancliffe (2009) it is reached at 1.5 M⊙.
5.2. Comparison with models: C, N, O and C isotopic ratios
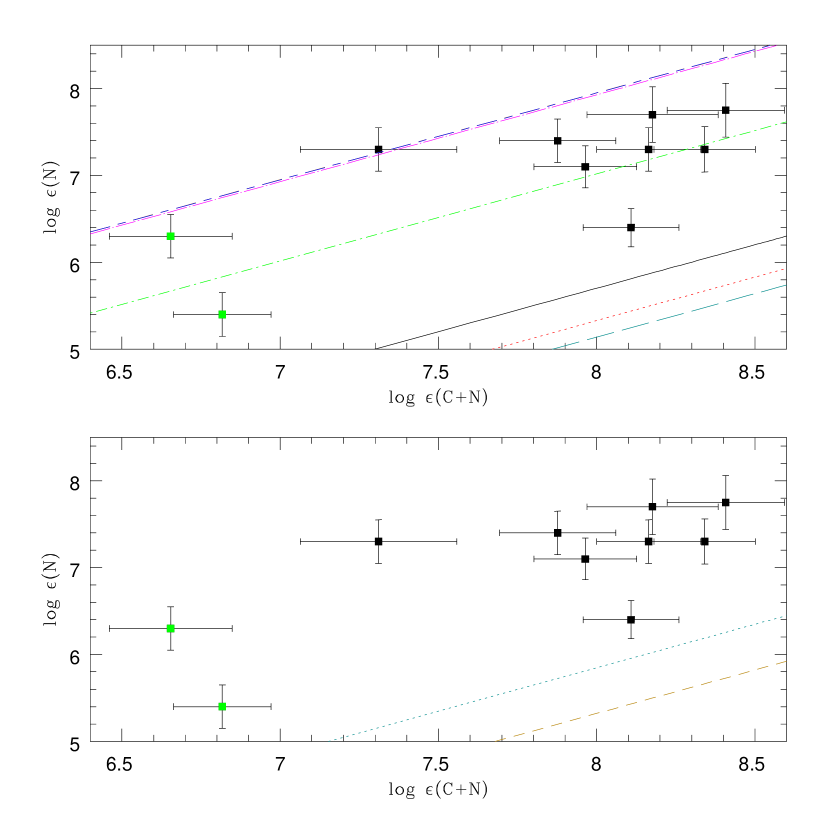
In this section, the results from the previously discussed four different families of models (which provide predictions of mass production of various elements among which C, N, O, Na and F) are compared to the data. Under the assumption that the CEMP-s stars observed have been polluted by mass transfer from an AGB companion and that the amount of C, N, Na, and F in the original (pre mass-transfer) atmospheres are negligible with respect to that accreted, the [N/C+N]666Note that the values of C, N, Na, C isotopic ratios in the following discussion are those listed in Table 2 and 4, [F/C+N] and [Na/C+N] ratios observed in CEMP stars should reflect that produced by the AGB star companions, independently from the amount of dilution (ratio between the mass accreted and that of the envelope of the observed star) undergone by the accreted material. Figures 5 and 6 show the behaviour of N and 12C/13C in the sample stars. CEMP-s stars are plotted in black and CEMP-no stars in green. Given the lack of understanding of the nucleosynthetic process to which the latter owe their peculiar composition, the inclusion in the subsequent plots of the two CEMP-no in the comparison to the AGB models is, strictly speaking, not appropriate. However, since one of the possible scenario is indeed analogous to that invoked for CEMP-s stars, we include them in the plots for completeness (using a different color for easy differentiation). In Fig. 5, for each individual model different degrees of dilution correspond to different positions along its correspondent line.
The choice of the sum of the two species C+N rather than a single one at a time is because it is a much more solid prediction in stellar evolution models. It is well known that the standard AGB models fail to reproduce the N abundances observed in C-rich stars (see e.g. Jorissen et al., 1992). We find similar results in our sample. The common explanation of such apparent disagreement is that extramixing processes take place at the bottom of the AGB envelope, where part of the envelope material undergoes the CN cycle, turning carbon into nitrogen (see the discussion at the end of this section).
As can be noticed from Fig. 5 the low mass models predict a N abundance which is lower than the measured ones, which are closer to the predictions of more massive AGB stars (2.5-4 M⊙) models, where HBB takes place.
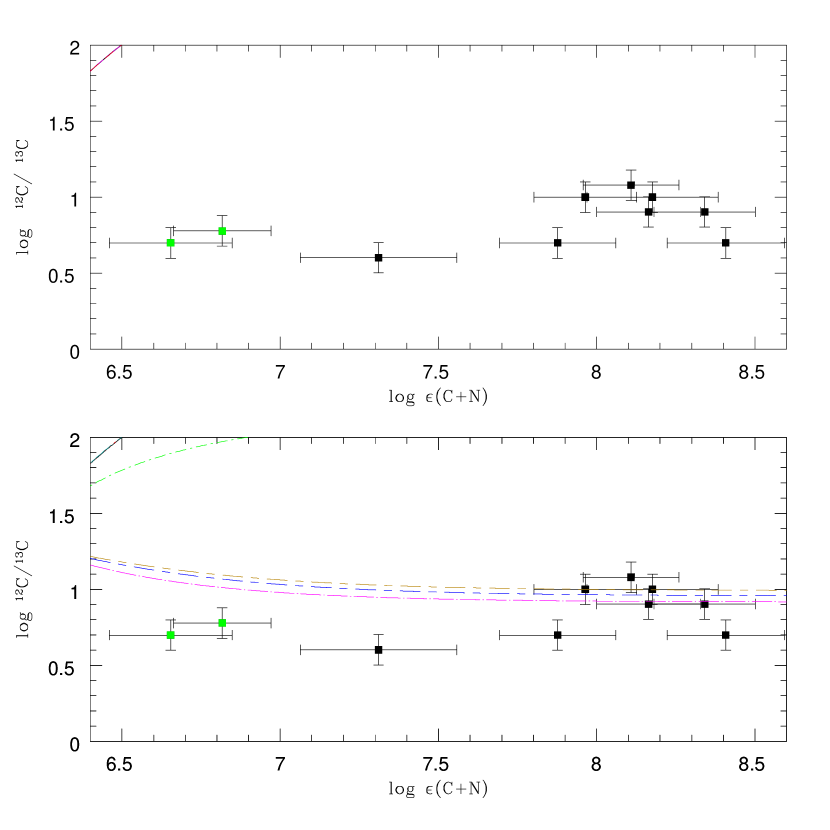
A similar conclusion can be drawn from Fig. 6, which plots 12C/13C with respect to C+N. It is worth noting that, unlike the previous case with N and those of F and Na that will be discussed later, the initial composition of the star (before mass transfer) is not negligible when plotting the model prediction. In fact, while essentially all C (as 12C) comes from mass transfer, according to the low-mass AGB models (which do not include extramixing processes) the 12C/13C ratios are very high, thus according to these models, very little 13C is transferred with respect to 12C (the predicted isotopic ratio can be as high as 104, hence 104 12C nuclei are transferred for a single 13C nucleus). The amount of 13C in the atmosphere of the CEMP star before it becomes CEMP counts for small amounts of mass transfer. Fig. 6 shows the predictions for the same models shown in Fig. 5 under the assumption that the original (pre mass-transfer) C abundance and C isotopic ratios in the observed stars were [C/Fe]=-0.4 and 20, which is a typical value measured for metal-poor giants (see e.g. Gratton et al. (2000)). The models in the plot take into account different degrees of dilution, corresponding to different positions along the lines. The C isotopic ratios measured in our sample are all quite low, some almost at the equilibrium value, much lower than predicted by low-mass shell-nucleosynthesis models (10,000 see e.g. Cristallo et al., 2009), while the ratios for more massive stars (2.5 M⊙) are closer to the measured ones. However, a star polluted by a star with a mass 2.5 M⊙, where HBB operates should be characterized by [N/C]0, which is only found in two of the stars in our sample, making this possibility quite unlikely (see also the discussion in the next section).
During their evolution, the stars in our sample undergo several mixing episodes (i.e. first dredge-up, extramixing corresponding to the RGB bump) from the main sequence to the evolutionary state we observe them in today. This mixing episodes are known to affect the C isotopic ratio in C normal stars. It is reasonable to assume that they also might affect the accreted C, altering the C isotopic ratio of the accreted material.
This effect is however likely not important.
In fact, similar values for C isotopic ratios are found in unevolved
CEMP-s stars (see e.g. Lucatello et al. 2003; Masseron et al. 2010a; Aoki et al. 2002), which have not undergone any of such mixing episodes and have thus maintained the original 12C/13C in transferred material.
Moreover, the extent of the effect of the mixing episodes on the accreted C isotopic ratio should likely depend on the time in its evolution when the C-rich material is transferred. Since it is sensible to assume that the CEMP-s stars in
our sample underwent mass transfer at different times in their evolution, the fact that all the measured isotopic ratios are all quite low, argues that the effect of the mixing episodes on such quantity should be marginal.
Therefore, it is reasonable to conclude that the measured C isotopic ratios indeed
reflect that in the polluting material.
To account for such a high N abundance and low C isotopic ratios in low-mass AGB stars, we confirm that some degree of of extra-mixing with a partial activation of proton capture nucleosynthesis, the so-called Cool Bottom Processing (CBP), needs to be invoked (Nollett et al., 2003). However, in most published works, such process is treated as a parameter and thus the amount of CN processing is highly uncertain, making the individual C and N abundance predictions much more sensitive to modeling details than their sum. This process is known to occur during the first red giant phase in stars with M2.5 M⊙ (Charbonnel, 1995) and was suggested to occur between dredge up in AGB stars (Nollett et al., 2003). It consists of circulation of material from the base of the convective envelope into the thin radiative region located on top of the H-burning shell, where the material is processed by proton captures and then brought back to the envelope, producing the signature of CN processing at the stellar surface. The low 12C/13C ratios, high N (but with [C/N]0) observed in CEMP-s stars indicates that CBP also takes place in low metallicity AGB stars (see also Aoki et al., 2002; Masseron et al., 2010a). Unfortunately, the physical mechanism responsible for such process is still not clear. Several scenarios have been proposed, e.g., the mixing process could be driven by a molecular weight inversion created by the 3He(3He,2p)4He reaction (Eggleton et al., 2008), or by magnetic buoyancy at the bottom of the envelope (e.g., Palmerini, Nollett, & Busso 2008).
While we obtained measurements for O for all the stars in our sample, a comparison with the model predictions would not be meaningful. All the models discussed in the text start with solar-scaled composition. While this is not important for the other elements we discuss as their production in the AGB nucleosynthesis is much larger than the initial content, this is not true for O, which is in fact typically produced at the [O/Fe]0.5 level, a value comparable to that measured in metal-poor stars, making the adoption of a correct initial O for the models important. The typical predicted values for O are in fact lower than the measured ones; however it is presently not possible to determine whether this is due to the incorrect assumption on the model star initial composition or issues in the understanding of O nucleosynthesis in low-metallicity AGB stars (see for instance the impact of overshooting on O abundance, e.g., Herwig 2005 ARA&A).
5.3. Comparison with observations: F
F was measured only in two CEMP stars in our sample, both s-process rich, while for the remaining eight objects (including the two CEMP-no stars) only upper limits could be placed. Therefore, as far as 19F is concerned, no meaningful comparison is possible between CEMP-s and CEMP-no stars, and not much information on the formation scenario of CEMP-no stars can be derived from the present data.
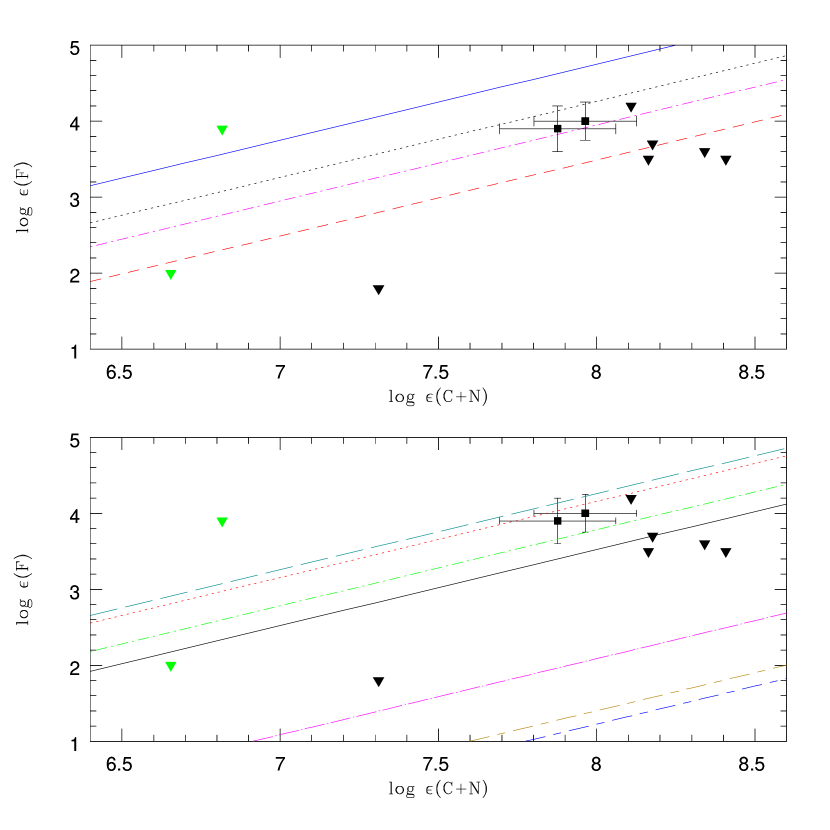
Fig. 7 shows the derived F abundances with respect to the sum of the C and N abundances in the sample stars.
Results from four different families of models are plotted for comparison to the data; they provide yields for of various elements among which are C, N, Na, and F. In Fig. 7, for each individual model different degrees of dilution correspond to different positions along its correspondent line.
In the upper panel the model plotted are all computed for a mass of 2M⊙ and a metallicity of [Fe/H]=2.3. The dotted line indicates the prediction from Karakas & Lattanzio (2007), the one used in Lugaro et al. (2008) to account for the F content reported in Schuler et al. (2008). The solid line describes the model from Karakas et al. (2008), which includes a 13C pocket of 0.002M⊙ at the top layer of the He- and C-rich inter-shell region and adopts the upper limit for the rate of the 18F(, p)21Ne reaction (in an attemp to reproduce the high F abundances in the Jorissen sample). Among the models available in the literature, this is the one that for the mass and metallicity under consideration, produces the largest amount of F with respect to C and N. The dot-dashed line indicates the prediction of the model from Cristallo et al. (2009)., which accounts for the appropriate C-bearing molecules opacities in the stellar evolution model, unlike the two other models, which adopt solar scaled composition. Finally, the dotted line shows the prediction from the Stancliffe (2009) model, which uses solar-scaled opacities.
As shown in the upper panel of Fig. 7, the two F measurements can be accounted for by the Karakas & Lattanzio (2007) or the Cristallo et al. (2009) 2 M⊙ star models. On the other hand, the F predicted from the Karakas et al. (2008) 2 M⊙ star is higher. All the upper limits excepting one derived for F in our sample fall lower than the two measured abundances. Two of the upper limits are in agreement with the predictions of Stancliffe & Glebbeek (2008) in the figure. We note that a significant fraction of the upper limits are located under the predicted lines.
As mentioned before, for the Lugaro et al., Cristallo et al. and Karakas et al., F production peaks at 2.2 M⊙ (see Lugaro et al., 2008). Quantitative predictions are provided only for 2.0 M⊙ AGB models in Cristallo et al. (2009) and Karakas et al. (2008) papers, so no comparison with different mass models could be performed. On the other hand, Stancliffe & Glebbeek (2008) prediction is lower than the measurements, possibly accounting for two of the upper limits (one CEMP-s and one CEMP-no star). However, it still cannot account for most of the upper limits derived for CEMP-s stars. In the Stancliffe & Glebbeek (2008) models, unlike the others, F production peaks at 1.5 M⊙. Hence, we cannot invoke lower mass models to reconcile the discrepancy in this case.
Karakas & Lattanzio (2007) provide F production predictions for several AGB masses. In the lower panel of Fig. 7 the predictions for the Karakas & Lattanzio (2007) models are plotted together with the data. Models are for masses 1.25, 1.75, 2.0, 2.5, 3.0, 3.5 and 4 M⊙ at a metallicity of [Fe/H]. The models at 1.25, 1.75 and 2.5 M⊙ seem to reproduce satisfactorily the two F measurements in our sample, even though it should be kept in mind that, as mentioned, their metallicity is higher than that of the models ([Fe/H]= and ). However, as discussed later in this section, the effect of metallicity on [F/C+N] is likely very small. On the other hand, when considering the measurements obtained for the whole sample, it can be noticed that predictions for F to C+N for masses from 1.25 to 2.5 M⊙ are higher than four out of the eight CEMP-s stars. While the predictions for models for 3, 3.5 and 4 M⊙ can account for the upper limits F to C+N ratios in those four CEMP-s, it is important to keep in mind that for [Fe/H] 2 all AGB stars with intial mass higher than M2.5 M⊙ will be affected by HBB, which burns C producing N (e.g., Karakas & Lattanzio 2007). A star polluted by such an object, would not be a C-rich, but rather N-rich, which is not the case of our sample (three out of those five CEMP-s have [C/N]0). Moreover, stars of this mass range are not very efficient in producing s-process elements (which are enhanced in eight stars in our sample, we provide Ba abundances in Table 2 for completeness). Finally, a simple back-of-the-envelope calculation adopting a Salpeter IMF and assuming that, in the considered mass range, the likelihood of having a companion is not affected by mass, indicates that the probability of observing, among a sample of eight CEMP-s stars with a low-mass companion (1.25M4 M⊙), four object that had a companion in the 2.5 to 4 M⊙ mass range, is very small (10-2). For these reasons, the possibility that the abundance ratios observed are due to stars more massive than 2.5 M⊙ seems highly unlikely. We note that for one of the CEMP-no stars, CS 30314-67, the derived upper limit to F abundance is also quite low and, similarly to most CEMP-s stars in our sample, is not reproduced by the low-mass, low-metallicity AGB models. This could be in principle used as an argument against the scenario which attributes their peculiar composition to pollution from low-mass AGB. However, given the issues that the models have in reproducing the observations as far as F is concerned in CEMP-s stars (which are known to arise from AGB mass transfer), the AGB pollution scenario cannot be ruled out.
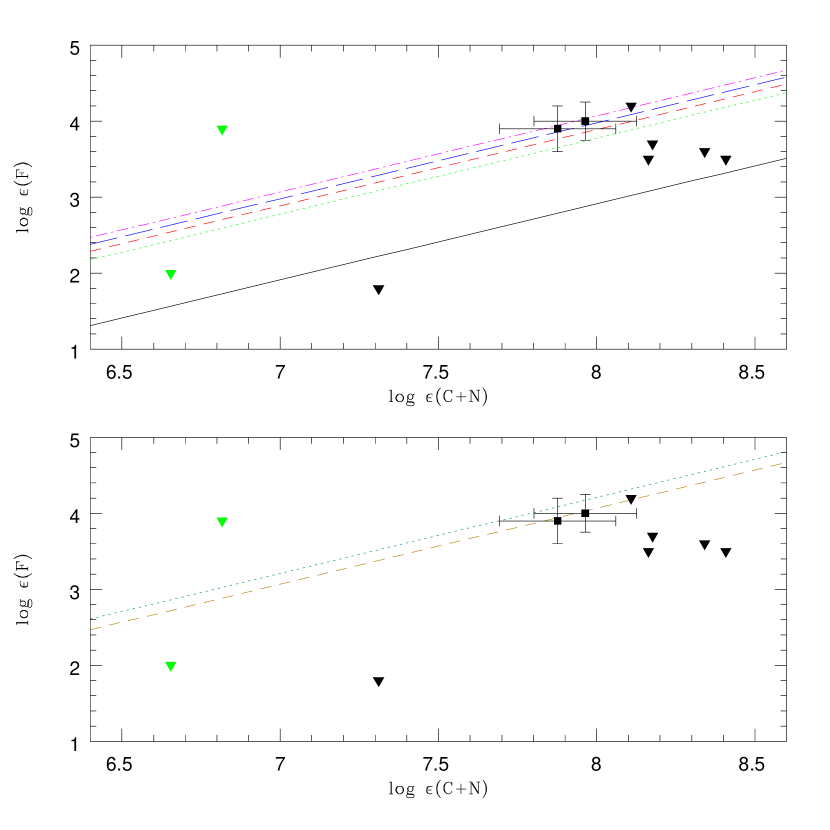
Notice that for each model discussed we consider the last thermal pulse. According to e.g. Izzard & Tout (2003) AGB evolution can be truncated by binary interaction, with the AGB star experiencing fewer thermal pulses with respect to predictions of an isolated object. To illustrate the evolution of the abundance ratios through different thermal pulses we plot (F) and (C+N) from 2 M⊙ (Cristallo et al. 2009), overplotting our measurements for comparison (see upper panel of Fig. 8). With the exception of one limit, in principle most of the upper limits could be explained by predictions of this particular model at different thermal pulses. In the lower panel, on the other hand, we show predictions from Cristallo et al. (2009) for a 2 M⊙ with two different metallicities, [Fe/H]=1.3 and 2.3. The figure shows a change of an order of magnitude in metalicity has only a small effect on the ratio [F/C+N]. For this reason, even though our sample star cover a large range in metallicity, we compare our measurement to the predictions at a single metallicity, the lowest one available. We invite the reader to keep in mind that this is an extrapolation to lower metallicity of the behaviour of the model and as such quite uncertain.
Beside the sources of uncertainties discussed in the previous paragraphs, as mentioned before, currently AGB nucleosynthesis calculations do not include CBP. Indeed, at typical AGB envelope conditions F can be depleted significantly by extra-mixing processes, depending on their efficiency (Palmerini, Nollett, & Busso 2008), via the 19F(p,) reaction. Therefore, the inclusion of an appropriate treatment for CBP in AGB modeling could possibly decrease the F production, bringing the predictions closer to the observations. It is noteworthy that partial F depletion has been proposed to be active at the tip of the previous Red Giant Branch (RGB) phase (Denissenkov et al. 2006). It must be kept in mind, however, that such a mechanism has been invoked to explain the decrease of F abundance in stars at the tip of the RGB in the globular cluster M 4, which, as likely all globular clusters, show abundance variations which are not observed in field stars (see e.g. Carretta et al., 2009). It is also important to note that one of the two stars in our sample for which we can actually measure F, HE 1152-0355, is quite close to the RGB tip.
5.4. Comparison with observations: Na
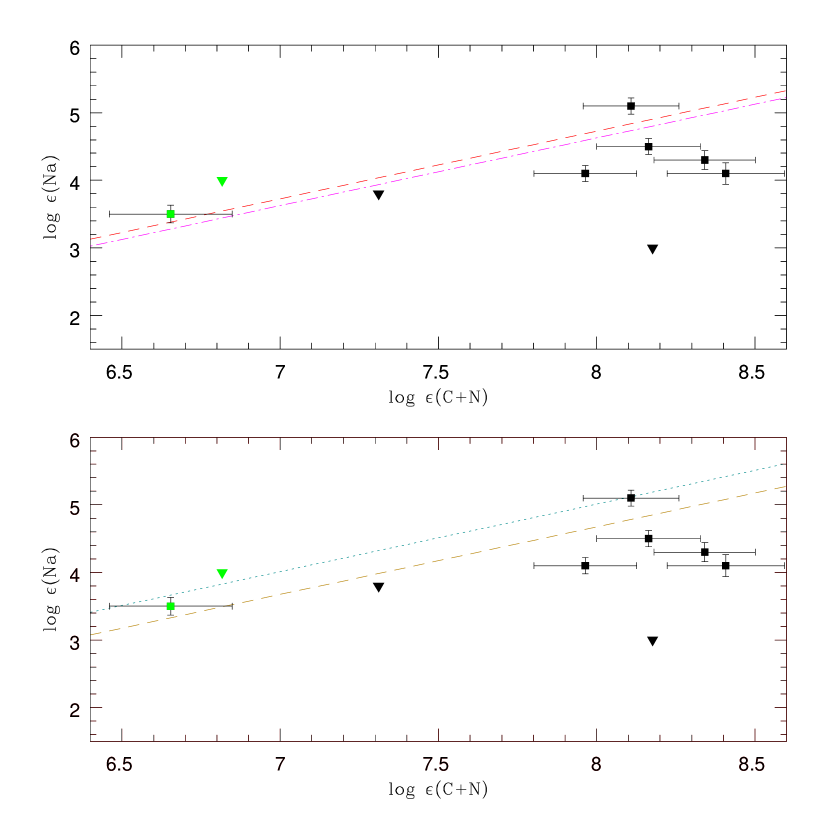
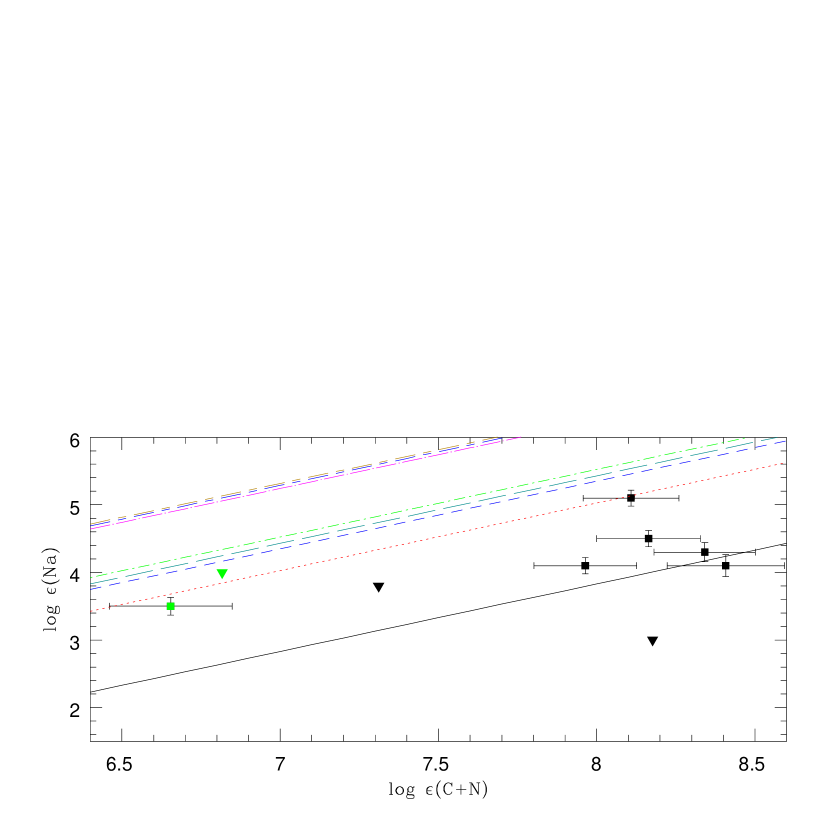
Models for low-mass AGB stars predict quite successfully the observed Na abundances. Na is produced by AGB stars in different ways. First, during the TP neutrons produced via the 22Ne(,n)25Mg may be captured by the 22Ne itself, producing 23Na via the reaction chain 22Ne(n,)23Ne()23Na. Secondly, sodium may be strongly produced also by 22Ne(p,)23Na. Indeed, after the TDU, at similar mass coordinate of the 14N-pocket a 23Na-pocket is formed in radiative conditions, where 23Na is given by the equilibrium between the production channel 22Ne(p,)23Na and the depletion channels 23Na(p,)24Mg and 23Na(p,)20Ne (see Cristallo et al. 2006 for details, and Bisterzo et al. 2006). Finally, a marginal contribution is given by neutron capture on 22Ne in the 13C-pocket. Despite these different processes, Na production in AGB stars is less affected by nuclear uncertainties compared to F. For these reasons, AGB predictions for Na are expected to be more robust than F. Fig. 9 shows Na and C+N in the sample stars together with the predictions from the same models as in Fig. 7. The upper panel shows two of the models represented in the correspondent panel of Fig. 7 because those are the only ones that provide Na abundance predictions. It is noteworthy how the discrepancy in Na between these two models (0.05 dex at a given (C+N) is much smaller than that in F between the same models (0.5 dex), supporting the idea that Na production is generally better understood and/or less sensitive to the recipes and parameters adopted in different families of models. As can be noticed from in Fig. 10, the measured Na abundances are consistent with pollution arising from a 1.25 to 1.75 M⊙ AGB star. Six out of seven sample CEMP-s for which Na was measured and both CEMP-no stars are consistent with having a companion in that mass range.
6. Conclusions
We have obtained IR high-resolution observations in a sample of ten CEMP stars, eight CEMP-s and two CEMP-no. The aim was to measure Na abundances, 19F contents from HF, O from CO and N from CN lines in the band.
A comparison of predictions from different families of low-metallicity, low-mass (1.25 to 1.75 M⊙ range) AGB nucleosynthesis models show that they reproduce well the observed Na abundances in the CEMP-s stars in our sample. This result strongly argues in favor of a polluter of low-mass for these objects, in agreement with the currently most accepted scenario for their formation.
F could only be measured in two CEMP-s stars, while for the remaining eight objects only upper limits could be derived. However, these data are sufficient to show that a range of [F/C+N] values are produced in low-metallicity AGB stars, in accord with predictions of the mass- and metallicity-dependence of F production in AGB models.
The only two F measurements obtained (the CEMP-s stars HE 1152-0355 and HD 5223 respectively at [Fe/H]=1.27 and 2.06) are accounted for, within the errors, low-mass, low-metallicity AGB models. On the other hand, most of the derived upper limits for F abundance in CEMP-s are not satisfactorily accounted for by nucleosynthetic computations. In fact, the comparison with four of the most recent models for low-mass (2.0 M⊙), low-metallicity AGB nucleosynthetic models shows that there are large differences in the predictions between different families of models, which cannot reproduce several of the upper limits, not providing any [F/C+N] ratios predictions low enough to account for the values measured in several of the sample stars. A comparison with Karakas & Lattanzio (2007) models for different masses indicates that only objects more massive (2.5 MM4 M⊙) that those generally considered as responsible for CEMP-s peculiar abundances (M1.5 M⊙) produce the [F/C+N] ratios observed in about two thirds of our CEMP-s sample. This possibility is not only unlikely because of simple IMF considerations, but it is also challenged by the fact that at low metallicity, HBB is active in stars in this mass range, producing N and depleting C (bringing the ratio to [N/C]1 (see e.g. Johnson et al., 2007)) and preventing the star from becoming a CEMP-s polluter. As shown in Fig 7, the Karakas & Lattanzio (2007) 1.25 M⊙ model is the low-mass AGB ones that comes closest to explaining the upper limits. Given the discussed spread present in F production in different models, it is indeed possible that it affects also predictions for other masses, including 1.25 M⊙ , hence accounting for the derived upper limits. It is however impossible, at present time, to systematically test this differences, as only Karakas & Lattanzio (2007) provide F production calculations for several AGB masses.
We discussed two possible solutions that could explain the lowest F upper limit range. One is that the standard evolution of an AGB star may be truncated by binary interaction, and a lower F abundance can be obtained in early TP pulses (even though this would lead to lower Ba production, which could make the accounting for observed Ba abundances possibly more challenging). The other is the action of CBP, which may reduce the F in the AGB envelope if such extra-mixing processes exposes material at temperatures high enough to activate 19F(p,).
The conclusion that can be drawn from the comparison between the data and the current models is that F production in low metallicity AGB stars is probably not as high as expected on the basis of the current models. It is important to keep in mind that, as discussed in the introduction, at solar metallicity model predictions are in agreement with the observations, therefore such problem seem to be peculiar to the low metallicity regime. AGB nucleosynthesis, especially at low metallicity, is still not fully understood and a large number of uncertainties affect in particular F nucleosynthesis. Improvements in nuclear reaction rate (such as 14C(,)18O and 18F(,p)21Ne) accuracy are needed, and a better grasp of the CBP mechanism is highly desirable. Only one of the available models, by Cristallo et al. (2009) takes into account the appropriate C, N and O enhancements in the computation of the stellar opacities; also, the prescription for mass loss is still rather uncertain. Moreover, currently no model takes into account the effect on the AGB evolution of the presence of a (close) companion, which could stimulate extra mixing and/or truncate the AGB phase (see e.g. Izzard & Tout 2003), affecting the nucleosynthesis. The inclusion of these ingredients into a new generation of AGB models might in the future be able to account for the present observations.
From an observational point of view, pursuing a larger number of F abundance measurements in CEMP stars is extremely important. In particular, K-band high-resolution spectral observations of cool (T4200 K) CEMP stars would allow actual measurements (rather than upper limit placements) of F even for low F abundances ((F)2). These measurements would provide more stringent constraints that are urgently needed for a future generation of AGB models and to effectively probe F chemical evolution.
References
- Abia et al. (2009) Abia, C., Recio-Blanco, A., de Laverny, P., Cristallo, S., Dominguez, I., & Straniero, O. 2009, ApJ, 694, 971
- Abia et al. (2010) Abia, C., et al. 2010, arXiv:1004.4451
- Alvarez & Plez (1998) Alvarez, R., & Plez, B. 1998, A&A, 330, 1109
- Aoki et al. (2002) Aoki, W., Ryan, S. G., Norris, J. E., Beers, T. C., Ando, H., & Tsangarides, S. 2002, ApJ, 580, 1149
- Aoki et al. (2007) Aoki, W., Beers, T. C., Christlieb, N., Norris, J. E., Ryan, S. G., & Tsangarides, S. 2007, ApJ, 655, 492
- Barbuy et al. (2005) Barbuy, B., Spite, M., Spite, F., Hill, V., Cayrel, R., Plez, B., & Petitjean, P. 2005, A&A, 429, 1031
- Barklem et al. (1998) Barklem, P. S., O’Mara, B. J., & Ross, J. E. 1998, MNRAS, 296, 1057
- Barklem & Aspelund-Johansson (2005) Barklem, P. S., & Aspelund-Johansson, J. 2005, A&A, 435, 373
- Beers et al. (1992) Beers, T. C., Preston, G. W., & Shectman, S. A. 1992, AJ, 103, 1987
- Beers et al. (2007) Beers, T. C., Sivarani, T., Marsteller, B., Lee, Y., Rossi, S., & Plez, B. 2007, AJ, 133, 1193
- Bisterzo et al. (2006) Bisterzo, S., Gallino, R., Straniero, O., Ivans, I. I., Käppeler, F., & Aoki, W. 2006, Memorie della Societa Astronomica Italiana, 77, 985
- Bisterzo et al. (2010) Bisterzo, S., Gallino, R., Straniero, O., Cristallo, S., Käppeler, F. 2010, MNRAS, 404, 1529
- Carretta et al. (2009) Carretta, E., et al. 2009, A&A, 505, 117
- Charbonnel (1995) Charbonnel, C. 1995, ApJ, 453, L41
- Christlieb et al. (2001) Christlieb, N., Green, P. J., Wisotzki, L., & Reimers, D. 2001, A&A, 375, 366
- Cohen et al. (2005) Cohen, J. G., et al. 2005, ApJ, 633, L109
- Cooke et al. (2010) Cooke, R., Pettini, M., Steidel, C. C., Rudie, G. C., & Jorgenson, R. A. 2010, arXiv:1011.0733
- Cristallo et al. (2006a) Cristallo, S. PhD thesis, INAF-Osservatorio Astronomico di Collurania, Teramo (http://terri1.oa-teramo.inaf.it/osservatorio/personale/cristallo/pag_in_eng.html)
- Cristallo et al. (2006b) Cristallo, S., Gallino, R., Straniero, O., Piersanti, L., & Domınguez, I. 2006, Memorie della Societa Astronomica Italiana, 77, 774
- Cristallo et al. (2009) Cristallo, S., et al. 2009, ApJ, 696, 797
- Cunha et al. (2003) Cunha, K., Smith, V. V., Lambert, D. L., & Hinkle, K. H. 2003, AJ, 126, 1305
- Cunha et al. (2008) Cunha, K., Smith, V. V., & Gibson, B. K. 2008, ApJ, 679, L17
- Decin (2000) Decin, L. 2000, Ph.D. Thesis, Katholieke Universiteit Leuven
- Denissenkov et al. (2006) Denissenkov, P. A., Pinsonneault, M., & Terndrup, D. M. 2006, ApJ, 651, 438
- Eggleton et al. (2008) Eggleton, P. P., Dearborn, D. S. P., & Lattanzio, J. C. 2008, ApJ, 677, 581
- Federman et al. (2005) Federman, S. R., Sheffer, Y., Lambert, D. L., & Smith, V. V. 2005, ApJ, 619, 884
- Fujimoto et al. (2000) Fujimoto, M. Y., Ikeda, Y., & Iben, I. J. 2000, ApJ, 529, L25
- Goorvitch (1994) Goorvitch, D. 1994, ApJS, 95, 535
- Goriely & Mowlavi (2000) Goriely, S., & Mowlavi, N. 2000, A&A, 362, 599
- Goswami et al. (2006) Goswami, A., Aoki, W., Beers, T. C., Christlieb, N., Norris, J. E., Ryan, S. G., & Tsangarides, S. 2006, MNRAS, 372, 343
- Gratton et al. (2000) Gratton, R. G., Sneden, C., Carretta, E., & Bragaglia, A. 2000, A&A, 354, 169
- Grevesse & Sauval (1998) Grevesse, N., & Sauval, A. J. 1998, Space Science Reviews, 85, 161
- Grevesse et al. (2007) Grevesse, N., Asplund, M., & Sauval, A. J. 2007, Space Science Reviews, 130, 105
- Gustafsson et al. (2008) Gustafsson, B., Edvardsson, B., Eriksson, K., Jørgensen, U. G., Nordlund, Å., & Plez, B. 2008, A&A, 486, 951
- Izzard & Tout (2003) Izzard, R. G. & Tout, C. A.. 2003, Publications of the Astronomical Society of Australia, 20, 345
- Herwig (2005) Herwig, F. 2005, ARA&A, 43, 435
- Johnson et al. (2007) Johnson, J. A., Herwig, F., Beers, T. C., & Christlieb, N. 2007, ApJ, 658, 1203
- Jonsell et al. (2006) Jonsell, K., Barklem, P. S., Gustafsson, B., Christlieb, N., Hill, V., Beers, T. C., & Holmberg, J. 2006, A&A, 451, 651
- Jorissen et al. (1992) Jorissen, A., Smith, V. V., & Lambert, D. L. 1992, A&A, 261, 164
- Kaeufl et al. (2004) Kaeufl, H.-U., et al. 2004, Proc. SPIE, 5492, 1218
- Karakas & Lattanzio (2007) Karakas, A., & Lattanzio, J. C. 2007, Publications of the Astronomical Society of Australia, 24, 103
- Karakas et al. (2008) Karakas, A. I., Lee, H. Y., Lugaro, M., Görres, J., & Wiescher, M. 2008, ApJ, 676, 1254
- Lee et al. (2006) Lee, H. Y., et al. 2006, International Symposium on Nuclear Astrophysics - Nuclei in the Cosmos,
- Lai et al. (2007) Lai, D. K., Johnson, J. A., Bolte, M., & Lucatello, S. 2007, ApJ, 667, 1185
- Lucatello et al. (2003) Lucatello, S., Gratton, R., Cohen, J. G., Beers, T. C., Christlieb, N., Carretta, E., & Ramírez, S. 2003, AJ, 125, 875
- Lucatello et al. (2005) Lucatello, S., Tsangarides, S., Beers, T. C., Carretta, E., Gratton, R. G., & Ryan, S. G. 2005, ApJ, 625, 825
- Lucatello et al. (2006) Lucatello, S., Beers, T. C., Christlieb, N., Barklem, P. S., Rossi, S., Marsteller, B., Sivarani, T., & Lee, Y. S. 2006, ApJ, 652, L37
- Lucatello et al. (2009) Lucatello, S., Masseron, T., & Johnson, J. A. 2009, Publications of the Astronomical Society of Australia, 26, 303
- Luck & Bond (1981) Luck, R. E., & Bond, H. E. 1981, ApJ, 244, 919
- Lugaro et al. (2004) Lugaro, M., Ugalde, C., Karakas, A. I., Görres, J., Wiescher, M., Lattanzio, J. C., & Cannon, R. C. 2004, ApJ, 615, 934
- Lugaro et al. (2008) Lugaro, M., et al. 2008, A&A, 484, L27
- Marsteller et al. (2005) Marsteller, B., Beers, T. C., Rossi, S., Christlieb, N., Bessell, M., & Rhee, J. 2005, Nuclear Physics A, 758, 312
- Masseron et al. (2006) Masseron, T., et al. 2006, A&A, 455, 1059
- Masseron et al. (2010a) Masseron, T., Johnson, J. A., Plez, B., van Eck, S., Primas, F., Goriely, S., & Jorissen, A. 2010a, A&A, 509, A93
- Masseron et al. (2010b) Masseron, T. et al. 2010b, in preparation
- Marigo (2002) Marigo, P. 2002, A&A, 387, 507
- Meynet & Arnould (2000) Meynet, G., & Arnould, M. 2000, A&A, 355, 176
- Meynet et al. (2006)
- Nollett et al. (2003) Nollett, K. M., Busso, M., & Wasserburg, G. J. 2003, ApJ, 582, 1036
- Otsuka et al. (2008) Otsuka, M., Izumiura, H., Tajitsu, A., & Hyung, S. 2008, ApJ, 682, L105
- Palacios et al. (2005) Palacios, A., Arnould, M., & Meynet, G. 2005, A&A, 443, 243
- Palmerini et al. (2008) Palmerini, S., Nollett, K., & Busso, M. 2008, Nuclei in the Cosmos (NIC X),
- Plez (1998) Plez, B. 1998, A&A, 337, 495
- Preston & Sneden (2001) Preston, G. W., & Sneden, C. 2001, AJ, 122, 154
- Renda et al. (2004) Renda, A., et al. 2004, MNRAS, 354, 575
- Ryan et al. (2005) Ryan, S. G., Aoki, W., Norris, J. E., & Beers, T. C. 2005, ApJ, 635, 349
- Schuler et al. (2007) Schuler, S. C., Cunha, K., Smith, V. V., Sivarani, T., Beers, T. C., & Lee, Y. S. 2007, ApJ, 667, L81
- Schuler et al. (2008) S. Schuler, K. Cunha, V.V Smith, T. Sivarani and T.C. Beers, 2008 in International Symposium on Nuclear Astrophysics, Nuclei in the Cosmos, PoS(NIC-X)072
- Smith et al. (2005) Smith, V. V., Cunha, K., Ivans, I. I., Lattanzio, J. C., Campbell, S., & Hinkle, K. H. 2005, ApJ, 633, 392
- Spite et al. (2005) Spite, M., et al. 2005, A&A, 430, 655
- Sneden et al. (2003) Sneden, C., et al. 2003, ApJ, 591, 936
- Stancliffe & Jeffery (2007) Stancliffe, R. J., & Jeffery, C. S. 2007, MNRAS, 375, 1280
- Stancliffe & Glebbeek (2008) Stancliffe, R. J., & Glebbeek, E. 2008, MNRAS, 389, 1828
- Stancliffe (2009) Stancliffe, R. J. 2009, MNRAS, 394, 1051
- Werner et al. (2005) Werner, K., Rauch, T., & Kruk, J. W. 2005, A&A, 433, 641
- Woosley & Haxton (1988) Woosley, S. E. & Haxton, W. C. 1988, Nature, 334, 45


| Star | RA | Dec | V | K | Obs | Exp. |
|---|---|---|---|---|---|---|
| ID | Date | Time (s) | ||||
| CS 22942-19 | 00 57 18.136 | 25 26 09.69 | 12.69 | 10.645 | 2007-10-21 | 1200 |
| CS 29497-34 | 00 41 39.818 | 26 18 54.48 | 12.22 | 9.996 | 2007-10-26 | 900 |
| CS 30314-67 | 20 52 50.986 | 34 19 40.52 | 11.85 | 9.028 | 2007-10-23 | 900 |
| CS 22948-27 | 21 37 45.774 | 39 27 22.31 | 12.660 | 10.427 | 2007-10-27 | 1200 |
| CS 29502-92 | 22 22 35.995 | 01 38 27.53 | 11.87 | 9.601 | 2007-10-24 | 1200 |
| CS 30322-23 | 21 30 32.184 | 46 16 24.72 | 12.21 | 9.313 | 2007-10-23 | 900 |
| HE 1152-0355 | 11 55 06.057 | 04 12 24.71 | 11.43 | 8.429 | 2008-02-26 | 720 |
| HE 1305+0007 | 13 08 03.849 | 00 08 47.40 | 12.223 | 9.600 | 2008-02-27 | 1200 |
| HD 187861 | 19 56 26.945 | 65 22 08.01 | 9.19 | 6.699 | 2007-10-21 | 180 |
| HD 5223 | 00 54 13.610 | 24 04 01.51 | 8.47 | 5.673 | 2007-10-21 | 180 |
| HD 122563 | 14 02 31.846 | 09 41 09.94 | 6.20 | 3.731 | 2008-02-28 | 45 |
| Star | Teff | [Fe/H] | [C/Fe] | [Ba/Fe] | |
|---|---|---|---|---|---|
| ID | (K) | (dex) | (dex) | (dex) | |
| CS 22942-19 | 5100 | 2.5 | -2.5 | 2.2 | 1.76 |
| CS 29497-34 | 4800c | 1.8c | -2.9c | 2.6c | 2.03c |
| CS 30314-67 | 4400 | 0.7 | -2.85 | 0.8 | -0.57 |
| CS 22948-27 | 4800c | 1.8c | -2.5c | 2.4c | 2.26c |
| CS 29502-92 | 4890 | 1.7 | -3.18 | 0.96 | -1.26 |
| CS 30322-23 | 4100 | -0.3 | -3.39 | 0.6e | 0.54 |
| HE 1152-0355 | 4000 | 1.0 | -1.27 | 0.58 | 1.58f |
| HE 1305+0007 | 4560 | 1.0 | -2.5g | 2.4 | 2.9 |
| HD 187861 | 4600 | 1.7 | -2.36 | 2.02 | 1.39 |
| HD 5223 | 4500 | 1.0 | -2.06 | 1.57f | 1.82f |
| HD 122563 | 4600 | 1.1 | -2.82 | -0.10 | -1.280.23 b |
| HE 1152-0355 | HD 5223 | |||||||
|---|---|---|---|---|---|---|---|---|
| Element | Teff | [Fe/H] | [C/Fe] | Teff | [Fe/H] | [C/Fe] | ||
| K | dex | dex | dex | K | dex | dex | dex | |
| O | 0.4 | 0.1 | 0.1 | -0.1 | 0.5 | 0.1 | 0.1 | -0.1 |
| N | 0.4 | 0.1 | 0.1 | -0.2 | 0.4 | 0.1 | 0.1 | -0.2 |
| F | 0.5 | 0.0 | 0.2 | 0.1 | 0.5 | 0.0 | 0.2 | 0.1 |
| Na | 0.2 | 0.1 | 0.1 | 0.1 | ||||
| Star | 12C/13C | (N) | [N/Fe] | (N)) | (O) | [O/Fe] | (O)) |
|---|---|---|---|---|---|---|---|
| CS 22942-19 | 12 | 6.4 | 1.1 | 0.22 | 7.2 | 1.0 | 0.21 |
| CS 29497-34 | 8 | 7.3 | 2.4 | 0.25 | 7.4 | 1.6 | 0.22 |
| CS 30314-67 | 5 | 6.3 | 1.4 | 0.25 | 6.4 | 0.6 | 0.23 |
| CS 22948-27 | 8 | 7.3 | 2.0 | 0.26 | 7.3 | 1.1 | 0.23 |
| CS 29502-92 | 6 | 5.4 | 0.8 | 0.25 | 6.8 | 1.2 | 0.22 |
| CS 30322-23 | 4 | 7.3 | 2.9 | 0.25 | 5.9 | 0.6 | 0.23 |
| HE 1152-0355 | 5 | 8.2 | 1.7 | 0.25 | 7.9 | 0.5 | 0.22 |
| HE 1305+0007 | 5 | 7.65 | 2.4 | 0.31 | 7.35 | 1.2 | 0.23 |
| HD 187861 | 10 | 7.6 | 2.3 | 0.32 | 7.5 | 1.3 | 0.31 |
| HD 5223 | 10 | 7.2 | 1.4 | 0.24 | 7.2 | 0.5 | 0.21 |
| HD 122563 | 15 | 5.8 | 0.8 | 0.21 | 6.8 | 0.9 | 0.21 |
| Star | (F) | [F/Fe] | (F)) | (Na) | [Na/Fe] | (Na)) | |
| CS 22942-19 | 4.2 | 2.1 | 5.1 | 1.3 | 0.12 | ||
| CS 29497-34 | 3.5 | 1.8 | 4.5 | 1.1 | 0.12 | ||
| CS 30314-67 | 2.0 | 0.3 | 3.5 | 0.05 | 0.13 | ||
| CS 22948-27 | 3.6 | 1.5 | 4.3 | 0.5 | 0.14 | ||
| CS 29502-92 | 3.9 | 2.5 | 4.0 | 0.9 | |||
| CS 30322-23 | 1.8 | 0.6 | 3.8 | 0.9 | |||
| HE 1152-0355 | 3.90 | 0.64 | 0.30 | ||||
| HE 1305+0007 | 3.5 | 1.4 | 4.0 | 0.2 | 0.16 | ||
| HD 187861 | 3.7 | 1.6 | 3.0 | -0.8 | |||
| HD 5223 | 4.00 | 1.44 | 0.24 | 4.1 | -0.2 | 0.12 | |
| HD 122563 | 2.5 | 0.8 | 3.5 | 0 |