Modeling Social Networks with Overlapping Communities Using Hypergraphs and Their Line Graphs
Abstract
We propose that hypergraphs can be used to model social networks with overlapping communities. The nodes of the hypergraphs represent the communities. The hyperlinks of the hypergraphs denote the individuals who may participate in multiple communities. The hypergraphs are not easy to analyze, however, the line graphs of hypergraphs are simple graphs or weighted graphs, so that the network theory can be applied. We define the overlapping depth of an individual by the number of communities that overlap in that individual, and we prove that the minimum adjacency eigenvalue of the corresponding line graph is not smaller than , which is the maximum overlapping depth of the whole network. Based on hypergraphs with preferential attachment, we establish a network model which incorporates overlapping communities with tunable overlapping parameters and . By comparing with the Hyves social network, we show that our social network model possesses high clustering, assortative mixing, power-law degree distribution and short average path length.
1 Introduction
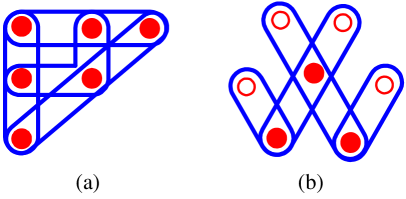
Social networks, as one type of real-world complex networks, are currently widely studied [1, 2, 3, 4]. Most social networks have common properties of the real-world networks, such as high clustering coefficient, short characteristic path length, power law degree distribution [1, 3, 5, 6]. Meanwhile, they possess some special properties like assortative mixture, community and hierarchical structure [4, 7, 8, 9]. The communities are the subunits of a network, which exhibit relatively higher levels of connections within the subunits and a lower connectivity between the subunits. Community structures feature important topological properties that have catalyzed researches on communities detection algorithms and on modularity analysis [10, 11, 12]. The communities overlap with each other when nodes belong to multiple communities. The overlap of different communities exists naturally in real-world complex networks, particularly in social and biological networks [13, 14, 15]. The overlap is present at the interface between communities and could also be pervasive in the whole network. The existence of overlapping communities challenge the traditional algorithms and methods [10] for community detection and network (nodes) partitioning. Ahn et al. [7] and Evans et al. [16] proposed that partitioning the links of the concerned network could be void of overlapping communities. Actually this method only works when two communities overlap at most in one node, as shown in Figure 1 (a). If two communities overlap in two or more nodes, they also overlap in links, as shown in Figure 1 (b) where the thick black links belong to two communities.
We propose that hypergraphs and line graphs of hypergraphs can be used to model the networks with overlapping communities. A hypergraph is the generalization of a simple graph. A hypergraph has the same types of nodes as a simple graph [17], but its hyperlinks111The hyperlinks here should not be confused with hyperlinks of WWW webs. Some papers call them hyperedges. can connect a variable number of nodes, . Here and denote the number of nodes and hyperlinks respectively. The line graph of a hypergraph is a graph in which every node of represents a hyperlink of and two nodes of are adjacent if and only if their corresponding links share node(s) in [18]. As discussed in Section 3, the line graph is a simple graph222A simple graph is an unweighted, undirected graph containing no self-loops (links starting and ending at the same node) nor multiple links between the same pair of nodes. when is linear333A hypergraph is linear if each pair of hyperlinks share at most one node. Hypergraphs where all hyperlinks connect the same number of nodes are defined as -uniform hypergraphs. A -uniform hypergraph is a simple graph., otherwise is a weighted graph. Applying the concepts to communities, we have that:
-
•
Hypergraphs: The nodes represent the communities; The hyperlinks denote the individuals who may belong to multiple communities. If an individual belongs to several communities, the corresponding nodes are connected by the corresponding hyperlink.
-
•
Line graphs of hypergraphs: The nodes represent the individuals. The communities consist of the participating nodes and all the links inter-connecting them. Two individuals are connected by a link if they belong to the same community. All the communities are the cliques in the line graph.
By using hypergraphs and their line graphs, we establish in this article a network model which incorporates overlapping communities structures for the first time with tunable overlapping parameters: the overlapping depth and the overlapping width (defined in Section 2.1). By introducing the preferential attachment to hypergraphs, we obtain a power-law community size distribution and a power-law degree distribution. Our network model also possesses high clustering, assortative mixing and short average path length. We compare the mentioned metrics of our model with the corresponding metrics of an online social network retrieved from a part of public profiles of Hyves, which is the popular Dutch social networking site.
2 Hypergraphs modeling social networks with overlapping communities
2.1 The overlapping parameters for communities
Human beings have multiple roles in the society, and these roles make people members of multiple communities at the same time, such as companies, universities, families/relationships, hobby clubs, etc. Proteins may also involve in multiple functional categories in biological networks. That is how overlapping communities emerge in social and biological networks. Sometimes only two communities overlap in the same node, and sometimes a huge number of communities overlap in the same node. Two communities may overlap only in one node and they may also overlap in many nodes.
Definition 1
We define the overlapping depth of an individual by the number of communities that overlap in that individual.
Definition 2
We define the overlapping width of two communities by the number of individuals that they overlap.
The nodes in Figure 1 denote the individuals. There are five individuals in Figure 1 (a) which have at least two communities overlapping in them. The overlapping depths of them are . As shown in Figure 1 (b), the overlapping widths of four community pairs, red and brown, red and dark blue, green and dark blue, brown and green, are . The individuals of the social network modeled by a -uniform hypergraph all belong to different communities, hence, the overlapping depths of all hyperlinks of a -uniform hypergraph are . The overlapping width of any node pair of a linear hypergraph is not larger than , regarding nodes as communities and hyperlinks as individuals,
2.2 Modeling social networks
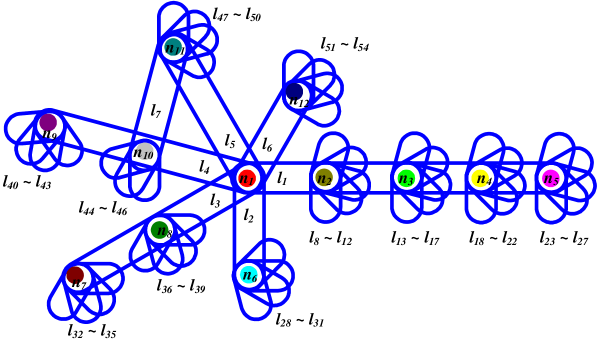
The hyperlinks and nodes represent the individuals and the communities respectively. People may participate in multiple communities. If an individual belongs to several communities, the corresponding nodes are connected by the corresponding hyperlink. We show how a hypergraph models a real social network by an example of Figure 2. This is a small social network of a research group NAS444Network Architectures and Services group at TU Delft. Despite of its small size, the overlapping communities still emerge. In Figure 2, there are communities as described in Table 1, and there are individuals among whom individuals belong to NAS group possessing overlapping depth of . The 7th individual joins in both the communities of a rock band and a soccer team.
The hypergraphs are too complicated to implement network analysis, however, the line graphs of hypergraphs are simple graphs or weighted graphs whose properties are easier to investigate.
| Nodes | Communities |
|---|---|
| TU Delft research group-NAS | |
| MIT research group | |
| Cornell Univ. research group | |
| IEEE/ACM ToN editorial board | |
| Kansas State Univ. research group | |
| Ericsson | |
| KPN (Dutch Telecom) | |
| Piano club | |
| TNO (A Dutch consulting company) | |
| A rock band | |
| A soccer team | |
| TU Delft research group-Bioinformatics |
| Communities | Individuals |
|---|---|
| to | |
| to | |
| to | |
| to | |
| to | |
| to | |
| to | |
| to | |
| to | |
| to | |
| to | |
| to |
3 The line graphs of hypergraphs
We store a hypergraph by its unsigned incidence matrix, which is defined as an matrix with the entries and the other entries of the th column being , when the hypergraph is incident to nodes .
Definition 3
The line graph of a linear hypergraph is defined as a graph , of which the node set is the set of the hyperlinks of the hypergraph and two nodes are connected by an unweighted link when the corresponding hyperlinks share one node.
Definition 4
The line graph of a nonlinear hypergraph is defined as a graph , of which the node set is the set of the hyperlinks of the hypergraph and two nodes are connected by an link of weight when the corresponding hyperlinks share node(s).
We observe that the line graph is a simple graph when is linear, and of nonlinear hypergraph is a weighted graph. The adjacency matrix of the line graphs of hypergraphs can be computed from the unsigned incidence matrices of hypergraphs.
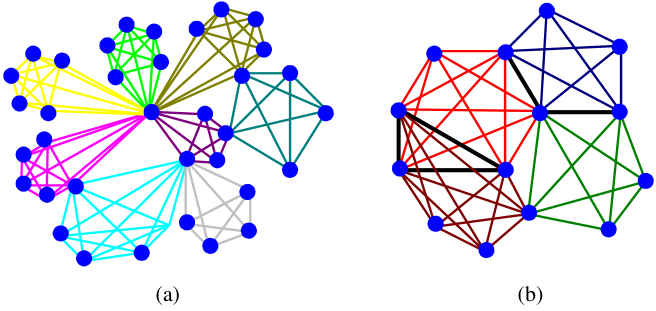
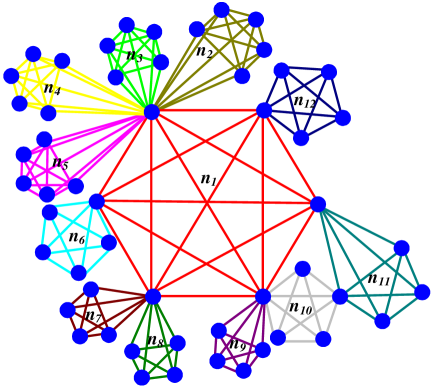
In Figure 3 we show the line graph of the hypergraph of Figure 2. As depicted, there are communities, of which communities have members and communities have members. Table 2 shows the members of all the communities of the network in Figure 3. We see that the line graph display the community structure and the overlap better.
4 The relation between the maximum overlapping depth and the smallest adjacency eigenvalue of the corresponding line graph
4.1 The line graph of linear and -uniform hypergraph
Since is -uniform, the unsigned incidence matrix of has exactly -entries and -entries in each column, and we have . Hence, all the diagonal entries of are . Due to the definition of linearity of hypergraphs, two columns of of have at most one -entry at the same row. Hence, all the non-diagonal entries of are either or . In addition, is a Gram matrix [19, 20]. Therefore the adjacency matrix of the line graph of linear and -uniform hypergraph is,
| (1) |
Both of the matrices and are positive semidefinite,
All eigenvalues of are non-negative. Due to , the adjacency eigenvalues of the line graph of linear and -uniform hypergraph are not smaller than , where is the overlapping depth.
We have more results for linear and uniform networks.
Lemma 5 (see [19])
For all matrices and with , it holds that and has extra zero eigenvalues,
Using Lemma 5 we have,
Using the definition of the adjacency matrix of the line graph in yields,
or
| (2) |
The adjacency matrix has at least eigenvalues of , where is the number of communities and is the number of individuals. The matrix is positive semidefinite, hence, the remaining eigenvalues of are not smaller than .
4.2 The line graph of linear and non-uniform hypergraph with
Since the maximum overlapping depth of is , the unsigned incidence matrix of has at most -entries in each column. Therefore, the largest diagonal entry of is . The adjacency matrix of the line graph of a linear and non-uniform hypergraph is,
| (3) |
where and , . By adding to , we make all the diagonal entries of equal to .
We show that is also positive semidefinite.
| (4) |
where is an arbitrary vector and . Hence, the adjacency eigenvalues of the line graph of a linear and non-uniform hypergraph are not smaller than , where is the maximum overlapping depth of .
4.3 The line graph of nonlinear and non-uniform hypergraph with
Since is nonlinear, there are some pairs of hyperlinks sharing more than one nodes. If hyperlink and hyperlink share nodes, then, by the definition of the line graph of hypergraph , the link weight of the corresponding link between node and in the line graph is . The line graph of nonlinear hypergraph becomes a weighted graph. In the language of social networks, the link weight of two individuals is if the two individuals are both members of communities. The adjacency matrix of the line graph of nonlinear and non-uniform hypergraph is,
where and , . By adding to , we make all the diagonal entries of are . We have proved that is positive semidefinite, hence, the adjacency eigenvalues of the line graph of nonlinear and non-uniform hypergraph are also not smaller than .
5 Hypergraphs with power-law degree distribution
As a common property, the node degree of many real-world large networks including social networks follows a power-law distribution [1, 5]. To model social networks better, we need to incorporate the power-law degree distribution into our hypergraph model. We introduce network growing and preferential attachment to our hypergraph model.
By preferential attachment, we generate linear and non-uniform hypergraphs only with overlapping depth of and . Starting with a small hypergraph (with nodes, ), which we call as a seed, at every time step we add a growing element which consists of three nodes and two hyperlinks of overlapping depth of and two hyperlinks of overlapping depth of . The four hyperlinks connect all the three nodes of a growing element to the existing hypergraph. Note that all four hyperlinks can only connect to one more node. The probability that a hyperlink will connect to a node depends on the current degree of , , where is the sum of degrees of all the existing nodes. In order to guarantee the linearity, the four hyperlinks must connect to different existing nodes at each time step. Figure 4 shows us the seed and the growing element we use in the simulation.
| Network | |||||||
|---|---|---|---|---|---|---|---|
| The Hyves social network | |||||||
| The line graph of the | |||||||
| generated hypergraph |
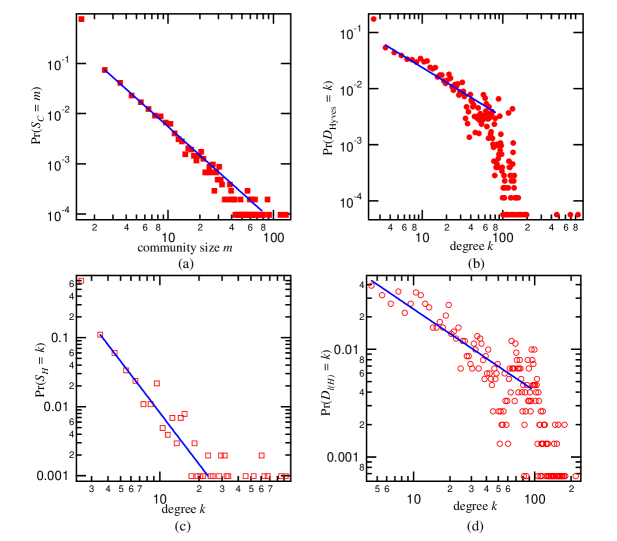
Using this model (with the seed and the growing element in Figure 4), we generate a hypergraph with nodes and hyperlinks, which is stored in the unsigned incidence matrix . By the formula , we compute the adjacency matrix of the line graph . The line graph555This line graph is unweighted, since the hypergraph we have generated is linear. of the generated hypergraph has nodes and links. The degree of a random node of a hypergraph is defined as the number of hyperlinks which are incident to that node, and it is essentially equal to the size of the corresponding community. The degree distribution of that generated hypergraph denotes actually the community size distribution, and strictly follows power-law distribution. The degree of a random node of the line graph is denoted as , and we show in Figure 5 that the degree distribution of the line graph approximately follows power-law distribution.
As the most popular online social networking site in Netherlands, Hyves has more than 10 million users, which means that more than half of the Dutch population are using Hyves. Nearly half of Hyves users make their profiles open to the public. From the open profiles we can see some information of users including companies, schools, colleges, clubs and other organizations, to which they belong. By using a breath-first search we found out that there are users claiming that they belong to some communities. The total number of these communities are . We make a network with users as nodes, and two users are connected by a link when they belong to the same community. We denote the size of a community as , which is defined as the total number of individuals belonging to that community. We compute the properties of the Hyves social network and the line graph of the hypergraph generated by our hypergraph model with preferential attachment. As shown in Table 3, both of these two networks have high clustering coefficient, positive assortativity coefficient, short average path length and similar exponent of the power-law degree distribution, although the size of the line graph is much smaller than the size of the Hyves social network. As depicted in Figure 5 (a) and (b), the community size of the Hyves social network follows a power-law distribution with exponent , and the degree distribution of the Hyves social network can also be fitted by a power-law function with exponent . Figure 5 (c) and (d) show us that the power-law degree distribution of the generated hypergraph is quite similar with that of the community size distribution of Figure 5 (a), and the exponent of power-law degree distribution of the line graph seems very close to the exponent in Figure 5 (b). Table 3 and Figure 5 show that our hypergraph model with preferential attachment has the common properties of real-world social networks, besides that community structure and community overlap are already incorporated.
6 Conclusion
We have modeled social networks with overlapping communities by hypergraphs and the line graphs of hypergraphs. The hyperlinks and nodes represent the individuals and the communities respectively. If an individual belongs to several communities, the corresponding nodes are connected by the corresponding hyperlink. Since the line graphs of hypergraphs are just simple graphs or weighted graph, we can implement the current network analysis techniques. We defined the overlapping depth of an individual by the number of communities that overlap in that individual, and we proved that the minimum adjacency eigenvalue of the line graphs of hypergraphs is not smaller than , which is the maximum overlapping depth of the whole network. We established a network model which incorporates overlapping communities structures for the first time with tunable overlapping parameters. By comparing our model with the online social network Hyves, we have shown that our network model possesses the common properties of large social networks.
References
- [1] Albert, R., Barabási, A.L.: Statistical mechanics of complex networks. Reviews of modern physics 74 (2002) 47–96
- [2] Boccaletti, S., Latora, V., Moreno, Y., Chavez, M., Hwang, D.U.: Complex networks: Structure and dynamics. Physics Reports 424 (2006) 175–308
- [3] Newman, M.E.J., Watts, D.J., Strogatz, S.H.: Random graph models of social networks. Proc. Natl. Acad. Sci. USA 99 (2002) 2566–2572
- [4] Girvan, M., Newman, M.E.J.: Community structure in social and biological networks. Proceedings of the National Academy of Sciences of the United States of America 99 (2002) 7821–7826
- [5] Barabási, A.L., Albert, R.: Emergence of scaling in random networks. Science (New York, N.Y.) 286 (1999) 509–512
- [6] Watts, D.J., Strogatz, S.H.: Collective dynamics of ’small -world’ networks. Nature 393 (1998) 440–442
- [7] Ahn, Y.Y., Bagrow, J.P., Lehmann, S.: Link communities reveal multiscale complexity in networks. Nature 466 (2010) 761–764
- [8] Newman, M.E.J.: Mixing patterns in networks. Phys. Rev. E 67 (2003) 026126
- [9] Van Mieghem, P., Wang, H., Ge, X., Tang, S., Kuipers, F.A.: Influence of assortativity and degree-preserving rewiring on the spectra of networks. The European Physical Journal B - Condensed Matter and Complex Systems (2010) 643–652
- [10] Fortunato, S.: Community detection in graphs. Physics Reports 486 (2010) 75 – 174
- [11] Newman, M.E.J., Girvan, M.: Finding and evaluating community structure in networks. Phys. Rev. E 69 (2004) 026113
- [12] Van Mieghem, P., Ge, X., Schumm, P., Trajanovski, S., Wang, H.: Spectral graph analysis of modularity and assortativity. Phys. Rev. E 82 (2010) 056113
- [13] Palla, G., Derenyi, I., Farkas, I., Vicsek, T.: Uncovering the overlapping community structure of complex networks in nature and society. Nature 435 (2005) 814–818
- [14] Evans, T., Lambiotte, R.: Overlapping communities, link partitions and line graphs. Proceedings of the European Conference on Complex Systems ’09 (2009)
- [15] McDaid, A., Hurley, N.J.: Detecting highly overlapping communities with Model-based Overlapping Seed Expansion. In: ASONAM 2010. (2010)
- [16] Evans, T.S., Lambiotte, R.: Line graphs, link partitions, and overlapping communities. Phys. Rev. E 80 (2009) 016105
- [17] Harary, F.: Graph Theory. Addison-Wesley, Reading (1969)
- [18] Bermond, J.C., Heydemann, M.C., Sotteau, D.: Line graphs of hypergraphs i. Discrete Mathematics 18 (1977) 235 – 241
- [19] Van Mieghem, P.: Graph Spectra for Complex Networks. Cambridge University Press (Cambridge, U.K., to appear) (2010)
- [20] Cvetković, D., Rowlinson, P., Simić, S.K.: Eigenvalue bounds for the signless laplacians. Publ. Inst. Math. (Beograd) 81 (2007) 11–27