Rigidity dependence of cosmic ray escape length in the Galaxy obtained from a comparison of proton and iron spectra in the range 3-3000 GV
Abstract
The simple leaky-box model of propagation of cosmic rays in the Galaxy is quite suitable for handling data on cosmic ray nuclei energy spectra and composition at GeV [1,2]. In the leaky-box model a full information about cosmic ray propagation in Galaxy is compressed to the single parameter - escape length, , characterizing mean grams of a matter passed by cosmic rays from sources to the Earth. In this paper we analyze the world data on proton and iron cosmic ray spectra collected in the past (HEAO, CRN et al.) and in series of recent electronic experiments (ATIC, CREAM, AMS, BESS, Tracer et al.) and obtain the rigidity dependence of escape length, , from the measured rigidity dependence of the protons/iron ratio. It quite agrees with the one estimated in standard manner from the secondary/primary nuclei ratio. But at GV the behavior of distinctly changes, that can (variant of explanation) point out to the change of proton/iron ratio in cosmic ray sources.
cosmic rays, propagation, escape length
1 Introduction
In spite of apparent absence of physical background for the leaky-box model, where the transport of energetic particles is described by introducing the mean escape time of cosmic rays from the Galaxy, and the cosmic-ray density, the source density, the gas density do not depend on coordinates, it may be applied to the study of diffusion and nuclear spallation of stable nuclei attended by the production of secondary relativistic nuclei in the interstellar gas [1] [2]. This can be explained by the concentration of cosmic rays sources and the interstellar gas in a relatively thin galactic disk immersed in the flat but thick cosmic-ray halo [1]. The spatial distribution in the low-density halo is the same for different stable nuclei because of the negligible nuclear spallation. The calculated intensities of stable nuclei for an observer at the galactic disk look as corresponding leaky-box expressions even for nuclei with large cross sections and all propagation is described by some escape length of cosmic rays from the Galaxy (measured in g/cm2) that is a function of particle rigidity . This important parameter means grams of a matter passed by cosmic rays from sources to the Earth in average. In [2] there was proposed a way to estimate the analogous parameter in the diffusion model - effective values of . It was shown that leaky-box is a good approximation to the widely known and used for the interpretation of various cosmic-ray data basic GALPROP (Galactic Propagation) model [3] with accuracy for all nuclei. In [2] values of were found for the three set of GALPROP parameters, corresponding to the three models of the propagations. 1) Plain diffusion model (PD)
2)Diffision with acceleration (DR)
3)Diffusion with damping (DRD)
For the comparison we present also the widely used approximation [4]:
| R, GV | 3.16 | 5 | 8 | 12.6 | 20 | 31.6 | 50 | 89 | 178 | 355 | 708 | 1412 | 2818 |
| 2907 | 2313 | 1875 | 1564 | 1347 | 1197 | 1095 | 1012 | 952 | 914 | 889 | 877 | 894 | |
| Errors | 249 | 212 | 105 | 47 | 43 | 101 | 41 | 56 | 65 | 84 | 143 | 166 | 150 |
| 2432 | 2281 | 1748 | 1676 | 1235 | 1203 | 1067 | 991 | 842 | 1053 | 955 | 976 | 1274 | |
| Errors | 249 | 212 | 105 | 50 | 40 | 101 | 40 | 54 | 57 | 97 | 154 | 185 | 447 |
The leaky-box approach due to its simplicity until very recent was used by many authors.
Intensity of CR nuclei with mass number near the Earth is connected with their spectrum in a source (if neglecting the energy losses at small energies and the contribution from the fragments produced from heavier nuclei) by the simple equation:
where - gas density, - interaction length for the nucleus with mass number A. (calculated from GALPROP). For protons 110 g/cm2 at 1 GeV and it decreases to 70 g/cm2 at 10000 GV, that is , from whence the well known equation arises:
where is the slope of dependence, , - the slopes of observed and source spectra correspondingly in the case of power-like laws.
But while interaction length for the iron nuclei is much smaller
, there is the rigidity region
for Fe nuclei where
reaching the asymptotic value (proton and Fe spectra are parallel), when at becomes much smaller than .
We see that one can try to estimate the rigidity
dependence of from the ratio
of any two spectra in the interval , but
with essential reservations:
- to bear in mind that the intrinsic
property of the leaky-box model
is the independence of on cross section and as a result on
the type of nucleus;
- to assume that all types of nuclei are produced in the same type of sources
and the chemical composition of accelerated particles in the sources does not
depend on rigidity in the investigated interval -
- to use nuclei with significantly different interaction lengths, besides, the contribution of fragments
among them should be negligible;
- to find way to estimate .
Proton and iron spectra are most suitable ones for this task.
The main question is: if available in our days experimental data are enough for this task?
2 Experimental data
As we are going to analyze spectra at fixed rigidity, we need the spectral data measured at remote intervals of energy per particle. Interval pointed out in title, 3-3000 GV, corresponds to the energy per particle interval 2.3 GeV - 3 TeV for protons and 44 GeV - 82 TeV for iron nuclei. So we are doomed to use data from different experiments. Moreover only with appearance of new data on iron nuclei from the experiment Tracer [19], measured in uniquely wide energy range (=30 GeV-80 TeV), this task probably can be solved. Data obtained in ATIC2 experiment [11] are very important also, because they fill up the gap between data obtained by magnetic spectrometers and ones obtained with calorimeters and emulsions.
We include in the consideration experimental points, which satisfy the conditions:
a) energy interval lies between 3 and 10000 GV,
b) errors don’t exceed ,
c) calibration on accelerators is done (that is why Sokol experiment
was excluded).
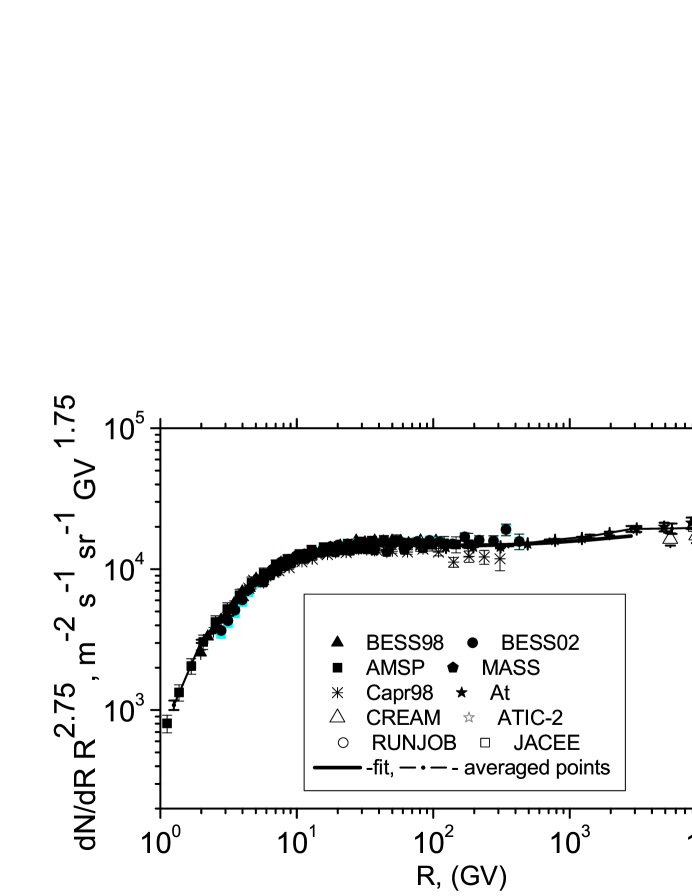
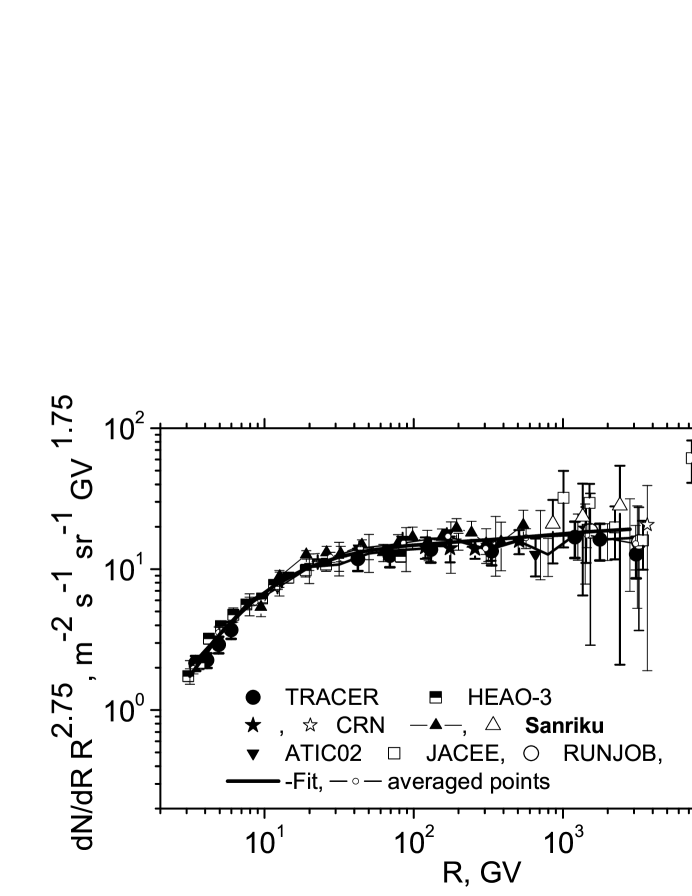
Fig. 1 and Fig. 2 represent proton and Fe spectra measured in different experiments. The points satisfying above enumerated conditions are denoted by filled symbols.
Proton data are got from the following experiments: MASS91 [5], BESS-98 [6], [7]BESS02, AMS [8, 9], [10], ATIC02 [11], CREAM [12], JACEE [13, 14], RUNJOB [15]. Fe nuclei are from: HEAO-3 [16], CRN [17], TRACER [18, 19], [11], Sanriku [20]. Data were reduced to fixed modulation potential MV by calculation similar to [10].
Fortunately points satisfying above mentioned conditions are little scattered. For further work and convenience one needs to approximated these dependencies by any way. In the Fig. 1 and 2 we denote by thick line the best fit of corresponding scatter points, that is a polynomial function of the fifth order. In the Table 1 this fit is denoted as ” ” with errors in the upper two rows.
Moreover, we calculated averaged points in the every from 14 R-bins getting errors which include statistical significance and a divergence of experimental points fallen in the fixed bin (thin lines with errors in Fig. 1,2.). In the Table 1 averaged points are denoted as ” ” and they are presented in the lower two rows.
3 Results and discussion
The leaky-box Ed. (5) written for the proton and Fe spectra allows us to express the value of effective escape length by means of the ratio of proton/iron measured spectra (from Table 1), the source chemical composition (which does not depend on rigidity and should be determined any how) and known values of :
The Eq. (6) will work obviously only
in the range of rigidities
where is not much smaller than : at
.
To demonstrate expected application range
of Eq. (6) we choose
the critical value corresponding
to . It means that
the region and is the asymptotic
region where
spectra become parallel and not sensitive to the .
For three models embedded in GALPROP
(see Introduction) the corresponding values of look like below:
1) 3.6 TV for PD model(),
2) 6.9 TV for DRD model(),
3) 46.8 TV for DR model(),
4) 69000 TV for RD model( for the very flat energy
dependence considered in [21] being chosen
for the explanation of the ”knee” in PCR by the change of propagation mechanism.
So comparable with the experimental maximal (see Table 1) may be only for very steep dependencies, as in the cases of PD or DRD models. In this case we determine the value of from the asymptotic ratio of taking into account minor corrections. We estimate .
The variant of calculation by the Eq. (6) for the experimental values of from the Table 1 and =800 give the next approximation: , that is much lower than the expected dependence estimated by the ratio (1)-(4). This means that our assumption of steep decrease with energy R 3 TV (as ) is not fully correct.
For the analysis of the set of flat dependencies where TV and there is no possibility to estimate the asymptotic values it is proposed to ”normalize” at GV by the one obtained from B/C measurements. The values of obtained from B/C - ratio occur between 2.8 g/cm2 (DR model - (2)) and 3.45 g/cm2 (PD model (1)). The point 50 GV was chosen because the large body of data on are in a good coincidence in this point [22], from the other side at the GV the contribution of reacceleration processes surely should be small.
Then value could be determined using
2.8 -3.45 g/cm2, and =
=1067+40 (from Tabl. 1). By Eq. (6) we get the
corresponding interval for = 490 - 535.
Substituting obtained limit values of and measured
regidity dependence of proton/iron spectra from Tabl. 1 in Eq. (6) we
calculate two variants of rigidity
dependencies of , presented in Fig. 3.
The upper one (with 490) could be approximated
in the interval GV as
.
The lower one (with 535) could be approximated as
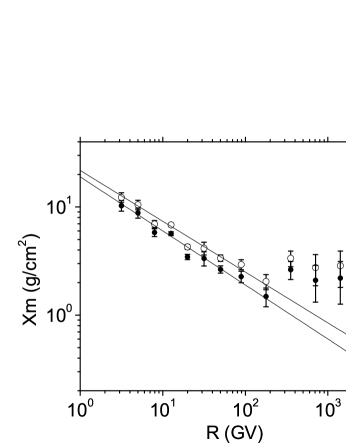
Up to the 300 GV the obtained from protons/iron ratio rigidity dependence of escape length can be approximated by the power-like law: , that is in a good agreement with the one estimated in standard manner from secondary/primary nuclei ratio (1)-(4). But at GV the behavior of changes significantly. It is caused by the ”improper” behavior of the slopes of proton and iron spectra at GV, = 2.71 [19] and =2.63 0.03 [11]. They are in a striking contradiction with the expected values: the Fe spectrum should be flatter than proton spectrum (see Eq.(5)).
Here it is worth noting that in the region 300 GV-3 TV (Fig.1, 2) the principal contribution for protons comes from ATIC2 data [11] and for iron nuclei it comes from the Tracer data [19].
So if we believe that both these important experiments are reliable, we should inevitably conclude that in the range 300 GV there is a change of proton/iron ratio in cosmic ray sources. Some authors of ATIC have come to this conclusion already [23].
In summary we would like to stress that the region 300 GV - 10 TV continues to be of importance, and the result that spectrum of iron nuclei is flatter than proton spectrum needs to be confirmed in other experiments.
The work is supported by RFBR grant 10-02-01443-a, V.S.Ptuskin - RFBR grant 10-02-00110a.
References
- [1] V.S. Berezinskii, S.V. Bulanov et al.Astrophysics
- [2] V.P. Ptuskin et al. On leaky-box approximation to GALPROP. Astrop. Phys. 31 284 (2009).
- [3] A.W. Strong, I.V. Moskalenko. Astrophys. J. 509, 212 (1998). of Cosmic Rays. North-Holland, Amsterdam (1990).
- [4] F.C. Jones, A. Lukasiak, et al. The Modified Weighted Slab Technique: Models and Results. Astrophys. J. 547, 264 (2001) .
- [5] M. Cireella, M. Ambriola, et all. Measurement of primary CR hydrogen and helium by the Wizard collaboration. Advanced in space Research 27, N4, 755 (2001).
- [6] T. Sanuki et al. (BESS 98). Ap. J., 545, 1135 (2000).
- [7] A. Yamamoto for the BESS Collaboration. Latest Results from BESS and Future Prospects. Proc. of 28th ICRC. Tsukuba. 8, 347 (2003).
- [8] J. Alcaraz, B. Alpat, et al. Phys. Let. B, 494, 193. (2000).
- [9] M. Aguilar, J. Alcaraz, et al. Phys. Rep., 366, 331, (2002).
- [10] Boezio et al., Ap. J., 518, 457 (1999).
- [11] A.D. Panov, J. Adams et al Energy spectra od abundent nuclei of PCR by ATIC02 data - final results Izv. RAN, ser. fiz. (2008)??? (in russian).
- [12] ??? Proc of 30th ICRC collaboration, Merida Mexico, OG1-778. (2007)( ) http:/(www.icrc2007.unam.mx).
- [13] K. Asakimori et al. ApJ.502.278. (1998).
- [14] (JACEE collaboration). Proc. of 25th ICRC (Durban, South Africa.). 4. 1. (1997).
- [15] V.A. Derbina et al et al. Cosmic-ray spectra and composition in the energy range 10-1000 TeV/particle obtained by the RUNJOB experiment. Astrophys. J. 41. (2005).
- [16] J.J. Englemann, P. Ferrando, A. Soutoul, et al. Charge composition and energy spectra of cosmic-ray nuclei for elements from Be to Ni - results from HEAO-3-C2. Astron. and Astroph., 233, 96, (1990).
- [17] D. Muller, D. Swordy, S.P. L’Heureux et al (CRN).Energy spectra and composition of primary cosmic rays. Astrophys. J. 374, 356 (1991).
- [18] M. Ave, et al. Propagation of High-Energy Cosmic Rays through the Galaxy: Discussion and Interpretation of TRACER Results. Proc. of 30th ICRC, (Merida, Mexica.) OG1-1192(http:/www.icrc2007.unam.mx), (2008).
- [19] M. Ave, P.J. Boyle, F. Gahbauer, et al. ApJ, 678, 262, (2008).
- [20] M. Ichimuraet et al. Phys. Rev. D, 48, 1949, (1993).
- [21] N.N. Kalmykov, A.V.Timohin. Changes of energy spetra of different nuclear group during the propagation of cosmic rays in the Galaxy. Izv. RAN,ser. fiz. (2006)
- [22] A.W. Strong, I.V. Moskalenko, et al. Annu. Rev. Nucl. Part. Sci. 57, 285, (2007).
- [23] V.I. Zatsepin and N.V. Sokolskaya. Astron. Astrophys. 458 (2006) 1.